 ?Mathematical formulae have been encoded as MathML and are displayed in this HTML version using MathJax in order to improve their display. Uncheck the box to turn MathJax off. This feature requires Javascript. Click on a formula to zoom.
ABSTRACT
Soil carbon dioxide (CO2) fluxes are a critical component in understanding carbon sequestration. In sub-Saharan Africa, empirically measured CO2 emissions data from diverse land-use systems is limited. Soil CO2 emission rates were measured in the Limpopo Province, South Africa for 12 months at two-week intervals in natural systems (forest and shrubland) and commercially managed orchards (avocado and citrus) to establish seasonal dynamics of soil CO2 emissions across these land-use systems. The results showed a variation in emission rates with the variation depending on the season. In the spring and winter, soil CO2 emission rates in citrus were four times higher than in the shrubland due to higher moisture levels. However, in the summer season, the forest emission rates were 40% higher than in citrus due to higher soil organic carbon content. Organic carbon stocks were higher in the forest (1.19 kg/m2) compared to the other land uses. This study revealed differences in soil CO2 emission rates among land-use systems, with the cumulative amount of CO2 emitted over a 12-month period following the order: forest (39.3 tons/ha) > citrus (36.1 tons/ha) > shrubland (28.1 tons/ha) > avocado (26.9 tons/ha). Thus, understanding the emission patterns from various ecosystems can inform strategies for mitigating greenhouse gas emissions.
Introduction
The rate at which CO2 is emitted from soils varies with land use systems (Shi et al. Citation2014; Toru and Kibret Citation2019; Anokye et al. Citation2021). The variation is attributed to several factors, chief among them being the organic matter content, management practices, and environmental conditions such as soil temperature and moisture (Iovieno et al. Citation2009; Balogh et al. Citation2011; Guntiñas et al. Citation2013; Mehra et al. Citation2018; Kotroczó et al. Citation2023). Lång and Hetmanenko (Citation2023) found that land use systems that have higher organic matter emitted more CO2 compared to those with lower organic matter. The quality of the organic matter has also been found to play a significant role as it affects the decomposition rates (Wang et al. Citation2022). Additionally, anthropogenic influences such as the conversion of natural forests to cultivated lands, accelerate the loss of soil CO2 in the atmosphere (Tolimir et al. Citation2020).
The influence of the aforementioned factors on soil CO2 emission rates would be expected to vary seasonally as temperatures and moisture conditions change. However, the response to the variation in the prevailing environmental conditions would be expected to vary depending on the nature of the system. Currently, there is limited information on the seasonal variability in soil CO2 emission rates and its subsequent impact on cumulative CO2 emitted in land-use systems that differ on their anthropogenic influence and physiognomy. Also, the potential driving factors into the seasonal variability in soil CO2 emission in distinct land use systems are still not well elucidated. There is very limited information comparing responses of soil CO2 emission rates in natural systems to systems with significant anthropogenic influence.
Some studies have been done on the variation of CO2 emission in different land use systems (Shi et al. Citation2014; Thomas et al. Citation2014; Toru and Kibret Citation2019; Anokye et al. Citation2021) but most have been seasonal and thus missing on the temporal variations that occur in the year. Additionally, some of these studies have been carried out in totally different environments. For example, the study of Anokye et al. (Citation2021) was conducted in the tropical region where rainfall is bimodal and ranging from 1300 to 1500 mm per annum. Toru and Kibret (Citation2019) study was conducted in a high altitude area of about 2800 m above sea level with rainfall averaging 930 mm per year. There are also other studies that focussed on seasonal variations (Wang et al. Citation2016; Tsai et al. Citation2020; Wu Citation2020; Munjonji et al. Citation2021) but these were either mainly focussing on one land use system or the temporal resolution was too course. For instance, Wu (Citation2020) and Wang et al. (Citation2016) determined CO2 emission at monthly intervals in the alpine meadows and semiarid temperate grassland, respectively. However, it is known that CO2 emission rates respond strongly to soil moisture and temperature fluctuations (Bond-Lamberty and Thomson Citation2010; Chang et al. Citation2012; Guntiñas et al. Citation2013). The variation in the CO2 emission rates due to the fluctuations in soil moisture and temperature have an impact on the cumulative amount of CO2 emitted in certain land use system. For an accurate accounting of the amount of CO2 emitted from the soils, measurements should be made at a significantly high temporal resolution.
According to the Department of Agriculture, Forestry and Fisheries (DAFF) (Citation2020), approximately 19 000 ha of land is under avocado production in South Africa. Citrus occupies about 89 000 ha (DAFF Citation2020). The majority of the sub-tropical fruit production areas are in the Limpopo Province. Due to the significant proportion of land planted to sub-tropical fruits, it is critical to understand how much CO2 is emitted in those systems in comparison to the natural systems from which they were converted. It is well known that most CO2 emitted into the atmosphere comes from the burning of fossil fuels (Yoro and Daramola Citation2020) but Agriculture, Forestry, and Other Land Use (AFOLU) also contribute significantly to the total CO2 (Smith et al. Citation2014). It is believed that a quarter (10–12 GtCO2eq/yr) of all anthropogenic greenhouse gas emissions come from this sector. Therefore, for modelling purposes and proper mitigation strategies, it is critical to account for every source and to understand the driving factors of CO2 emission.
It is against that background that this study seeks to: (1) understand how the rate of soil CO2 emission in natural forest and shrubland compare with commercially managed sub-tropical fruit orchards (avocado and citrus); (2) investigate whether the difference in the rate at which soil CO2 is emitted from different land use systems is maintained throughout the year or it varies with the season? and (3) identify the major contributing factors to soil CO2 emissions in the selected land use systems.
Materials and methods
Description of the study sites
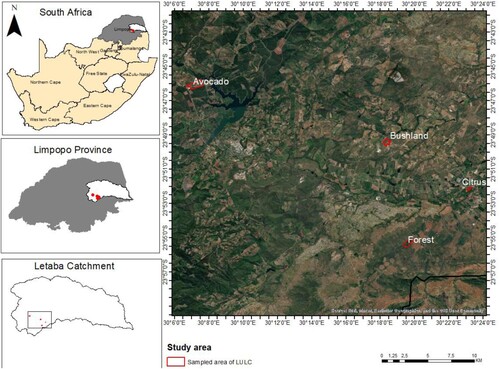
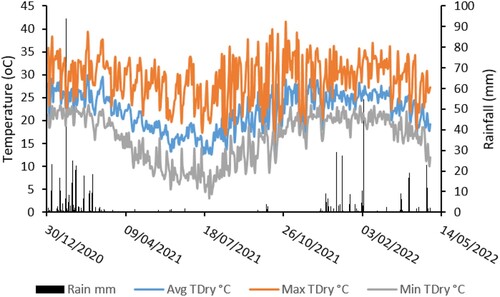
The research was conducted at the Letaba Catchment, located between longitudes 30.116° and 30.417° East and latitudes 23.733° and 24.000° South in the Limpopo Province of South Africa. The geographical location of the different land use systems is shown in . This area experiences a mean annual temperature ranging between 18 °C to 28 °C with the precipitation ranging from 300 to 1200 mm per annum (Querner et al. Citation2016). During the experimental period, the study area received a unimodal rainfall from around November until March (). A total of 320 mm was received during the study period with very little to no rainfall being received between April to October. The winter season was much colder with minimum temperatures falling to as low as 5°C in July and as high as 41°C in October.
Experimental setup and management
The experiment was set up as a split-plot design in which the seasons (summer, autumn, winter, and spring) were the main plots and the land use and land cover types (avocado (Persea Americana), citrus (Citrus sinensis), natural forest and shrubland) were the subplots. Three 20 × 20 m experimental plots were set up randomly in each land use type.
The natural forest was characterised by tall trees and a dense understory while the shrubland was characterised by short Mopane (Colophospermum mopane) trees. These two land use systems were pristine and without any significant antropogenic influence. The avocado and citrus the orchards were commercially managed. All the fruit trees were at the fruit-bearing stage and more than 10 years old. The avocado trees were spaced at 7 × 3.5 m resulting in 408 trees per hectare. The citrus trees were spaced at 7 × 3 m resulting in 476 trees per hectare. The irrigation in both orchards was by sprinkler jets and the schedule differed with the season. Generally, irrigation was applied for 2 h a day and three times a week in autumn and winter (March to August) and 3 h a day, 3 days a week in spring and summer (September to February). Fertilisation is done following soil and foliar analysis whereby the samples are normally collected in March and sent for analysis. Thus, depending on the deficient nutrient fertilisers are then applied through fertigation, foliar sprays or granules.
Soil chemical properties
Soil samples were collected from the three 20 × 20 m experimental plots set up randomly in each land use type. Soil samples were collected form the top 0–15 cm. The soil pH and EC were measured using the pH and EC metres. The soil pH was measured in both water and KCl. P, Mn, Zn, Cu and K were extracted in Ambic-2, with 0.25M NH4HCO3 and determined using Inductively Coupled Plasma (ICP). Exchangeable Ca, Mg and extractable acidity were extracted in 1M KCl. The effective CEC was calculated as the summation of Ambic-2 extractable K and KCl-extractable acidity, Mg and Ca. Percent acid saturation of the ECEC was calculated as ‘extractable acidity’ × 100/(Ca, Mg, K, ‘extractable acidity’). The total C, N and S were determined using the Automated Dumas dry combustion method.
Bulk density
Soil bulk density was determined using the core ring method (Blake and Hartge Citation1986). Metal core rings with a diameter of 5 cm and a height of 5 cm were used to collect undisturbed soil samples in the top 5 cm of the soil. The soils were oven dried at 105 °C for 24 h and weighed to determine the dry mass of the soils. The bulk density was then calculated as the ratio of the mass of the dry soil to the volume of the core.
Inflitration rates
The infiltration rate was measured using mini-disk infiltrometres (Decagon Devices, U.S.A.). The infiltration measurements carried out once in each experimental plot.
Aggregate stability
Aggregate stability was determined using the mean weight diameter (MWD). Soil aggregates in the top 0–15 cm of the soil were collected using a spade. The soil samples were analysed for aggregate stability using the wet sieving method as outlined by Elliott (Citation1986). Air-dried soil aggregates were separated into four fractions (small and large macro-aggregates, micro aggregates and silt and clay) by wet sieving. The MWD, a measure of soil aggregate stability was calculated by the EquationEquation (1)(1)
(1) outlined by (Blaser et al. Citation2017):
(1)
(1) where MWD denotes the mean weight diameter, LM denotes the large macro-aggregates %, sM denotes the small macro-aggregates %, m denotes the micro aggregates and s and c denotes silt % and clay %.
Soil carbon stocks
Soil carbon stocks refer to the amount of carbon in a soil layer of known bulk density. Soil carbon stocks are normally expressed as weight/mass per unit area and are commonly limited to the soil fraction of less than 2 mm in size. Soil C stocks were calculated using EquationEquation (2)(2)
(2) (Batjes Citation1996):
(2)
(2) where Soil C stock is soil carbon stock (kg C m−2), Ctot is the total carbon content (g C g−1 soil), BD is bulk density (kg m−3); d is soil depth (m). Carbon stocks were calculated from the top 5 cm since bulk density was only determined at that depth.
Installation of chambers and measurement of soil CO2
The CO2 chambers were installed in March 2021. The CO2 chambers were made and installed in the field according to the USDA-ARS GRACEnet Project Protocols (Parkin and Venterea Citation2010). The gas chambers were however modified and interfaced with an infra-red CO2 sensor, GMP343 CO2 probe along with MI70 data logger (Vaisala, Vantaa, Finland) to allow for in-situ CO2 measurements. The chambers consisted of two separate PVC rings: (1) a PVC ring/collar (0.20 m diameter and 0.15 m in height) and (2) another PVC ring (0.20 m diameter and 0.10 m height) sealed on one side with a PVC circle to make a chamber lid. The chamber lid had a small gas ball valve on it to discourage pressure build-up in the chambers during measurements. The chamber lid was also perforated on top to fix the mounting flange that holds the GMP343 CO2 probe. The collars were hammered into the soil to a depth of 0.05 m leaving 0.10 m above the soil. These collars were left in the soil for a few days to settle before the measurements were taken. When taking measurements, the chamber lid with the fixed CO2 probe on it was attached to the collar and secured with a tube strip to make it airtight. The CO2 probe GMP343 was set to record measurements every 30 s for 5 min. All measurements were taken between 10h00 and 14h00. CO2 fluxes, which is the emission rate of CO2, were measured for 12 months starting from June 2018 to May 2019 at 2 weeks intervals. The emission rates were then calculated as described by Munjonji et al. (Citation2020).
Calculation of CO2 fluxes
The CO2 probe GMP343 gives measurements of CO2 in parts per million (ppm). The measurements were first converted to mg m−3 using the ideal gas law. Temperature variation on measurement days were taken into consideration as shown in EquationEquation (3)(3)
(3) below:
(3)
(3) where CO2 ppm is the measured concentration of CO2 at any given time, T is the chamber temperature (Temperature in °C + 273.15 K) and P is the ambient pressure.
CO2 concentration in mg m−3 was then plotted against time (min) giving a slope in mgm−3 min−1. The slope of the resulting regression lines was then determined for each installed chamber. The slope was then multiplied by the volume of the chamber (0.00628 m3) and divided by the area covered by the chamber (0.0314 m2), giving the resultant flux in mg m−2 min−1, which describes the CO2 flux out of the soil.
The cumulative amount of CO2 was then calculated by multiplying the soil CO2 emission rate with the time interval. This was done by taking an average between two measurement points and multiplying by the number of days between those days as outlined in the EquationEquation (4)(4)
(4) below:
(4)
(4) where Cum CO2 is cumulative CO2, R is the soil CO2 emission rate (kg/ha/day), t is the time i.e. the day on which a measurement was taken, i and n represent the present and the last reading. The formula used in this study was adopted from Liu et al. (Citation2023).
Soil temperature and moisture
Soil moisture and surface temperatures were measured every 2 weeks at the same time when the soil CO2 measurements were taken. The measurements were taken just adjacent to the installed CO2 chambers. Measurements were done using a soil moisture metre (SM150 T, Delta-T Devices Ltd, Cambridge, United Kingdom). Soil surface temperature was taken as the temperature recorded by the CO2 probe GMP343 during measurements.
Statistical analysis
A two-way ANOVA was run using SPSS 25 (SPSS, U.S.A.) to determine the effect of the season (main factor), land use system (sub-plot) and their interaction on the CO2 emission rates, temperature and soil moisture. A standard Randomised Complete Block Design was used for the other parameters. Where differences were significant, Tukey HSD was used to separate the means.
Results
Soil physical and chemical properties in the different land use systems
Soil clay content in the avocado was more than 3 times higher than observed in other land use systems but differences in the other three land use systems were not observed (). The shrubland and the citrus land use systems had the highest proportion of sand particles of more than 80 The bulk density of the soils was higher in avocado and the shrubland compared to citrus and the forest. However, none of the soils were deemed to be compacted as the bulk densities were within the acceptable range. Soil organic carbon stocks were considerably higher in the forest (1.19 kg/m2) than in citrus (0.23 kg/m2), but there was no significant difference between citrus carbon stocks and those of avocado and the shrubland. The Mean Weight Diameter showed that the soil aggregates were more stable in the natural systems (forest and the shrubland) compared to the commercial citrus and the avocado plantation. The infiltration rate was found to be excessively higher in the shrubland and relatively lower in the other land use systems.
Table 1. Soil physical properties in the four land use systems.
The selected soil chemical properties varied among the land use systems except for manganese which showed no differences (). The phosphorus content observed in the avocado plantation was 45.9 mg/kg and was more than 33 times higher than observed in the shrubland (1.37 mg/kg). Calcium and magnesium were found to be significantly higher in the forest compared to the rest of the other land use systems which showed no variations amongst themselves. The pH of the soils was alkaline in the citrus (7.45) and higher than the other three land use systems which had slightly acidic soils which pH averaging just below 5. It was observed that the commercial orchards (avocado and citrus) and exceptially higher amounts of Zn compared to natural systems (Forest and Shrublands). The amount of Zn in citrus orchards was more than 60 times higher than observed in the natural systems. The percent nitrogen content was low in all systems with values less than 0.25%. The avocado plantations had about 0.23% which was higher than the other three which averaged less than 0.10%.%. Soil organic carbon varied among the land use systems with the forest having organic carbon content of 1.47% which was about 194% higher than observed in the citrus plantations.
Table 2. Soil chemical properties in the four land use systems.
Soil moisture and surface temperatures
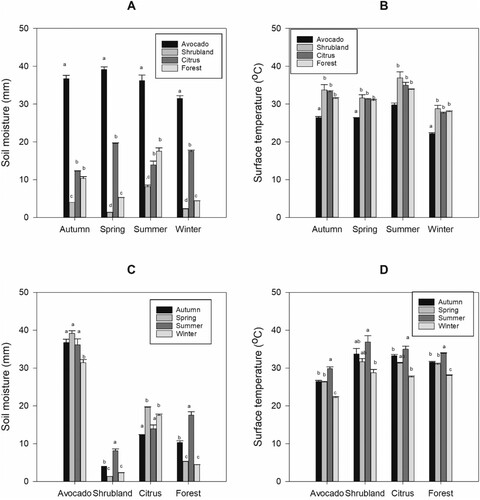
Due to the interaction observed between season and the soil moisture and temperature, data was split according to season and analysed for the differences in land use. (A) shows that the avocado plantation had higher moisture levels compared to the other land use systems throughout all four seasons. The average moisture level per season in avocados was always above 30 mm regardless of the season. The second highest moisture level was observed mostly in the citrus, especially in the spring and winter seasons. Citrus and avocado are commercially managed plantations with irrigation. The forest and the shrubland had lower moisture levels in the spring and in the winter. In the winter and spring seasons, the avocado orchards had 7 times more moisture compared to the forest and more than 15 times higher than that in the shrubland. However, in the summer season, moisture levels improved significantly in the natural systems, especially in the forest. In the summer season, the avocado moisture levels were reduced to only about 2 times higher than what was observed in the forest. Surface temperatures were lower in the avocado plantation compared to the other seasons which did not show any variations among themselves. The average surface temperatures were observed to be relatively lower in the winter season compared to the other seasons. In contrast to the moisture levels, surface temperatures were lower in avocado compared to the other land use systems and this was observed in all seasons. (C) and (D) show how both moisture and surface temperatures varied between seasons in each land use system. It was noted that higher variations in soil moisture levels among the seasons were observed in natural systems (forest and shrubland). For both the forest and shrubland, there was a 300% increase in moisture level.
CO2 emission rates
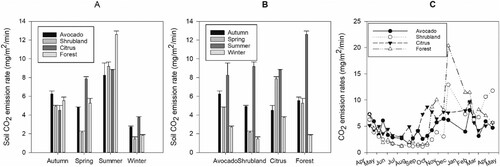
Soil CO2 emission rates varied among the four land-use systems in the different seasons. In autumn differences were observed between the avocado and the citrus. (A) shows that the peak emission rates for the different land use systems varied with season. The avocado plantations had higher soil CO2 emission rates compared to others even though it was not significantly different to the shrubland and forest. In the spring and winter seasons, the citrus had the highest soil CO2 emission rates which were four times higher than those in the shrubland. However, in the summer season, the forest exhibited the highest emission rates of 12.60 mg/m2/min compared to the other land use systems. The forest soil CO2 emission rates were more than 40% higher than those observed in the citrus. (B) shows the emission rates in each land use system varied per season. In all the land uses it shows that summer is the peak season for CO2 emission rates and the lowest was observed mostly in the winter season except in the avocado. In the forest and shrubland, soil CO2 emission rates in winter were 8.2 and 6.4 times lower than in the summer, respectively. However, in the irrigated orchards the soil CO2 emission rates were 3.0 and 2.4 times lower in winter compared to summer in avocado and citrus, respectively. (C) shows how the soil CO2 emission rates measured every 2 weeks varied for the different land use systems over the experimental period.
Cumulative CO2 emission
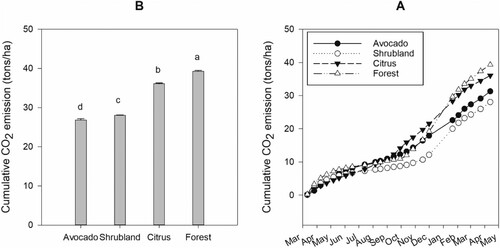
The cumulative amount of CO2 emitted from the soils over the whole year varied with land use (). (A) shows that the highest cumulative amount of CO2 emitted was from the forest with a total of 39.31 tons/ha and the least amount was from the avocado with a total cumulative of 26.84 tons/ha. (B) shows how the cumulative amount of emitted soil CO2 evolved from the beginning of the experiment in April until the end of May. At the end of the experimentation period, the cumulative CO2 followed the order forest > citrus > shrubland > avocado.
Relationships between soil moisture, surface temperature and soil CO2 emission rates in the four land use systems
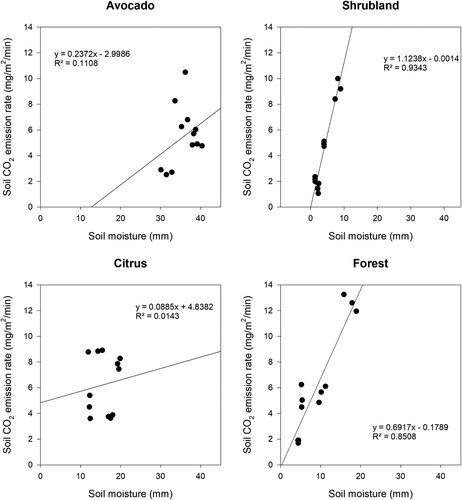
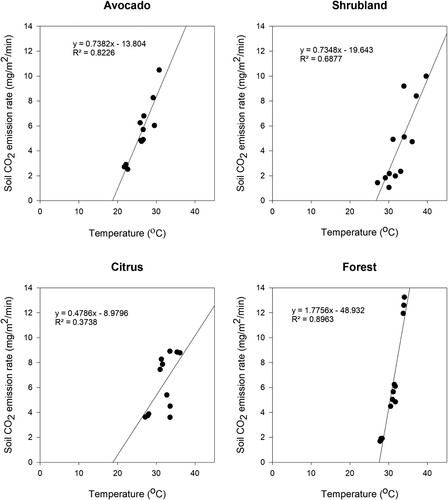
The relationship between soil moisture and soil CO2 emission rates in the four land use systems varied depending on whether the system is irrigated or not (). In irrigated avocado and citrus plantations, a very weak relationship was observed between soil moisture and CO2 emission rates. In contrast, the bush and the forest, exhibited a significant positive relationship to the soil moisture content. shows that soil moisture explained about 93%and 85% of the variation observed in the shrubland and forest respectively. In contrast, soil moisture could only explain about 11% of the variation observed in the avocado while accounting for only 1% in the citrus. The response of CO2 emission rates to soil temperature was also strongly positive in all land use systems except for the citrus (). shows that the surface temperature explained 82, 69, 37 and 90% of the variation in Soil CO2 emission rates. In all systems, an increase in surface soil temperatures resulted in increased soil CO2 emission rates.
Relationships between soil physical and chemical properties to cumulative CO2 emitted in the four land use systems
The total amount of CO2 emitted was correlated with selected soil physical and chemical properties and the results showed that the bulk density (−0.69) and the clay content (−0.50) were significant and negatively related to the cumulative CO2 emitted (). Soil organic carbon content and stocks showed a very weak positive relationship with the total emitted CO2. Similarly, a non-significant but negative relationship was found between the infiltration rate and the mean weight diameter. With soil chemical properties, Ca and Mg were positively related to the cumulative CO2 emitted while the K content and Mn showed a negative relationship (). Other micronutrients such as Zn and Cu also showed negative relationships with the total amount of CO2 emitted.
Table 3. Correlation between soil physical and chemical properties to the cumulative CO2.
Discussion
The findings of this study clearly showed that the CO2 emission rates and the cumulative amount of CO2 released throughout the year varied with land use systems ( and ). These findings are in agreement with other studies that have investigated the variations of soil CO2 emission among different land-use systems (Shi et al. Citation2014; Toru and Kibret Citation2019; Anokye et al. Citation2021). Anokye et al. (Citation2021) investigated the soil carbon stocks and CO2 emission rates in arable lands, palm plantations and natural forests. Their findings showed that both CO2 emission rates and carbon stocks varied among the land use systems. They found carbon stocks to be higher in the forest land. Similarly, this current study also found significantly higher carbon stocks in the natural forest land compared to other land use systems. The higher carbon stocks in the natural forest could be attributed to the high organic carbon content (1.47%) which was more than 3 times higher than the organic carbon content in citrus. This high soil organic carbon (SOC) content in the forest can be attributed to high litter fall, deaths of fine roots, and senescing plants especially annuals among others (Boyle Citation2005). Additionally, the high SOC can be attributed to minimum disturbance of the soil as no tillage operations occurred in the natural systems. Tillage has been shown to hasten oxidation of soil organic matter (Jat et al. Citation2019). However, the high organic carbon content and stocks in the forest did not directly translate into higher CO2 emission rates in all seasons when compared to other land use systems. Instead, the results revealed a trend in which CO2 emission rates in irrigated commercial orchards and natural systems responded differently to seasonal variations (). The forest only exhibited the highest CO2 emission rates in the summer when moisture was available and temperatures higher.
The results further showed that in seasons that are characterised by longer drier periods and low residual soil moisture such as the winter and a large portion of the spring season, higher soil CO2 emission rates were observed in irrigated systems such as avocado and citrus and this was more pronounced in winter. However, in a wet season and a season associated with higher residual soil moisture the emission rates were highest in forest ((A)). This interaction between season and land use systems is mainly due to moisture availability. Irrigated systems do not lack any moisture throughout the year while in the natural systems, the soil is predominantly dry in winter and spring seasons due to a lack of rainfall (Pan et al. Citation2019). As a result, decomposer microbe activities are low in such seasons (Petraglia et al. Citation2019) as soil moisture is one of the most important factors influencing microbial activity in soil (Chang et al. Citation2012; Guntiñas et al. Citation2013). Consequently, lower soil CO2 emissions were observed in drier seasons. The impact of soil moisture on the CO2 emission rates was also confirmed by the correlation analyses between CO2 emission rates and soil moisture () where weaker relationships were observed in irrigated orchards compared to natural systems. Stronger relationships (R2 > 0.85) were observed in the shrubland and forest land use systems. In the natural systems that depend on rainfall there is a wider variation in moisture content and thus prompting stronger responds of microbial activity. Conversely, in irrigated systems the response of soil CO2 emissions to moisture is not that strong. On the other hand, all systems responded strongly to the surface temperature. The effect of temperature on soil emission rates was also revealed when soil CO2 emission rates were found to be significantly lower in winter compared to the other seasons. In the forest, the CO2 emission rates were more than 8 times higher in summer compared to winter. Munjonji et al. (Citation2021) found similar results in citrus but the results were however contrary to what was observed by Tsai et al. (Citation2020) in the mangrove where CO2 emission rates were found to be higher in winter.
Cumulatively all land use systems varied in the total amount of CO2 emitted in a year. The cumulative amount followed the order forest (39.3 tons/ha) > citrus (36.1 tons/ha) > shrubland (28.1 tons/ha) > avocado (26.9 tons/ha) (). The results show that even though at an ecosystem level forests store large amounts of carbon (Toru and Kibret Citation2019) and are net sinks of carbon, they are also characterised by higher soil respiration rates as observed in this study. The findings also show that even though forest show lower soil CO2 emission rates in drier seasons (winter and spring), the higher rates in summer and autumn compensate for that and leads to higher cumulative CO2 emission. The low cumulative emission in avocados can be attributed to the high clay content (60%) in the orchards (). Soils with higher clay content may result in low diffusion rates of CO2 due to the tortuous nature of the micropores (Neira et al. Citation2015). The relationship between cumulative soil CO2 emission and soil physical properties showed that cumulated CO2 was negatively related to clay content (R2 = −0.50). Thus the higher the clay content the lower the cumulated CO2. The bulk density also showed a negative relationship with cumulative CO2 (R2 = −0.50) and the avocado was one of the land use systems with higher bulk density. Furthermore, the shrubland had lower emission rates which could be attributed to the lower litter quality (Petraglia et al. Citation2019; Wang et al. Citation2022). The shrubland was mostly composed of Mopane (Colophospermum mopane) shrubs which are known to have leaves with a higher C:N ratio as well as higher lignin content (Mlambo and Mwenje Citation2010; Soni et al. Citation2016).
Anthropogenic influences on land use systems such as the commercially managed avocado and citrus orchards results in alterations of both soil physical and chemical properties through practices such as mulching, fertilisation and even physical alteration of the soil via tillage (Natale et al. Citation2012; López et al. Citation2014). This study has also found that most nutrients (both macro and micro) were higher in commercially managed orchards compared to natural systems (). This was something expected as orchards were fertilised while natural systems rely on soil organic matter decompositions. However, despite the higher fertilisation in orchards, the forest showed higher Ca and Mg. Such management practices may, in turn, influence the microbial decomposer community (López et al. Citation2014) and consequently CO2 emission rates (Zhang et al. Citation2020; Liu et al. Citation2023). It is therefore important for future studies to understand the impact of such management practices on microbial diversity. Some studies have shown that some polyvalent cations such as magnesium (Mg), calcium (Ca) and manganese (Mn) can stabilise carbon stocks (Dlamini et al. Citation2019). Calcium and Mg are particularly applied as lime to ameliorate soil acidity in many fruit orchards (Natale et al. Citation2012) but their impact of carbon stocks is not well elucidated yet. This study found that forest systems which had higher Ca and Mg concentration also had higher soil organic carbon stocks.
Conclusions
This study sought to find out how the rate of soil CO2 emission in natural systems (forest and shrubland) compares with commercially managed sub-tropical fruit orchards (avocado and citrus) and whether the difference in the rate at which CO2 is emitted from different land use systems is maintained through the season? The results showed a significant variation in soil CO2 emission rates among the land-use systems where irrigated orchards emitted CO2 at much higher rates in dry seasons compared to natural systems. However, in the wet season higher rates were observed in the forest revealing a strong interaction effect between the land use system and season. The forest was the largest emitter of soil CO2 throughout the year. This study highlights how diverse land-use systems contribute to CO2 emissions, a major greenhouse gas driving climate change. The understanding these emissions patterns from various ecosystems can inform strategies for mitigating greenhouse gas emissions. The study also highlights the significance of seasonal variations in CO2 emissions. Consequently, future research could dig deeper into the underlying mechanisms driving these seasonal patterns and explore how changing climate particularly global warming might influence these dynamics. Finally, continued monitoring of soil CO2 emissions across different land-use systems and over longer time scales could provide a more comprehensive understanding of emissions trends and the potential impacts of changing land management practices. This study also established that forest release more soil CO2 but it is unknown how much of the released CO2 escapes the canopy.
Acknowledgements
The authors would like to acknowledge the Risk and Vulnerability Science Centre, University of Limpopo for funding this research. The authors also acknowledge community in the Lataba catchment, Mahela Group and ZZ2 for allowing the research on their farms.
Disclosure statement
No potential conflict of interest was reported by the author(s).
Additional information
Funding
Notes on contributors
Lawrence Munjonji
Lawrence Munjonji is Senior Lecturer in the Department of Soil Science, Faculty of AgriSciences, University of Stellenbosch.
Hlengiwe Ntuli Innocentia
Hlengiwe Ntuli Innocentia is Soil Science MSc Student in the Department of Soil Science, Plant Production and Agricultural Engineering, University of Limpopo.
Kingsley Kwabena Ayisi
Kingsley Kwabena Ayisi is Professor and Manager of the Risk and Vulnerability Science Center, University of Limpopo.
Phesheya Dlamini
Phesheya Dlamini is a Professor in the Department of Soil Science, Plant Production and Agricultural Engineering, University of Limpopo.
Kabisheng Emmanuel Mabitsela
Kabisheng Emmanuel Mabitsela holds an MSc in Soil Science and is Research Assistant at the Risk and Vulnerability Science Center, University of Limpopo.
Carol Mmapula Lehutjo
Carol Mmapula Lehutjo holds an MSc in Agronomy and is a Research Assistant at the Risk and Vulnerability Science Center, University of Limpopo.
Phumlani Sabelo Magnificent Zwane
Phumlani Sabelo Magnificent Zwane holds an MSc in Geography and Environmental Science and is Technician at Sol Platjie University.
References
- Anokye J, Logah V, Opoku A. 2021. Soil carbon stock and emission: estimates from three land-use systems in Ghana. Ecol Process. 10:11. doi:10.1186/s13717-020-00279-w.
- Balogh J, Pintér K, Fóti S, Cserhalmi D, Papp M, Nagy Z. 2011. Dependence of soil respiration on soil moisture, clay content, soil organic matter, and CO2 uptake in dry grasslands. Soil Biol Biochem. 43:1006–1013. doi:10.1016/j.soilbio.2011.01.017.
- Batjes NH. 1996. Total carbon and nitrogen in the soils of the world. Eur J Soil Sci. 47:151–163. doi:10.1111/j.1365-2389.1996.tb01386.x.
- Blake GR, Hartge KH. 1986. Bulk density. In: Klute A, editor. Methods of soil analysis, part 1–physical and mineralogical methods, 2nd Edition, agronomy monograph 9. Madison: American Society of Agronomy–Soil Science Society of America; p. 363–382.
- Blaser WJ, Oppong J, Yeboah E, Six J. 2017. Shade trees have limited benefits for soil fertility in cocoa agroforests. Agric Ecosyst Environ. 243:83–91. doi:10.1016/j.agee.2017.04.007.
- Bond-Lamberty B, Thomson A. 2010. Temperature-associated increases in the global soil respiration record. Nature. 464:579–582. doi:10.1038/nature08930.
- Boyle JR. 2005. Forest soils. In: Hillel D., editor. Encyclopedia of soils in the environment. Oxford: Elsevier; p. 73–79.
- Chang X, Zhu X, Wang S, Luo C, Zhang Z, Duan J, Bai L, Wang W. 2012. Temperature and moisture effects on soil respiration in alpine grasslands. Soil Sci. 177:554–560. doi:10.1097/SS.0b013e31826bdd5d.
- DAFF. 2020. A profile of South African avocado market value chain. Department of Agriculture, Fisheries and Forestry.
- Dlamini P, Mbanjwa V, Gxasheka M, Tyasi L, Sekhohola-Dlamini L. 2019. Chemical stabilisation of carbon stocks by polyvalent cations in plinthic soil of a shrub-encroached savanna grassland, South Africa. CATENA. 181:104088. doi:10.1016/j.catena.2019.104088.
- Elliott E. 1986. Aggregate structure and carbon, nitrogen, and phosphorus in native and cultivated soils. Soil Sci Soc Am J. 50:627–633. doi:10.2136/sssaj1986.03615995005000030017x.
- Guntiñas M, Gil-Sotres F, Leiros M, Trasar-Cepeda C. 2013. Sensitivity of soil respiration to moisture and temperature. J Soil Sci Plant Nutr. 13:445–461.
- Iovieno P, Morra L, Leone A, Pagano L, Alfani A. 2009. Effect of organic and mineral fertilizers on soil respiration and enzyme activities of two Mediterranean horticultural soils. Biol Fertil Soils. 45:555–561. doi:10.1007/s00374-009-0365-z.
- Jat HS, Datta A, Choudhary M, Yadav AK, Choudhary V, Sharma PC, Gathala MK, Jat ML, Mcdonald A. 2019. Effects of tillage, crop establishment and diversification on soil organic carbon, aggregation, aggregate associated carbon and productivity in cereal systems of semi-arid Northwest India. Soil Tillage Res. 190:128–138. doi:10.1016/j.still.2019.03.005.
- Kotroczó Z, Makádi M, Kocsis T, Béni Á, Várbíró G, Fekete I. 2023. Long-term changes in organic matter content and soil moisture determine the degree of root and soil respiration. Plants. 12:251. doi:10.3390/plants12020251.
- Lång K, Hetmanenko V. 2023. Effect of soil properties on soil respiration in cultivated soils with varying organic matter content. Mires Peat. 29:7.
- Liu Z, Huang F, Wang B, Li Z, Zhao C, Ding R, Yang B, Zhang P, Jia Z. 2023. Soil respiration in response to biotic and abiotic factors under different mulching measures on rain-fed farmland. Soil Tillage Res. 232:105749. doi:10.1016/j.still.2023.105749.
- López R, Burgos P, Hermoso JM, Hormaza JI, González-Fernández JJ. 2014. Long term changes in soil properties and enzyme activities after almond shell mulching in avocado organic production. Soil Tillage Res. 143:155–163. doi:10.1016/j.still.2014.06.004.
- Mehra P, Baker J, Sojka RE, Bolan N, Desbiolles J, Kirkham MB, Ross C, Gupta R. 2018. Chapter five – a review of tillage practices and their potential to impact the soil carbon dynamics. In: Sparks D. L., editor. Advances in agronomy. London: Academic Press; p. 185–230.
- Mlambo D, Mwenje E. 2010. Influence of Colophospermum mopane canopy cover on litter decomposition and nutrient dynamics in a semi-arid African savannah. Afr J Ecol. 48:1021–1029. doi:10.1111/j.1365-2028.2010.01208.x.
- Munjonji L, Ayisi KK, Mafeo T, Maphanga T, Mabitsela K. 2021. Seasonal variation in soil CO2 emission and leaf gas exchange of well-managed commercial Citrus sinensis (L.) orchards. Plant Soil. 465:65–81.
- Munjonji L, Ayisi KK, Mudongo EI, Mafeo T, Behn K, Mokoka M, Linstädter A. 2020. Disentangling drought and grazing effects on soil carbon stocks and CO2 fluxes in a semi-arid African savanna. Front Environ Sci. 8:207–209.
- Natale W, Eduardo D, Parent S-É, Etienne L. 2012. Chapter 7: Soil acidity and liming in tropical fruit orchards. In: Issaka RN, editor. Soil fertility. New Delhi: IntechOpen; p. 173–192.
- Neira J, Ortiz M, Morales L, Acevedo E. 2015. Oxygen diffusion in soils: understanding the factors and processes needed for modeling. Chil J Agric Res. 75:35–44. doi:10.4067/S0718-58392015000300005.
- Pan N, Wang S, Liu Y, Zhao W, Fu B. 2019. Global surface soil moisture dynamics in 1979–2016 observed from ESA CCI SM dataset. Water (Basel). 11:883. doi:10.3390/w11050883.
- Parkin T, Venterea RT. 2010. Chapter 3: Chamber-based trace gas flux measurements. In: RF Follett, editor. Sampling protocols. Beltsville (MD); p. 1–39.
- Petraglia A, Cacciatori C, Chelli S, Fenu G, Calderisi G, Gargano D, Abeli T, Orsenigo S, Carbognani M. 2019. Litter decomposition: effects of temperature driven by soil moisture and vegetation type. Plant Soil. 435:187–200. doi:10.1007/s11104-018-3889-x.
- Querner E, Froebrich J, De Clercq W, Jovanovic N. 2016. Effect of water use by smallholder farms in the Letaba basin: a case study using the SIMGRO model. Wagenigen: Alterra Wageningen-UR.
- Shi W-Y, Yan M-J, Zhang J-G, Guan J-H, Du S. 2014. Soil CO2 emissions from five different types of land use on the semiarid Loess Plateau of China, with emphasis on the contribution of winter soil respiration. Atmos Environ. 88:74–82. doi:10.1016/j.atmosenv.2014.01.066.
- Smith P, Bustamante M, Ahammad H, Clark H, Dong H, Elsiddig EA, Haberl H, Harper R, House J, Jafari M. 2014. Agriculture, forestry and other land use (AFOLU). In: Edenhofer O, Pichs-Madruga R, Sokona Y, Farahani E, Kadner S, Seyboth K, Adler A, Baum I, Brunner S, Eickemeier P, et al., editors. Climate change 2014: mitigation of climate change. Contribution of working group III to the fifth assessment report of the intergovernmental panel on climate change. Cambridge: Cambridge University Press; p. 811–922.
- Soni M, Yadava N, Bhardwaj S. 2016. Dynamics of leaf litter decomposition of four tree species of arid western Rajasthan under varying soil moisture regimes.
- Thomas AD, Dougill AJ, Elliott DR, Mairs H. 2014. Seasonal differences in soil CO2 efflux and carbon storage in Ntwetwe Pan, Makgadikgadi Basin, Botswana. Geoderma. 219–220:72–81. doi:10.1016/j.geoderma.2013.12.028.
- Tolimir M, Kresović B, Životić L, Dragović S, Dragović R, Sredojević Z, Gajić B. 2020. The conversion of forestland into agricultural land without appropriate measures to conserve SOM leads to the degradation of physical and rheological soil properties. Sci Rep. 10:13668. doi:10.1038/s41598-020-70464-6.
- Toru T, Kibret K. 2019. Carbon stock under major land use/land cover types of Hades sub-watershed, eastern Ethiopia. Carbon Balance Manage. 14:7. doi:10.1186/s13021-019-0122-z.
- Tsai C-P, Huang C-M, Yuan C-S, Yang L. 2020. Seasonal and diurnal variations of greenhouse gas emissions from a saline mangrove constructed wetland by using an in situ continuous GHG monitoring system. Environ Sci Pollut Res. 27:15824–15834.
- Wang L, Zhou Y, Chen Y, Xu Z, Zhang J, Liu Y, Joly F-X. 2022. Litter diversity accelerates labile carbon but slows recalcitrant carbon decomposition. Soil Biol Biochem. 168:108632. doi:10.1016/j.soilbio.2022.108632.
- Wang Z, Ji L, Hou X, Schellenberg MP. 2016. Soil respiration in semiarid temperate grasslands under various land management. PLoS One. 11:e0147987.
- Wu J. 2020. Temporal variations in soil CO2 efflux in an alpine meadow site on the Qinghai–Tibetan Plateau. Grassl Sci. 66:3–15. doi:10.1111/grs.12251.
- Yoro KO, Daramola MO. 2020. CO2 emission sources, greenhouse gases, and the global warming effect. In: Rahimpour MR, Farsi M, Makarem MA, editors. Advances in carbon capture: methods, techonologies and applications. Duxford: Woodhead Publishing; p. 3–28.
- Zhang Y, Zou J, Meng D, Dang S, Zhou J, Osborne B, Ren Y, Liang T, Yu K. 2020. Effect of soil microorganisms and labile C availability on soil respiration in response to litter inputs in forest ecosystems: a meta-analysis. Ecol Evol. 10:13602–13612. doi:10.1002/ece3.6965.


