
 ?Mathematical formulae have been encoded as MathML and are displayed in this HTML version using MathJax in order to improve their display. Uncheck the box to turn MathJax off. This feature requires Javascript. Click on a formula to zoom.
ABSTRACT
The performance of the refractory lining in glass melters used for nuclear waste vitrification is critical to the melter reliability for long-term continuous operation. Monofrax® K-3, a high Cr2O3 fused cast refractory material, has been widely used to build the liners of nuclear waste glass melters in the United States. Corrosion behaviour of Monofrax® K-3 refractory has been evaluated based on crucible-scale testing, inspection of the refractory components following scaled melter testing, and inspections of the Defense Waste Processing Facility (DWPF) melter refractory after service. The literature generally consists of empirical models based on short-term testing to describe refractory corrosion dependence on glass composition. Corrosion data from tests with longer testing times, at various temperatures, in the presence of molten salts, and with different redox reactions in the plenum atmosphere exist, may be insufficient to provide accurate refractory service life estimates. Additionally, the corrosion data collected under actual and scaled melter operating conditions are limited. Recommendations to achieve more direct correlation between the laboratory refractory corrosion data predictions and the observed melter service life are discussed to allow for more accurate predictions of the useful life of melter refractory linings.
Acronyms
| CLSM | = | continuous laboratory-scale melter |
| DFLAW | = | direct feed low activity waste |
| DM | = | DuramelterTM |
| DOE | = | U.S. Department of Energy |
| DWPF | = | Defense Waste Processing Facility |
| HLW | = | high-level waste |
| IDMS | = | Integrated DWPF Melter System |
| INL | = | Idaho National Laboratory |
| JHCM | = | joule-heated ceramic melters |
| LAW | = | low-activity waste |
| LFCM | = | Liquid Fed Ceramic Melter |
| LLW | = | low-level waste |
| LSFM | = | Large Slurry Fed Melter |
| ORP | = | Office of River Protection |
| PNNL | = | Pacific Northwest National Laboratory |
| RSM | = | research-scale melter |
| SCM | = | Small Cylindrical Melter |
| SGM | = | Scale Glass Melter |
| SRNL | = | Savannah River National Laboratory |
| SRS | = | Savannah River Site |
| VITPP | = | Vitrification Pilot Plant |
| VSL | = | Vitreous State Laboratory at The Catholic University of America |
| WTP | = | Waste Treatment and Immobilization Plant |
| WVDP | = | West Valley Demonstration Project |
Introduction
The United States (U.S.) Department of Energy (DOE) is responsible for managing high-level waste (HLW) generated since the 1940s from nuclear materials processing. The HLW originated as liquid process effluent and is stored in underground steel tanks to await final treatment and disposition. The majority of the HLW is primarily at four sites: the West Valley Demonstration Project (WVDP) near West Valley, New York; the Idaho National Laboratory (INL) near Idaho Falls, Idaho; the Savannah River Site (SRS) near Aiken, South Carolina; and the Hanford Site near Hanford, Washington [Citation1]. Approximately 4 × 10⁵ m3 (96 million gallons) of HLW has been generated and stored as Tank Waste; however, only a small fraction of the volume of Tank Waste under DOE control has been treated to date [Citation1–3]. DOE has ongoing missions to retrieve, treat, and dispose of these wastes in a safe and efficient manner [Citation4,Citation5].
The DOE processed HLW at the WVDP Site between 1996 and 2001, converting the Tank Waste into borosilicate glass that is canistered in stainless steel and currently stored at the site [Citation6–9]. At the INL Site, the majority of tank waste has been converted (calcined) to a solid material that is stored in stainless steel bins to await final treatment and disposition, while the remaining portion of the liquid HLW at INL is to be converted (steam-reformed) to a solid material that will be packaged in stainless steel canisters and stored in concrete vaults at the site [Citation10]. The tank waste at both the Hanford Site and SRS represents the majority of the HLW remaining across the DOE sites that requires treatment and disposition [Citation11–17]. After decades of storage and conditioning, the tank waste is generally in the form of mixtures of solid (sludge) and liquid (salt solution); in many tanks, the oversaturated solution formed a salt cake layer [Citation18–20].
Treatment of tank waste involves two primary processes: pretreatment and immobilization [Citation21]. Pretreatment involves certain unit operations to separate the low-activity waste (LAW) fraction from the HLW components and to prepare the liquid waste for feeding to immobilization processes. Immobilization is the process that converts the liquid waste into a stable solid form. The purpose of separating LAW and HLW is to reduce the volume of HLW. Immobilized HLW will be shipped to a geologic repository for disposal, while immobilized LAW is suitable for on-site disposal [Citation15,Citation21]. It is important to note that LAW should not be confused with low-level waste (LLW) as defined by the International Atomic Energy Agency [Citation22]; LAW is the waste that remains following the process of separating as much radioactivity as is practicable from HLW [Citation15].
Vitrification is the established technology to immobilize HLW into a glass waste form that possesses the requisite chemical durability and radiation stability for long-term storage and disposal [Citation23–28]. Vitrification was selected for HLW treatment at WVDP, SRS, and the Hanford Site, [Citation1,Citation2,Citation4,Citation5]. At INL, vitrification is being considered to immobilize the Tank Waste that was calcined and currently stored in bins below ground at the INL Site [Citation29,Citation30]. Aside from these HLW vitrification projects, two other treatment projects in the U.S. have applied vitrification process to immobilize mixed low-level waste and geological mill tailings [Citation4,Citation5,Citation31–36].
lists the major nuclear waste vitrification projects in the US. A general joule-heated ceramic melter (JHCM) design with continuous feeding and glass discharging layout () has been adopted for the large-scale vitrification facilities given the high production capacity and stable processing capability [Citation37–45]. These JHCMs are lined with ceramic refractory brick to contain the glass melt. The glass melt is heated by an electric current between electrodes submerged in the glass pool. Melter feed, which is a mixture of waste and additives in slurry form, is charged into the melter and partially covers the melting surface forming a ‘cold cap’ as ambient temperature feed is introduced on top of the molten glass. A vertical temperature gradient exists that extends from the glass pool up through the cold cap region. Convection can be also forced through the glass pool through differential control of the upper and lower electrodes. The cold cap region controls the feed-to-glass conversion reactions and is critical to managing volatile species during glass production [Citation46–53]. Glass is drawn from near the bottom of the melter and discharged be an overflow weir. Bubbling systems can be another important feature used to increase the glass production rate [Citation54]. Bubbler systems are planned for the WTP and have been in place in the DWPF for over a decade [Citation16, Citation55–57]. The design and operations of these glass melters influence attainment and life of the melter.
Figure 1. Cross-sectional view of Defense Waste Processing Facility (DWPF) melter representing a typical JHCM design. Reprinted with permission from Ref. [Citation40].
![Figure 1. Cross-sectional view of Defense Waste Processing Facility (DWPF) melter representing a typical JHCM design. Reprinted with permission from Ref. [Citation40].](/cms/asset/42dd4bd8-3b16-49cf-aa78-b81892f0981a/yimr_a_2211469_f0001_ob.jpg)
Table 1. Major U.S. nuclear waste treatment projects using JHCM for vitrification. Monofrax® K-3 is used as the refractory lining of all the JHCMs in the table.
Melter life is of significant prominence among the many factors that influence waste vitrification facilities operational efficiency. The long duration (decades) of typical operations requires these JHCMs to possess a commensurate operational lifetime to reach attainment for the duration of the mission. Corrosion of the JHCM refractory lining in contact with the glass melt is a critical factor in estimating melter operating life [Citation58]. Monofrax® K-3Footnote1 refractory (), a fusion-cast refractory consisting primarily of chromium spinel and chrome-alumina corundum, has been selected to line all the JHCMs that have been, are, or will be used to treat nuclear waste in the U.S [Citation58–65]. The operational experience, although limited, demonstrated that the refractory lining lifetime in the JHCMs can exceed ten years [Citation66,Citation67]. However, laboratory corrosion data collected for Monofrax® K-3 refractory, including crucible and scaled melter tests, vary widely; high corrosion damage (measured as corrosion depth at the melt line) observed in a few scaled melter tests has been used to suggest a much shorter service life; (defined as the service time when half of the brick gets corroded) on the order of 2–6 years (two years of lifetime was considered as a conservative limit for melter design) [Citation67]. Taken together, operational experience indicates a deficiency exists in the methods used to estimate refractory lifetime from laboratory corrosion test methods. The ability to accurately predict refractory life in a JHCM using a scaled test is needed to accelerate the development and design of more efficient JHCMs. In this article, the literature on corrosion of Monofrax® K-3 refractory is reviewed as it relates to JHCMs used for nuclear waste vitrification in the United States. Technical challenges relating corrosion behaviour, especially at the melt line, to refractory service life and recommendations for future work are presented.
Table 2. Compositions of Monofrax® K-3 [Citation64–66].
Background: refractory loss mechanisms
Refractory lifetime in a glass melter is determined by the aggregate effects of all the mechanisms acting on the refractory during operation that contribute to material loss. Refractory loss typically occurs by mechanisms including dissolution, physical cracking, spallation/grain pullout, and upward drilling, all of which can be enhanced by thermal cycling and temperature gradients [Citation58, Citation68–72]. schematically presents these important mechanisms. The design and construction of the refractory package must address the combination of these factors expected to be present when operating a glass melter. Many of the loss mechanisms exhibit significant random variability and are impractical to directly quantify. Instead, gross corrosion tests are the single most widely accepted method for measuring refractory loss. Models based on crucible corrosion tests are used to evaluate the refractory loss, but a direct correlation between crucible-scale corrosion tests and corrosion occurring in the melter has not been established [Citation72]. Quantifiable correlations are likely ambiguous owing to different conditions at the melt line in the melter compared to that in the typical crucible corrosion test. For this reason, standard crucible corrosion test results cannot be used to directly extrapolate corrosion rates in melters or to quantitatively estimate melter refractory lifetime.
Figure 2. Representation of typical wear in refractories described in the literature [Citation58, Citation71].
![Figure 2. Representation of typical wear in refractories described in the literature [Citation58, Citation71].](/cms/asset/595d7136-700d-48cb-b86a-80f32b762ac5/yimr_a_2211469_f0002_oc.jpg)
Corrosion at the melt line is known to be driven by surface tension gradients, which is the primary mechanism simulated by the crucible-scale tests and is observed as ‘neck corrosion’ [Citation73]. Dissolution at the melt line is sensitive to conditions in the molten glass, including convection (forced or otherwise), causing dynamic thermal and chemical driving forces as the refractory is continually exposed to fresh molten glass, which may accelerate the refractory dissolution rate [Citation74]. Vapour phase interactions with the refractory above the melt line are also known to contribute to refractory loss [Citation75].
Fused cast refractory is particularly susceptible to material loss by spallation of bulk pieces, which generally fall into the melter [Citation76]. Spalling implies the loss of fragments from a refractory shape caused by stress produced inside a refractory body [Citation68,Citation72]. Upward drilling occurs where a downward-facing refractory surface is in contact with gas bubbles trapped against it and takes place where open pores or cracks form in the refractory lining surface [Citation68,Citation77–79]. These structure anomalies include material defects introduced during the manufacturing process (casting the refractory bricks and lining the melter) such as pores, inclusions, and cracks, and the stress from thermal gradients (thermal shock) during melter operation [Citation80,Citation81]. Most catastrophic thermal shock effects occur during initial melter heat up and can be managed by proper control of temperature during the initial heat up. Cracks and fracturing arising from thermal shock are usually not a significant concern unless large pieces are displaced or the cracks between fractured pieces increase surface area or expose refractory to glass penetration [Citation72]. When physical changes to the refractory become excessive, rising gas bubbles can be trapped on the underside of structural anomalies where they slowly continue to drill through the refractory over time [Citation71]. This effect leads to enhanced refractory damage as corrosion and thermal shock continue to act on compromised areas.
Molten glass will also penetrate seams between refractory brick and enter existing cracks or those developed during operation. Depending on the geometry of the crack and the glass composition, such cracks can be sites for increased corrosion, but the glass can also serve to infiltrate and seal the refractory lining by the combination of the glass liquidus temperature, TL, in the crack and the thermal gradients extending away from the melt. The penetration depth is limited by the tortuous path of the crack, the thermal gradient across the brick (resulting in increased viscosity as the temperature is reduced), and the increased viscosity from dissolution of chromium and aluminium oxides into the glass as it flows into the cracks and seams [Citation69,Citation82]. Melter refractory lifetime can be reduced by corrosion if fresh glass continually penetrates and washes out between the cracks and seams, dissolving refractory material into the molten glass in the process.
Some waste streams have high concentrations of salts, which promote the segregation of a molten salt phase during melting [Citation83]. Refractory interaction with the molten salts must also be considered when considering refractory loss mechanisms [Citation58,Citation84]. In waste glass melters, the refractory package is often mechanically constrained to keep refractory blocks compressed and seams tight. Excess molten salts (low viscosity phase) can penetrate seams and cracks (more easily compared to the molten glass) in the refractory and cause electrical disturbances in a joule-heated melter and, in extreme cases, an inability to heat the glass [Citation85]. For example, sulphate salts, if present in large quantities, can eventually lead to excess migration throughout the refractory package [Citation86]. For these reasons, melter feed processing and glass formulations are designed to limit the formation of a segregated molten salt phase (also known as a sulphate gall containing mostly sodium sulphate with small amounts of chloride and chromate) [Citation83,Citation87–90]. However, salts are ubiquitous in nuclear waste glass processing, including the nitrate/nitrite salts (the major components of the LAW) which decompose quickly and the sulphate which is low in concentration but tends to form a gall layer; therefore, their effect cannot wholly be mitigated [Citation91,Citation92].
Corrosion data from Monofrax® K-3 literature survey
During the selection process of refractory materials for the vitrification JHCMs [Citation60,Citation62,Citation63], several candidate refractory materials were tested and evaluated for corrosion resistance, electrical resistivity, thermal shock resistance, thermal expansion and conductivity, ease of fabrication, and the cost and availability of the materials. Based on these results, Monofrax® K-3 was selected as the refractory lining material for waste vitrification melters [Citation60].
Bingham et al. [Citation58] reviewed relevant literature to familiarize the reader with the background into corrosion behaviours and degradation mechanisms of glass-contact refractory materials used in nuclear waste vitrification applications. Much of the relevant literature is from tests performed at, or under the auspices, of the US national laboratories. In this section, a review of applicable crucible tests, scaled melter tests, and production melter inspections are presented. Most corrosion data of Monofrax® K-3 were collected using the crucible test method by various investigators. Each crucible-scale test showed experimental variation in test conditions, including the crucible size, glass melt volume, refractory coupon size, glass chemistry, testing temperature, and test duration. Not all test conditions were fully recorded in all the literature reviewed, making direct comparison of corrosion data difficult. Nevertheless, these experiments have demonstrated the effects of melt temperature, test duration, and glass chemistry on refractory corrosion. These test results are summarized in the following discussion, along with the limited data provided for the small-scale and production melter studies of the corrosion of refractory lining. The nature of the scaled and production melter evaluations precludes a similar level of detailed assessment of critical variables related to refractory degradation and are categorically summarized.
Crucible tests
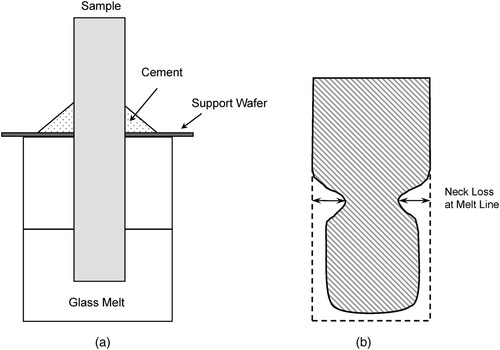
Crucible tests refer to those performed in accordance with ASTM C621, Standard Test Method for Isothermal Corrosion Resistance of Refractories to Molten Glass [Citation93]. shows a typical schematic of the crucible test. In a typical test, refractory samples (coupons) are suspended in molten glass, in an inert crucible (e.g. Pt) for a given period of time (generally days), after which the coupons are removed and examined for chemical and physical changes. The most intensive corrosion/material loss is observed at the melt line resulting in a ‘neck’ in the coupons. The half-down corrosion depth and the altered zone thickness generally exhibit much less material loss than at the neck region. Corrosion rates are commonly estimated by dividing the material loss at the melt line by the duration of the crucible test and are reported in units such as μm/day or cm/year.
Figure 3. Schematic representation of general crucible test method. (a) crucible setup (b) cross-section of the altered refractory test coupon after material loss. The measured ‘neck loss’ is calculated by , where Gc is the neck corrosion, G is the width of the coupon before test, and g is the width of the coupon at the melt line after test.
In practice, many variables will affect the ASTM C621 method results. Experimental conditions, such as time, temperature, redox of atmosphere, and forced convection, as well as glass compositions impact the measured corrosion rate. Moreover, corrosion in real systems (e.g. operational melters) is dynamic, resulting from the influence of those combined parameter effects. As such, a variety of crucible studies have been performed that deviate from the ASTM C621 to simulate prototypic melter conditions and control individual parameters applicable to nuclear waste glass processing. The influence of these parameters on the corrosion of refractory using crucible tests with nuclear waste glass simulants is summarized below.
Effect of temperature, test time, and redox
Early work on the DWPF melters explored the effect of a limited number of parameters, such as temperature, but even these were generally qualitative in nature. It wasn’t until later years that parameters including time and redox were experimentally investigated to better understand refractory loss. Crucible tests with glasses typical for DWPF HLW glass are summarized in . General conclusions from those tests indicate the Monofrax® K-3 corrosion rate measured at the melt line increases with increased temperature in the range of 1100–1300°C [Citation60]. However, the temperature effect was not quantitatively assessed. Carborundum (a division of Saint-Gobain Company) performed tests for Savannah River National Laboratory (SRNL) in the 1980s that looked at the effect of temperature on the corrosion rate over a range from 1150 to 1400°C. The conclusion was that the corrosion rate doubled for every 50°C increase in temperature [Citation94].
Table 3. Monofrax® K-3 Corrosion data from crucible tests with glass formulations typical for DWPF HLW following the ASTM-C621 methods.
Lu et al. [Citation95] tested Monofrax® K-3 coupons in two alumino-borosilicate glasses with ∼ 17 wt-% of Na2O, ∼ 2.5 wt-% of Li2O, and ∼ 2 wt-% K2O at 1208°C for 1, 2, 3, and 6 days. The results showed that the chromium oxide and aluminium oxide dissolved in the glass melt leading to an increase in viscosity, which resulted in a decreasing dissolving rate of the coupon over time. Williams et al. [Citation96] reported an average corrosion rate that decreased inversely with test time from 4 to 120 h. This was attributed to the formation of a passivating spinel layer between the glass melt and the refractory and the saturation of cations, such as Al and Cr at the reaction layer between the refractory and the glass melt [Citation72,Citation76].
The refractory corrosion rate depends upon the oxygen fugacity of the melt, or redox conditions [Citation97]. This dependence is expected given the redox active species present in the refractory, such as Cr and Fe. In practice, formic acid (reducing) and nitric acid (oxidizing) were used as additives to control the redox of DWPF glasses [Citation98]. However, the effects of oxidizing or reducing additives were not performed during materials of construction testing for DWPF. Pilot-scale melter tests were principally performed under reducing conditions, which were assumed to be representative of normal DWPF operations. During the first two years of non-radioactive DWPF operations, the acid additions to the feed would have favoured oxidizing conditions due to a single acid tank and a focus on startup (not redox). The attack of the refractory was noticeably more rapid than observed in the previous pilot-scale melter tests. This result suggested that oxidizing conditions were potentially more aggressive than reducing conditions.
Due to this observation, untreated refractory corrosion coupons made from Monofrax® K-3 were tested with a DWPF feed under oxidizing conditions in a crucible and a pilot-scale melter [Citation96,Citation99,Citation100]. The corrosion rates were approximately 1.8–2.8 times greater in oxidizing conditions than those measured previously under reducing conditions. They were also greater than those measured in the pilot-scale melters. The corrosion mechanism was shown to be dominated by depletion of Al2O3 from the Monofrax® K-3 allowing reaction with Na2O, NiO, and Fe2O3 from the glass, which is accelerated by the oxidative dissolution of reduced metals present in the Monofrax® K-3.
Effect of segregated molten salt phase
The presence of high concentrations of salts during waste processing is known to lead to a molten salt, or ‘gall’ layer, that segregates from the molten glass phase [Citation101]. For Hanford LAW glasses, the salt layer segregated in the melter primarily consists of sodium sulphate [Citation83,Citation87–90,Citation102,Citation103], formed through excess sulphate salts present in the feed. Small proportions of chloride and chromate salts are also present in the salt layer [Citation104]. summarizes corrosion test results for glasses formulated with excess salt or those that exhibit distinct salt phases in/on the glass melt.
Table 4. Monofrax® K-3 Corrosion data from crucible tests with a molten salt phase.
Marra et al. [Citation85] tested Monofrax® K-3 corrosion in glass with added sulphate, chloride, chromate, and phosphate, but the formation of a salt layer was not clearly described. The data show sulphate and chloride were correlated to greater corrosion depth. When chromate and phosphate were added to sulphate and chloride, the corrosion rate decreased [Citation85]. Gan et al. [Citation86] performed Monofrax® K-3 tests in simulated LAW glass with excess sulphate added. The loss of material was not significant in those cases; however, a detailed examination showed the formation of a very loose, sponge-like layer on the surface of the refractory sample. Gan et al. [Citation86] also tested Monofrax® K-3 coupons in a series of mixed sodium and lithium sulphate (without glass in the crucible). The Monofrax® K-3 coupons showed very little dissolution after the test (no neck loss data was available) but cracking in the material was observed. The different reported corrosion behaviours of Monofrax® K-3 coupons in molten salt suggest that neck loss measurement may not be a representative way to characterize corrosion damage in glass melts with high salt concentrations, other methods, such as microscopic analysis of the penetration layer, should perhaps be employed.
Effect of glass melt composition
Leading up to the startup of WVDP and DWPF, limited experiments existed to quantify the effects of large changes in glass composition on the refractory corrosion rates. Historically, the DWPF and WVDP were designed to produce glass with a relatively narrow, consistent composition range. However, to process future wastes at SRS and Hanford with maximum waste loadings (the fraction of glass originating from waste), the corrosion behaviour is needed for glass composition envelopes outside those nominally processed through the DWPF. Recently, Monofrax® K-3 corrosion tests were conducted on more than 300 glass compositions projected to be processed through the WTP [Citation86,Citation87,Citation105–126]. Those tests were specifically intended to provide information to develop a model to predict the effects of glass components on the Monofrax® K-3 corrosion rate within a glass composition envelope representative of Hanford LAW formulations. Those tests were performed using a modified ASTM C621 method where each test was carried out at 1208°C for six days and air was bubbled through the glass melt at a rate of 8 cc/min for the duration of the test. The full dataset of 344 glasses is not given in this paper but can be found in Muller et al. [Citation126]. The results are compiled and summarized in . There are two major groups of LAW glasses (1) WTP baseline which were tested to support plant commissioning with reasonably modest waste loadings, and (2) ORP (DOE’s Office of River Protection) which were tested to help optimize operation of the plant over the mission lifetime. The computed Monofrax® K-3 corrosion rates from this data set span more than two orders of magnitude across the composition matrix and a cursory review of the data in suggests a correlation between the alkali content and higher observed corrosion rates. Several models have been developed based on this dataset to predict the effects of glass components on Monofrax® K-3 corrosion [Citation126–128]. The models generally include a strong effect of Na2O on promoting Monofrax® K-3 corrosion (i.e. positive coefficient for neck loss) and a strong effect of SiO2 on repressing Monofrax® K-3 corrosion (i.e. negative coefficient for neck loss) [Citation128]. The compositional models will be further discussed in the Models for Crucible Test Data section.
Figure 4. Monofrax® K-3 corrosion rate and normalized alkali oxide in mass % of the LAW glasses in the datasets of WTP baseline and ORP [Citation126].
![Figure 4. Monofrax® K-3 corrosion rate and normalized alkali oxide in mass % of the LAW glasses in the datasets of WTP baseline and ORP [Citation126].](/cms/asset/43ce5eb9-13c1-41c2-8206-94d6370c5f63/yimr_a_2211469_f0004_oc.jpg)
Table 5. Summary of Monofrax® K-3 corrosion data by a modified ASTM C621 method tested at 1208°C for 6 days with air bubbling in the glass melt. The average corrosion rate was converted from the reported 6-day corrosion depth at the neck/melt line in inch [Citation126].
Scaled melter tests
From the 1970s to the 1990s, scaled melters built at Pacific Northwest Laboratory (now Pacific Northwest National Laboratory, PNNL) and Savannah River Laboratory (now Savannah River National Laboratory, SRNL) processed simulated DWPF HLW glasses to support DWPF design [Citation37,Citation61,Citation66,Citation67,Citation94,Citation129–131]. Starting from the 1990s, Vitreous State Laboratory (VSL) at The Catholic University of America, cooperating with Duratek Inc. (now Atkins), and PNNL built scaled metres to support the optimized operation of the WTP [Citation44, Citation132–139]. Most of the VSL/Duratek and PNNL melter tests were on simulant WTP LAW glasses which might cause higher corrosion of the refractory due to the higher alkali-containing glass compositions compared with the DWPF HLW glass compositions [Citation44,Citation126]; and some tests of simulant WTP HLW glasses were also conducted to investigate the crystal formation and accumulation in melters [Citation137,Citation138]. These scaled melters processed simulated nuclear waste feeds for extended periods (i.e. typically years) under prototypical processing conditions. After operation, visual inspections of the glass contact refractory were made for the melters to assess vulnerable areas for attack. Corrosion data obtained from these pilot-scale operations are summarized in . shows photos of Monofrax® K-3 refractory from disassembled melters.
Figure 5. Monofrax® K-3 refractory from disassembled scaled melters. (a) PNL-LFCM. Cross-section of the glass discharge showing glass penetration into the refractory brick joints and cracks [Citation61]. (b) DM3300. View of the inside of the melter after the melter lid was removed. Picture shows the plenum refractory, tuckstone (yellow brick on ledge) and the K-3 refractory (black brick). The bubblers and temporary riser can also be seen [Citation135]. (c) DM3300. K-3 glass contact refractory that was broken during the removal process. Picture shows approximately 10 cm (4 inches, the measuring tape is in inch) of loss at the melt line [Citation135]. Reprinted with permission from refs [Citation61] and [Citation135].
![Figure 5. Monofrax® K-3 refractory from disassembled scaled melters. (a) PNL-LFCM. Cross-section of the glass discharge showing glass penetration into the refractory brick joints and cracks [Citation61]. (b) DM3300. View of the inside of the melter after the melter lid was removed. Picture shows the plenum refractory, tuckstone (yellow brick on ledge) and the K-3 refractory (black brick). The bubblers and temporary riser can also be seen [Citation135]. (c) DM3300. K-3 glass contact refractory that was broken during the removal process. Picture shows approximately 10 cm (4 inches, the measuring tape is in inch) of loss at the melt line [Citation135]. Reprinted with permission from refs [Citation61] and [Citation135].](/cms/asset/793e3fac-1788-400e-852c-19221db2ec24/yimr_a_2211469_f0005_oc.jpg)
Table 6. Refractory corrosion data from scaled melter Tests.
The Pacific Northwest Laboratory – Liquid Fed Ceramic Melter (PNL-LFCM) project operated 1977–1980 was developed to demonstrate the feasibility of producing borosilicate glasses within a joule-heated ceramic melter [Citation61]. Corrosion of the refractory bricks was carefully examined for PNL-LFCM after three years of operation [Citation61]. It was concluded that the observed corrosion was < 0.85 cm/year. Glass-filled cracks were found in the refractory ((a)); however, the examination did not show that the cracks enhanced the corrosion depth. Analysis indicated that the cracking of the refractory was caused by thermal stress which can probably be prevented by allowing sufficient space for refractory thermal expansion in melter design, reducing the thermal gradients in the refractory by increasing refractory wall thickness, and reducing the severity of thermal transients such as using a slower heating rate during the startup. It is worth noting that extensive cracking of the Monofrax® K-3 refractory caused by stress or thermal shock was not observed for the scaled melters tested later.
Figure 6. Average corrosion rate (neck or melt line corrosion depth per day) as a function of time in SRNL’s crucible tests [Citation60, Citation62, Citation96, Citation99, Citation100] and scaled melter tests [Citation61, Citation66, Citation129, Citation131]. Results of crucible tests with different glass at 1100–1200°C and scaled melter tests are shown, with the rates averaged over time.
![Figure 6. Average corrosion rate (neck or melt line corrosion depth per day) as a function of time in SRNL’s crucible tests [Citation60, Citation62, Citation96, Citation99, Citation100] and scaled melter tests [Citation61, Citation66, Citation129, Citation131]. Results of crucible tests with different glass at 1100–1200°C and scaled melter tests are shown, with the rates averaged over time.](/cms/asset/77a4bbb5-8e50-4264-ac25-09a130c26618/yimr_a_2211469_f0006_oc.jpg)
Five scaled melters were operated at SRS in support of the design of DWPF between 1978 and 1995 [Citation66,Citation67]. Typically, the scale of these SRS test melters was based on the melt pool surface area and therefore the melting rate achieved is based on this area in the DWPF melter design basis. The majority of those SRS scaled melters were operated with a reducing flowsheet, similar to DWPF, but some were operated with calcine (Project 1941 and Small Cylindrical Melter (SCM)) or oxidizing Integrated DWPF Meter System (IDMS) flow sheets. Corrosion rates were quantified in three of the five SRS scaled melters. In general, two areas of the refractory were attacked significantly in each case − the melt line and the riser or pour spout area (). The pour spout area typically had the highest rate of attack (70–330 µm/day) as measured by the 1941 project and the SCM [Citation94,Citation130]. For the 1941 melter, the corrosion rates were higher in this area because the pour spout wall was in the direct path of any electric current passing from pool electrodes to the riser heater. The pour spout region for the SCM, on the other hand, appeared to erode due to high molten glass velocities. Corrosion was so severe in this region that a hole formed in the 10 cm thick refractory after approximately nine months of operation. After observing the high Monofrax® K-3 corrosion damage at those areas from the scaled melter tests, Inconel 690, a Cr–Ni–Fe alloy with very high corrosion resistance to glass melts was used to make an insert of the pour spout for DWPF melters [Citation63,Citation140].
Corrosion rates at the melt line were measured for the Large Slurry Fed Melter (LSFM) and the SCM and ranged between 25 and 191 µm/day. Refractory degradation in the LSFM occurred in the blocks located closest to the slurry feed tube. The degradation was characterized by spalling that likely occurred due to thermal shock fracturing where the slurry feed water contacted the hot refractory. Since this mechanism is not operable in the DWPF (much larger size), this rate was not considered for the design basis. For the SCM, the majority of the attack occurred 5–8 cm below the melt line at a rate of 191 µm/day (0.0075 inch/day). This corrosion rate was assumed for the DWPF design basis [Citation141]. The average sidewall corrosion rate, including the melt line, for the SCM was approximately 140 µm/day (0.0055 inch/day), which is slightly lower [Citation66].
However, the corrosion rates from the SCM do not distinguish between an ‘average loss of material’ and a ‘selective penetration’ depth, but rather consider the sum of these two (total penetration) measurements as the overall corrosion rate. Therefore, the total penetration rate is significantly influenced by high flow rate conditions and therefore may be conservative. Corrosion rates in more quiescent environments, such as coupon tests, are expected to be lower. Results of crucible tests on similar glasses are also shown in , where the average crucible test corrosion rates were found to trend lower than the refractory corrosion data from scaled melters as the crucible test time increased [Citation96,Citation99,Citation100]. This is likely due to (1) the flow of glass melt being more vigorous in scaled melter tests, (2) spalling at the melter melt line that cannot be completely simulated in crucible studies, and (3) buildup of corrosion-inhibiting components (Cr, Al, Fe, Mg) in the crucible tests.
Following the successful operation of DWPF, JHCM designs for the WTP aimed to increase many melter performance metrics, including waste processing rate and waste loading [Citation142,Citation143]. Facing the challenges of chemical complexity and oxidizing conditions of the highly variable Hanford wastes, scaled melters were designed to collect processing data and establish melter performance against simulated wastes. From the 1990s to the 2000s, VSL and Duratek built the DuramelterTM-10 (DM10), -100 (DM100), -1200 (DM1200), and -3300 (DM3300) scaled melters, using Monofrax® K-3 as the glass contact refractory [Citation44]. For DM1200 and DM3300, the corrosion of refractory lining material was inspected and reported () [Citation36].
DM1200 HLW has a glass pool surface area of 1.2 m2 [Citation133]. It was inspected in 2006 [Citation36,Citation133] and the visible part of the Monofrax® K-3 lining was in good condition. The DM3300, known as the LAW Pilot Melter, had a glass pool surface area of 3.3 m2 [Citation134]. The melter was commissioned in 1998 and shut down in 2003 [Citation135]. Following shutdown, the melter lining was disassembled and the inspection showed that spalling on the Monofrax® K-3 refractory occurred above the melt line with a material loss of approximately 10–13 cm (4–5 inch) as shown in (b) and (c) [Citation36,Citation135]. Glass was found to have penetrated cracks and seams into the outer layers of the refractory; however, the extent was limited, and no glass was found to have completely penetrated the refractory package [Citation135]. The melter floor, also Monofrax® K-3, displayed 2.5 cm (1 inch) of material loss, significantly less than the walls. Bubbling was not found to significantly increase material loss even in the case where one bubbler was purposely placed near the wall. It should be noted that DM3300 is the largest-scaled melter built for vitrification research to date. The DM3300 design was based on the SRS M-area DM5000 series of melters commissioned between 1996 and 1997 and used in production through 1999 [Citation36]. During the operational life of DM3300, 4000 m3 of simulated feed was processed and over 3,500 tons of glass was produced, which is comparable to the full-scale production melters such as the DWPF/WTP melters. The DM3300 refractory corrosion results are important data in reference to the long-term operation of large melters.
At PNNL, several scaled melter systems have been running vitrification tests, including the laboratory-scale melter, the continuous laboratory-scale melter (CLSM), and the research-scale melter (RSM) [Citation136–138,Citation144,Citation145]. The Monofrax® K-3 lining of RSM was inspected after an 11-week run of a high Fe-Ni simulant HLW glass (17.81 wt-% Na2O, 7.63 wt-% B2O3, 38.47 wt-% SiO2, 7.84 wt-% Al2O3 and 17.5 wt-% Fe2O3) [Citation138]. Optical and scanning electron microscopy were used to characterize the cross-section sample cut from the melter lining [Citation139], providing information on morphology and elemental distribution at the refractory surface in contact with the glass melt. No clear neck corrosion was identified, and the loss of material is minor, which should be attributed to the low corrosivity of the high-Fe and low-Na glass and the relatively short test duration. The observed reaction layer was less than 0.5 mm.
Refractory corrosion in production melters
Inspection of full-scale melters after the completed mission provides valuable information to evaluate the material performance against recommendations resulting from corrosion models. In situ inspection and quantification of refractory performance are difficult due to radiation and contamination levels of a melter in service for many years [Citation146]. Visual inspection of the refractory is more often the primary means of evaluation of off-line melters after the end of service [Citation147].
The WVDP melter was inspected in 2014 (12 years after its completion of vitrification and shut down in 2002) to characterize the isotopic distribution and remaining radioactivity [Citation148]. However, no corrosion or glass penetration depth data was collected.
The DWPF replaced two melters − one in 2002 and one in 2017 (). Each was inspected by a remote camera after shutdown [Citation149–151]. Because some glass remained in the melter, the corrosion of Monofrax® K-3 bricks below the melt line could not be seen, however, severe spalling of the Monofrax® K-3 lining was found at the melt line and near the electrodes ((a)). The corrosion was less in other places along the melt line. Overall, the Monofrax® K-3 lining was in acceptable condition at the end of the 8-year and 14-year service periods and would not have presented an immediate challenge to reliable melter operations.
Figure 7. Corrosion of the Monofrax® K-3 refractory lining of production melters. (a) DWPF Melter 2, reprinted with permission from ref [Citation151]. (b) SRS M-Area DM5000A, reprinted with permission from Ref. [Citation36].
![Figure 7. Corrosion of the Monofrax® K-3 refractory lining of production melters. (a) DWPF Melter 2, reprinted with permission from ref [Citation151]. (b) SRS M-Area DM5000A, reprinted with permission from Ref. [Citation36].](/cms/asset/2705131f-a9fe-44ac-b560-de47774736fb/yimr_a_2211469_f0007_oc.jpg)
The DuramelterTM (DM) 5000A, constructed by GTS Duratek, was operated by SRS between 1997 and 1999 to vitrify mixed low-level waste at the site’s material fabrication facility [Citation4,Citation5]. As noted in , a DM5000 melter failed during simulant operations due to incompatibility with the initial feed. After replacement of DM5000, a new DM5000A handled the radioactive waste and operated for approximately two years after which it was drained and inspected. At the melt line, spalling and corrosion resulted in a loss of material of 1–2 inches in depth and 4 inches high. ((b)). Examination of Monofrax® K-3 samples taken from the disassembled melter showed dissolution of the chromia-alumina solid solution and penetration of the glass into the refractory to a depth of about 2.5 cm (1 inch). The report estimated that an additional four to seven years of service life could have been expected for the DM5000A [Citation36].
Indeed, studies on refractory corrosion depth as a function of time for production-scale melters are limited. Melter service life typically lasts for only several years and it is often technically difficult or cost prohibitive to collect samples after the melter’s end of life. Nevertheless, a few data that exist are plotted in , for which corrosion depth has been estimated from operational melters. For comparison, also shows the DWPF melter refractory design basis. In-service melter corrosion depths are well below the corrosion limit estimated from design basis crucible tests. However, since the commissioning of DWPF, many additional crucible tests have been conducted with different glass compositions [Citation126]. At the bottom of , these crucible data conducted at 1208°C for 6 days using the bubbling method are shown. The red dashed line in the plots presents the proposed limit for the 1208°C bubbling test results (set as 0.04 inch neck corrosion depth for the coupon after the 6-day test, equals to 0.0067 inch/day or 169 μm/day); this limit, similar to the DWPF design basis based on the scaled melter corrosion data, was proposed to be used in glass formulation as a guide for acceptable refractory corrosion characteristics [Citation113,Citation126]. Taken at face value, 31% of the tested glasses exceeded the proposed limit (also see ), which would suggest that a large portion of glass compositions would need to be adjusted (likely at the expense of waste loading) to lower the glass melt corrosivity. For example, reducing of Na2O can effectively decrease the predicted refractory corrosion; however, since Na2O is a primary component from the waste stream, the adjustment leads to a lower waste loading [Citation143]. In addition, Cr2O3 as a minor component (≤ 0.6 wt%) can effectively reduce the corrosion according to the crucible data, which should be considered as an important factor in adjusting glass compositions (quantitative analysis will be discussed in the following modeling section) [Citation126–128]. However, it is noted that crucible tests are known to be used historically for qualitative comparisons, are not generally prototypic of operational melters, and data from decommissioned melters indicates that corrosion limits determined from raw crucible test data are conservative [Citation66]. Additional work is needed to understand the scaling factors between crucible tests and operational melters as well as the conditions needed to more reliably and accurately correlate refractory corrosion data to melter refractory lifespans.
Figure 8. Summary of Monofrax® K-3 refractory corrosion data from melter and crucible tests [Citation36, Citation60–62, Citation66, Citation96, Citation99, Citation100, Citation126, Citation129, Citation131, Citation149–151]. The limits of corrosion rate are shown in both of the long-term melter data plot (top, > 300 days) and the short-term crucible data plot (bottom, ≤ 7 days) for comparison. The non-SI unit inch is used in the plots as it is used in all the data source reports. The DWPF design basis of 0.0075 inch/day equals to 191 µm/day and the proposed limit of crucible test of 0.0067 inch/day equals to 169 µm/day. It should be noted that the two DWPF data points are very roughly estimated based on visual inspection of DWPF Melter 1 [Citation149, Citation150] and DWPF Melter 2 [Citation151] after end of their service.
![Figure 8. Summary of Monofrax® K-3 refractory corrosion data from melter and crucible tests [Citation36, Citation60–62, Citation66, Citation96, Citation99, Citation100, Citation126, Citation129, Citation131, Citation149–151]. The limits of corrosion rate are shown in both of the long-term melter data plot (top, > 300 days) and the short-term crucible data plot (bottom, ≤ 7 days) for comparison. The non-SI unit inch is used in the plots as it is used in all the data source reports. The DWPF design basis of 0.0075 inch/day equals to 191 µm/day and the proposed limit of crucible test of 0.0067 inch/day equals to 169 µm/day. It should be noted that the two DWPF data points are very roughly estimated based on visual inspection of DWPF Melter 1 [Citation149, Citation150] and DWPF Melter 2 [Citation151] after end of their service.](/cms/asset/97fbe9bd-e1e0-4713-9343-2314c3a78fff/yimr_a_2211469_f0008_oc.jpg)
Modelling approaches
Theoretical corrosion models have been derived to understand the dissolution of refractory in contact with molten glass at the melt line [Citation152–155]. However, melt line dissolution models have limited application to production melters due to the complexity of the refractory wear mechanisms during operation. In nuclear waste glass production, the composition of the glass is not fixed, and empirical approaches based on glass composition, one of the most important controlling variables, have been developed in place of theoretical models [Citation127,Citation156,Citation157]. These empirical methods are developed through laboratory data and extrapolated to fit the application. The aim of collecting laboratory-scale melt-line corrosion data of the Monofrax® K3 refractory in contact with nuclear waste glass compositions has been to develop a predictive model for refractory lining service life during operation [Citation126,Citation127]. However, the development of a model for full-scale, operational melters is challenging due to the available data. Moving from an empirical understanding of crucible neck-line corrosion data to a predictive capability of refractory lining service life in nuclear waste glass melters is a fruitful area for future study.
It may be possible to better understand the factors that contribute to corrosion at multiple scales and thus develop models that capture the complex behaviours in nuclear waste glass melters by pursuing various modelling approaches in concert. For example, empirical models based on laboratory-scale tests to correlate glass composition with refractory loss are extremely relevant as a gross approximation. However, these approaches would benefit from theoretical models of melt line dissolution that include relevant physical phenomena. Lastly, a corrosion model that includes the coupled physics mechanisms besides melt line dissolution (e.g. spalling) occurring in a production nuclear waste glass melter over long-term operation should be considered. These approaches are discussed in the following subsections.
Empirical models based on laboratory-scale test data
One basic approach to correlate refractory life to glass composition is to empirically measure the corrosion with various glass compositions and extrapolate a corrosion rate. This approach uses test data from the widely accepted crucible scale tests that are considered qualitative. Basic modelling tools provide empirical fits based on glass composition. For example, Muller et al. [Citation126], reported crucible test data of Monofrax® K-3 corrosion in their database ( and ). Based on this dataset, three models were developed using different mathematical tools (). Muller et al. [Citation126] fitted the data with a 28-term partial quadratic mixture model. Vienna et al. [Citation127] presented a reduced linear mixture model on a primary set of 11 glass components and reached similar predictions ((a)). Smith-Gray et al. [Citation128] used machine learning methods with 16 different oxides in the glass composition and found that Bayesian Ridge regression showed the best comparison for predictions of neck loss data. The linear mixture model and the best-fit regression obtained from machine learning are compared in (b). (c) displays the response trace plot for the 13-term model by Vienna et al. [127]. Cr2O3, Al2O3, V2O5, SiO2, and ZrO2 are predicted decrease the corrosion depth while Li2O and Na2O are predicted to increase the corrosion most. The curvature in Li2O effect is also evident with a high slope at low Li2O concentrations and lower slope at higher Li2O concentrations.
Figure 9. Example of empirical models of Monofrax® K-3 corrosion by crucible test. (a) linear mixture model fit. (b) machine learning fit. (c) response trace plot for 13-Term reduced partial quadratic mixture model on the naturallogarithm of melt line corrosion depth. Data adapted from Muller et al. [Citation126], Vienna et al. [Citation127], and Smith-Gray et al. [Citation128]. The non-SI unit inch is used in the plots as it is used in all the data source reports.
![Figure 9. Example of empirical models of Monofrax® K-3 corrosion by crucible test. (a) linear mixture model fit. (b) machine learning fit. (c) response trace plot for 13-Term reduced partial quadratic mixture model on the naturallogarithm of melt line corrosion depth. Data adapted from Muller et al. [Citation126], Vienna et al. [Citation127], and Smith-Gray et al. [Citation128]. The non-SI unit inch is used in the plots as it is used in all the data source reports.](/cms/asset/9f61fef1-b0c2-4854-bfdd-dbd1a0d735cd/yimr_a_2211469_f0009_oc.jpg)
Although the composition models fit the test crucible data well, they are insufficient to predict refractory lifetime during melter operation, in which composition and operational parameters change frequently. Rather, these models provide a practical, but conservative operational limit based on the most aggressive corrosion depth (e.g. the neck loss) measured by standardized tests. For example, referring to and , a design life prediction can be made based on material loss measured in length per year. This approach is necessarily conservative and further evidenced by melter life in the DWPF. It is important to be able to define a more accurate refractory service life limit to maximize waste throughput while meeting all the processing and quality constraints place upon the glass composition. This will require more theoretically-based approaches than the existing empirical methods.
Melt line dissolution models
There are models that explore the fundamental driving forces for refractory corrosion in contact with molten glass. In particular, melter refractory lifetime is considered largely dependent on corrosion behaviour at the three-phase boundary, i.e. the melt line (also referred to as flux line or slag line). Hrma’s work [Citation152] studied free surface convection Marangoni flows as the cause of neck-line corrosion and developed an equation for the dissolution rate with a simple parameter based on local concentration and velocity in a laminar flow regime. Tsotridis [Citation153] noted the phenomenon of flux line corrosion occurring in the refractory at the gas-melt interface and used 2-D Navier Stokes equations to derive a simple model to test the driving forces for corrosion, such as thermal, concentration gradients, diffusion rates and determined surface tension forces are the most influential. Pötschke and Brüggmann [Citation154] discussed the influence of Marangoni convection currents caused by concentration or temperature gradients along the interface of the gas–liquid interface on refractory corrosion kinetics. While the kinetic corrosion rate equation was developed for steel melting, the authors note that the method is applicable to other high temperature molten liquids, such as glass melting. Lian et al. [Citation155] also noted the Marangoni effect as a direct cause of premature destruction of alumina refractories. A geometrical model of the corrosion groove at the surface was developed and the calculated results were compared with experimental measurements, showing good agreement [Citation155]. (a) shows a diagram of the coupon corroding at the neckline, and (b) shows the flow occurring from this convection.
Figure 10. Diagram of dissolution at surface (a) neck corrosion on sample (1: solid, 2: liquid, 3: gas) and (b) Marangoni flow schematic showing development of corrosion groove. Adopted from Hrma [Citation152] and Pötschke and Brüggmann [Citation154].
![Figure 10. Diagram of dissolution at surface (a) neck corrosion on sample (1: solid, 2: liquid, 3: gas) and (b) Marangoni flow schematic showing development of corrosion groove. Adopted from Hrma [Citation152] and Pötschke and Brüggmann [Citation154].](/cms/asset/e145ce9b-e5a5-4b64-ad73-427205f868a8/yimr_a_2211469_f0010_oc.jpg)
The melt line dissolution models discussed above showed that surface tension-driven flow has a significant influence on material loss at the melt line, whereas other free and forced convection flows are relatively insignificant. Local corrosion of the refractory occurs at a higher rate at the melt line, where components from the refractory dissolve into the glass and alter the interfacial tension and viscosity. This results in a surface tension gradient that induces Marangoni convection, which accelerates corrosion and results in the formation of a corrosion groove or ‘neck’ which is the most severe form of refractory corrosion in glass melters. Several sources have compiled linear fits for the surface tension of glasses based on measurements, though these are generally limited to simple forms with fewer oxide components than used in waste glass [Citation158, Citation159]. Typically, in silica melts, K2O, B2O3, and PbO decrease the surface tension, while Li2O, Al2O3, MgO, CoO and ZnO increase the surface tension [Citation160]. This is of interest because Al2O3 is a major component present in Monofrax® K-3, and localized corrosion at the melt line could increase the local surface tension, amplifying the Marangoni effect.
Surface tension is influenced by temperature, chemical composition, and atmosphere [Citation161]. Bonds between the molecules become weaker at higher temperatures, which decreases the surface tension; industrial glasses typically show a surface tension reduction of 4–10 mN/m for each 100 K temperature increase [Citation160]. The atmospheric water vapour is shown to have an effect between dried and normal air of about 5–13 mN/m, depending on temperature. Measurements of droplet shape using the sessile drop method are commonly used to determine surface tension for glass melts. The Bashforth and Adams method based on the Young-Laplace equation can be used with measurements of droplet geometry to determine contact angle, surface tension, and drop volume [Citation162]. Additionally, images can be analyzed computationally with higher accuracy using numerical procedures that derive a best fit to the drop profile over the entire meridional section instead of at just a few points [Citation163].
Corrosion models based on melter operation
An approach to circumvent the shortcomings of scaled crucible tests and the dynamics in operational melters has been to develop numerical models to predict corrosion rates and extrapolated melter refractory lifetime based on the observed phenomena in operational melters. Brosnan [Citation164] introduced models to correlate the corrosion rate with chemical compatibility (between the refractory and the melt) and temperature gradients. Nishikawa et al. [Citation165] developed a temperature gradient model to predict the long-term steady-state corrosion rate. Nishikawa’s model derived parameters from the corrosion rate of AZS (Al2O3–SiO2–ZrO2) refractory determined by diffusion and mass transfer, which are used to calculate a change in temperature at the glass/refractory interface with material loss, i.e. the temperature at the interface decreases as the interface moves outward due to material loss. The Nishikawa model has been shown to simulate corrosion rates that decrease with increasing time, in agreement with experimental data of a one-year test. It is generally understood that the corrosion rate of Monofrax® K-3 refractory in production melters decreases with operation time (). These models derived from operational data are useful, but they do not explicitly capture the mechanistic understanding needed to predict refractory loss as a function of glass composition. Rather, these types of models incorporate a multitude of variables inherent to operational melters that contribute to refractory corrosion behaviour. Furthermore, models based on melter operation data are often dependent on parameters specific to a system, that are not easily obtained and may not be universal across melter designs. The challenge remains to identify the most significant factors controlling refractory corrosion in operational melters and to utilize the mechanistic models elucidate the contribution and influence of those factors.
Future modelling outlook
Key factors controlling refractory corrosion are the temperature, refractory composition, glass chemistry, and mass transport near the refractory surface. Researchers have studied corrosion effects with other fluids. Xu and Cheng [Citation166] describe a computational fluid dynamics (CFD) simulation for flow-assisted corrosion of aluminium alloy in a glycol water solution. This work couples the electrochemical reactions that cause corrosion of aluminium with the local flow fields to show the impact of convective currents on corrosion rates. Hu and Cheng [Citation167] used a CFD model to simulate corrosion of a pipeline in an oil–water two-phase system with CO2. An empirical corrosion rate based on local CO2 concentration is coupled with the CFD model to show the impact of flow velocity on local corrosion. These studies are possible due to the ability of the CFD model to resolve the near-wall flow. Jantzen et al. [Citation99] tested the corrosion of Monofrax® K-3 samples in simulated HLW melter feed and from that testing proposed oxidation and reduction reactions that were an important factor in corrosion. A similar methodology could be employed with CFD simulations of waste vitrification melters to couple the methods of Xu and Chen [Citation166] and Hu and Cheng [Citation167] with associated reactions with model corrosion rates at the melt line.
Simple, yet informative, thermodynamic calculations can also be performed using a material-to-material calculator, such as that available in Thermo-Calc software [Citation168]. This method is applicable where different materials are in contact and will react (or gradually transition into) with each other (i.e. molten glass and refractory). These calculations use thermodynamic equilibrium boundary conditions, so they are much faster computationally than diffusion calculations. Equilibrium calculations are performed along linear composition gradients and along the composition profiles. This method can provide information about the stable phases that are expected when two materials are in contact and transition into each other with linear gradients. The change with temperature of the phases and their compositions, along with the formation of any parasitic phases, can be predicted in this way. This type of analysis is particularly useful in high-temperature applications where materials may be subjected to extreme conditions that can lead to phase transformations, corrosion, or other types of degradation. Coupling this type of analysis with experiments to determine kinetic rates could lead to a more rigorous corrosion model than simple polynomial (or-otherwise) fitted correlations.
Summary and recommendations for future work
Monofrax® K-3 is a high chromia refractory that is used in the waste vitrification melters operating in the United States. These vitrification facilities must reliably operate for decades while the melters are expected to be replaced every several years. Thus, accurate prediction of the useful service life of the refractory lining is necessary to plan for maintenance and replacement of the melters. This review summarizes relevant corrosion data from crucible tests and inspection reports of post-production melters lined with Monofrax® K-3 refractory. A challenge to predicting refractory life is estimating corrosion as a function of time, which is much longer than the duration of a practical crucible test. It is known that the corrosion rate decreases with increasing time for both melter tests/operation and crucible tests. Therefore, investigating the corrosion of the refractory lining of operating melters remains very important. In addition, many factors influence refractory life, including glass composition, temperature, mass flow of glass, plenum atmosphere, salt formation, and glass redox conditions. To understand each of these variables, they should be evaluated systematically in controlled laboratory-scale crucible tests, which is crucial to developing predictive models to estimate refractory lifetime from material loss by corrosion. Relating these results to scaled melter tests will be a necessary further step in evaluating a predictive model for estimating refractory lifetime and corrosion rate.
It is well known that laboratory scale refractory corrosion tests (e.g. ASTM C621) do not reliably predict refractory lifetime in a waste glass melter. Monofrax® K-3 corrosion data collected to date using laboratory scale crucible tests are insufficient to make accurate predictions of melter refractory lifetime. Furthermore, comparisons of corrosion data between crucible tests, scaled melter tests, and production melters, are generally ambiguous. Relating crucible tests to scaled melter tests and the observed behaviour in production melters is a necessary step to develop a predictive model for estimating refractory lifetime and operational limitations. The following recommendations are provided to facilitate scaling of laboratory scale corrosion testing results to prototypic melters:
Collect corrosion data under prototypic melter conditions to determine the effects of critical factors such as melt resonance time, melt temperature, redox conditions, and presence of salt phases in contact with the melt and refractory. Collecting corrosion data with various redox conditions (the redox state of the atmosphere in the melter depends on the melter feed composition) and with the presence of molten salt phases are needed to evaluate the effects of environmental factors prototypic of melters. In addition to the glass chemistry, viscosity is a critical property of the melt that affects corrosion. Investigations should also include viscosity under controlled test conditions by selecting and testing glasses with similar viscosity behavior as a function of melt temperature. These types of controlled tests will facilitate assessment of the changes to the refractory from chemical reaction, phase evolution, and mass transfer that occur over the life of the melter.
Conduct long-term corrosion studies to understand long-term corrosion damage of the melter lining and improve estimation of long-term material loss. Crucible tests may have practical limitations owing to equilibrium in a closed system. However, one approach to overcome these limitations is to combine computational modeling with experimental data (long-term melter tests would provide the most useful data) to elucidate key drivers affecting refractory corrosion. It may be feasible to develop fitted correlations that can be incorporated into CFD simulations under differing flow regimes to predict corrosion rates in different regions of full-scale melters for refractory life estimates. A conservative range of flow regimes can be used to easily estimate expected melter conditions including the influence of pronounced melt line fluctuations on corrosion.
Investigate the impact on the efficiency of the ‘integrated flowsheet’ when applying the corrosion model in glass formulation (see for example [Citation169]). If using the corrosion model in a glass formulation, it would likely result in reduced alkaline and increased Cr2O3, which may lead to a lower waste loading. In addition, other properties such as viscosity, electrical conductivity, and sulphur solubility could be impacted as well. The constraints of potential corrosion models and the overall impact on operational efficiency must be evaluated.
Acknowledgements
The authors would like to thank Pavel Hrma of AttainX, Support Services Contractor to the Office of River Protection, U.S. Department of Energy and Chris Chapman of Pacific Northwest National Laboratory for criticism and discussion. The authors would also like to thank Renee Russell and Emily Nienhuis of Pacific Northwest National Laboratory and Richard Wyrwas of Savannah River National Laboratory for their help in technical review of this article.
Disclosure statement
No potential conflict of interest was reported by the author(s).
Additional information
Funding
Notes
1 This material was called Carborundum Monofrax® K-3 in some reports in the 1970s–1990s. The Carborundum Company in Falconer, NY used Monofrax as a registered trademark for the product; after years the company has changed its name to Monofrax LLC. The company has been acquired by Saint-Gobain in 2022.
References
- Vitrified High-Level Radioactive Waste – November 2017 by U.S. Nuclear Waste Technical Review Board (Web Page). Available from: https://www.nwtrb.gov/our-work/fact-sheets/vitrified-high-level-radioactive-waste, accessed 02/28/2023.
- Committee on Long-Term Research Needs for Radioactive High-Level Waste at Department of Energy Sites, Board on Radioactive Waste Management, National Research Council. Research Needs for High-Level Waste Stored in Tanks and Bins at U.S. Department of Energy Sites: Environmental Management Science Program: National Academies Press; 2001. Available from: https://nap.nationalacademies.org/catalog/10191/research-needs-for-high-level-waste-stored-in-tanks-and-bins-at-us-department-of-energy-sites.
- Regalbuto M, Jones J, Schneider SP. Chapter 18 - United States: experience of radioactive waste (RAW) management and contaminated site cleanup. In: Lee WE, Ojovan MI, Jantzen CM, editors. Radioactive waste management and contaminated site clean-up: processes, technologies and international experience. Woodhead Publishing; 2013. p. 567–611.
- U.S. Department of Energy. Vitrification systems lessons learned. U.S. Department of Energy Office of Engineering Assistance and Site Interface, Germantown, MD, USA, 1999. Available from: https://inldigitallibrary.inl.gov/PRR/93682.pdf.
- Jain V. Survey of waste solidification process technologies, NUREG/CR-6666, CNWRA 98-005. U.S. Nuclear Regulatory Commission Office of Nuclear Material Safety and Safeguards. Washington DC, USA, 2001. https://www.nrc.gov/reading-rm/doc-collections/nuregs/contract/cr6666/index.html.
- DesCamp VA, McMahon CL. Vitrification facility at the West Valley Demonstration Project, DOE/NE/44139-77. West Valley, NY, USA: West Valley Nuclear Services Co., Inc.; 1996. doi:10.2172/674668.
- Jain V, Barnes S. Radioactive waste glass production at the WVDP. Waste Management (WM) Symposia, Phoenix, AZ, USA, 1997.
- Petkus LL, Paul J, Valenti PJ, et al. A complete history of the high-level waste plant at the West Valley Demonstration Project. Waste Management (WM) Symposia, Tucson, AZ, USA, 2003.
- Palmer RA, Houston HM, Misercola AJ. Completion of the vitrification campaign at the West Valley Demonstration Project. Ceram Trans. 2004;155:179–196.
- Sigler J. ICP CAB evaluates path forward for high-level waste at INL (Web Page). Available from: https://www.energy.gov/em/icpcab/articles/icp-cab-evaluates-path-forward-high-level-waste-inl, accessed 03/23/2023.
- Oertel GK, Walton RD. Management of defense high-level waste in the United States. In: Wicks GG, Ross WA, editors. Advances in ceramics Vol. 8: Nuclear waste management. Columbus, OH, USA: American Ceramic Society; 1984. p. 1–5.
- Chew D, Hamm B, Wells M. Liquid Waste System Plan Revision 21, SRR-LWP-2009-00001. Savannah River Remediation LLC and Savannah River Site, Aiken, SC, USA, 2019. https://www.energy.gov/sites/default/files/2019/05/f62/SRS-Liquid-Waste-System-Plan-January-2019-0.pdf.
- Chew D. Savannah River Site – Waste Tank Levels, SRMC-LWP-2022-00001, Rev. 75. Savannah River Remediation LLC and Savannah River Site, Aiken, SC, USA, 2022.
- Wiersma BJ. The performance of underground radioactive waste storage tanks at the Savannah River Site: a 60-year historical perspective. JOM. 2014;66(3):471–490.
- Bernards JK, Hersi GA, Hohl TM, et al. River Protection Project System Plan, ORP-11242, Rev. 9. U.S. Department of Energy, Office of River Protection, Richland, WA, USA, 2020. Available from: https://www.hanford.gov/files.cfm/System_Plan_9.pdf.
- Burbank D, Petkus L, Hamlett M, et al. Hanford WTP LAW melter startup and tuning feed material development. Waste Management (WM) Symposia, Phoenix, AZ, USA, 2017.
- Smith E, Bergmann D, Roach J. Preparing to assemble spare melters for the Hanford WTP DFLAW facility. Waste Management (WM) Symposia, Phoenix, AZ, USA, 2021.
- Gephart RE, Lundgren RE. Hanford tank clean up: A guide to understanding the technical issues, PNL-10773. Pacific Northwest Laboratory, Richland, WA, USA, 1995. doi:10.2172/195769.
- Peterson RA, Buck EC, Chun J, et al. Review of the scientific understanding of radioactive waste at the U.S. DOE Hanford Site. Environ Sci Technol. 2018;52(2):381–396.
- Colburn HA, Peterson RA. A history of Hanford tank waste, implications for waste treatment, and disposal. Environ Prog Sustain Energy. 2021;40(1):e13567.
- Wilmarth WR, Lumetta GJ, Johnson ME, et al. Review: waste-pretreatment technologies for remediation of legacy defense nuclear wastes. Solvent Extr Ion Exch. 2011;29(1):1–48.
- International Atomic Energy Agency. Classification of Radioactive Waste, IAEA Safety Standards Series No. GSG-1. IAEA, Vienna, Austria, 2009. Available from: https://www.iaea.org/publications/8154/classification-of-radioactive-waste.
- Taylor RF. Chemical engineering problems of radioactive waste fixation by vitrification. Chem Eng Sci. 1985;40(4):541–569.
- Donald IW, Metcalfe BL, Taylor RNJ. The immobilization of high level radioactive wastes using ceramics and glasses. J Mater Sci. 1997;32(22):5851–5887.
- Vienna JD. Nuclear waste vitrification in the United States: recent developments and future options. Int J Appl Glass Sci. 2010;1(3):309–321.
- Ojovan MI, Lee WE. Glassy wasteforms for nuclear waste immobilization. Metall Mater Trans A-Phys Metall Mater Sci. 2011;42A(4):837–851.
- Goel A, McCloy JS, Pokorny R, et al. Challenges with vitrification of Hanford high-level waste (HLW) to borosilicate glass – An overview. J Non-Cryst Solids: X. 2019;4:100033.
- Gin S, Jollivet P, Tribet M, et al. Radionuclides containment in nuclear glasses: an overview. Radiochim Acta. 2017;105(11):927.
- Calcined High-Level Radioactive Waste – June 2020 by U.S. Nuclear Waste Technical Review Board (Web Page). Available from: https://www.nwtrb.gov/our-work/fact-sheets/calcined-high-level-radioactive-waste, accessed 03/23/2023.
- DOE-Managed Spent Nuclear Fuel at Idaho National Laboratory - JUNE 2020 by U.S. Nuclear Waste Technical Review Board (Web Page). Available from: https://www.nwtrb.gov/our-work/fact-sheets/doe-managed-spent-nuclear-fuel-at-idaho-national-laboratory, accessed 03/23/2023.
- Merrill RA, Janke DS. Results of vitrifying Fernald OU-4 wastes. Waste Management (WM) Symposia, Tucson, AZ, USA, 1993.
- Gimpel RF, Paine D, Roberts JL, et al. Vitrification development and experiences at Fernald, Ohio. Institute of Nuclear Materials Management (INMM) 39th Annual Meeting, Naples, FL, USA, 1998.
- Akgunduz N, Gimpel RF, Paine D, et al. Vitrification pilot plant melter incident: final report, Report No. 40100-RP-0019. Fluor Daniel Fernald, Inc., Cincinnati, OH, USA, 1997. https://www.lm.doe.gov/cercla/documents/fernald_docs/CAT/Revised%20113085.pdf.
- Akgunduz N, Gimpel RF, Paine D, et al. Vitrification pilot plant experiences at Fernald, Ohio. In: Schulz WW, Lombardo NJ, editors. Science and technology for disposal of radioactive tank wastes. New York, NY, USA: Springer; 1998. p. 351–361.
- Jantzen CM. Vitrification of simulated Fernald K-65 Silo waste at low temperature, WSRC-TR-97-0061, Rev. 1. Westinghouse Savannah River Company, Savannah River Site, Aiken, SC, USA, 1999. doi:10.2172/5304.
- Matlack KS, Pegg IL, Callow RA, et al. Final report – engineering study for DWPF bubblers, VSL-10R1770-1, Rev 0, ORP-56289, Rev 0. Vitreous State Laboratory, The Catholic University of America and EnergySolutions Federal EPC, Inc., Washington, DC, USA, 2010. doi:10.2172/1105967.
- Chapman CC, Buelt JL, Slate SC, et al. Vitrification of Hanford wastes in a joule-heated ceramic melter and evaluation of resultant canisterized product, PNL-2904. Pacific Northwest Laboratory, Richland, WA, USA, 1979. doi:10.2172/5966019.
- Weisenburger S. Nuclear waste vitrification in a ceramic-lined electric glass melter. IEEE Trans Ind Appl. 1982;IA-18(1):73–82.
- Chapman CC. Nuclear waste glass melter design including the power and control systems. IEEE Trans Ind Appl. 1982;IA-18(1):65–72.
- Chapman CC, Pope JM, Barnes SM. Electric melting of nuclear waste glasses state of the art. J Non-Cryst Solids. 1986;84(1):226–240.
- Chapman CC, McElroy JL. Slurry-fed ceramic melter–A broadly accepted system to vitrify high-level waste). International Waste Management Conference of the American Society of Mechanical Engineers, Kyoto, Japan, 1989.
- Bickford D. Selection of melter systems for the DOE/Industrial Center for Waste Vitrification Research, WSRC-TR-93-762. Westinghouse Savannah River Co., Aiken, SC, USA, 1993. doi:10.2172/10189289.
- Gupta R, Dani U, Nair K, et al. Challenges in retrofitting of ceramic melter in place of liquid fed metallic melter. Waste Management (WM) Symposia, Tucson, AZ, USA, 2004.
- Matlack KS, Pegg IL. Advances in JHCM HLW vitrification technology at VSL through scaled melter testing. Ceram Trans. 2013;241:47–58.
- Smith EC, Bowan B, Pegg IL. Application of Joule Heated Ceramic Melter (JHCM) technology for stabilization of radioactive waste in the United States. Implementing Geological Disposal of Radioactive Waste Technology Platform (IGD-TP) 6th Exchange Forum; London, UK, 2015.
- Hrma PR, Matyas J, Kim D-S. The chemistry and physics of melter cold cap. Spectrum 2002: exploring science-based solutions and technologies. 9th biennial International Conference on Nuclear and Hazardous Waste Management Reno, NV, USA, 2002.
- Pegg I. Behavior of technetium in nuclear waste vitrification processes. J Radioanal Nucl Chem. 2015;35:287–292.
- Hrma P, Kruger AA, Pokorny R. Nuclear waste vitrification efficiency: cold cap reactions. J Non-Cryst Solids. 2012;358(24):3559–3562.
- Xu K, Hrma P, Rice JA, et al. Conversion of nuclear waste to molten glass: cold-cap reactions in crucible tests. J Am Ceram Soc. 2016;99(9):2964–2970.
- Lee S, Hrma P, Pokorny R, et al. Effect of melter feed foaming on heat flux to the cold cap. J Nucl Mater. 2017;496:54–65.
- Hrma P, Klouzek J, Pokorny R, et al. Heat transfer from glass melt to cold cap: gas evolution and foaming. J Am Ceram Soc. 2019;102(10):5853–5865.
- Lee SM, McCarthy BP, Hrma P, et al. Viscosity of glass-forming melt at the bottom of high-level waste melter-feed cold caps: effects of temperature and incorporation of solid components. J Am Ceram Soc. 2020;103(3):1615–1630.
- Abboud AW, Guillen DP, Hrma P, et al. Heat transfer from glass melt to cold cap: computational fluid dynamics study of cavities beneath cold cap. Int J Appl Glass Sci. 2021;12(2):233–244.
- Pokorny R, Kruger AA, Hrma P. Mathematical modeling of cold cap: effect of bubbling on melting rate. Ceram Silik. 2014;58:296–302.
- Hodges BC, Iverson DC, Diener G. Operation of bubblers in the Savannah River Site Defense Waste Processing Facility melter. Waste Management (WM) Symposia, Phoenix, AZ, USA. 2012.
- Smith M, Iverson D. Installation of bubblers in the Savannah River Sited Defense Waste Processing Facility melter. Waste Management (WM) Symposia, Phoenix, AZ, USA. 2010.
- Kelly SE. A joule-heated melter technology for the treatment and immobilization of low-activity waste, RPP-48935, Rev. 0. Washington River Protection Solutions, LLC, Richland, WA, USA, 2011. Available from: https://www.osti.gov/servlets/purl/1047859.
- Bingham PA, Connelly AJ, Hyatt NC, et al. Corrosion of glass contact refractories for the vitrification of radioactive wastes: a review. Int Mater Rev. 2011;56(4):226–242.
- Selkregg K. Fusion cast refractories: roles of containment. Am Ceram Soc Bull. 2018;97(2):21–28.
- Wicks G. Compatibility tests of materials for a prototype ceramic melter for defense glass-waste products, DP-MS −78 −90. Du Pont de Nemours (EI) and Co. and Savannah River Laboratory, Aiken, SC, USA, 1979. https://www.osti.gov/servlets/purl/6243471.
- Barnes SM, Larson DE. Materials and design experience in a slurry-fed electric glass melter, PNL-3959. Pacific Northwest Laboratory, Richland, WA, USA, 1981. doi:10.2172/6241111.
- Rankin WN. Evaluation of glass-contact materials for waste glass melters. In: Wicks GG, Ross WA, editor. Advances in ceramics Vo. 8: nuclear waste management. Columbus, OH, USA: American Ceramic Society; 1984. p. 559–566.
- Bickford DF, Corbett RA. Material selection for nuclear waste processing facility. J Mater Energy Syst. 1986;8(2):142–149.
- Jantzen CM, Brown KG, Imrich KJ, et al. High Cr2O3 refractory corrosion in oxidizing melter feeds: relevance to nuclear and hazardous waste vitrification. Ceram Trans. 1999;93:203–212.
- Gan H, Lu X, Buechele AC, et al. Corrosion of chromium-rich oxide refractories in molten waste glasses. Vitreous State Laboratory, The Catholic University of America, Washington, DC, USA, 2002. doi:10.2172/793355
- Reigel M. Literature review: Assessment of DWPF melter and melter off-gas system lifetime, SRNL-STI-2014-00134. Savannah River National Laboratory, Aiken, SC, USA, 2015. doi:10.2172/1209038.
- Reigel MM, Imrich KJ, Jantzen CM. Corrosion evaluation of melter materials for radioactive waste vitrification. Ceram Trans. 2015;253:83–96.
- Lee WE, Moore RE. Evolution of in situ refractories in the 20th century. J Am Ceram Soc. 1998;81(6):1385–1410.
- Lee WE, Zhang S. Melt corrosion of oxide and oxide–carbon refractories. Int Mater Rev. 1999;44(3):77–104.
- McCauley RA. Corrosion: a review of some fundamentals. Ceram Trans. 1996;78:81–89.
- Pecoraro GA. How the properties of glass melts influence the dissolution of refractory materials. In: Pye D, Joseph I, Montenero A, editors. Properties of glass-forming melts. 1st ed. Boca Raton, FL, USA: CRC Press; 2005. p. 339–390.
- Kwong K, Petty A, Bennett J, et al. Wear mechanisms of chromia refractories in slagging gasifiers. Int J Appl Ceram Technol. 2007;4(6):503–513.
- Trier W, Loewenstein KL. Glass furnaces: design, construction and operation. Huddersfield, UK: Society of Glass Technology; 1987.
- Cooper A. Ceram Eng Sci Proc. 1981;2:1063–1089.
- Mahapatra MK. Review of corrosion of refractory in gaseous environment. Int J Appl Ceram Technol. 2019;17(2):606–615.
- Bennett J, Kwong K. Failure mechanisms in high chrome oxide gasifier refractories. Metall Mater Trans A. 2011;42:888–904.
- Busby TS, Barker J. Simulative studies of upward drilling. J Am Ceram Soc. 1966;49(8):441–446.
- Begley ER, Herndon PO. Upward drilling of glass contact refractories. Am Ceram Soc Bull. 1970;49(7):633–637.
- Busby T, Cox G BEG. Upward drilling – physicochemical aspects and implications for furnace design. Glass Technol. 1971;12(4):94–102.
- Chen J, Xiao J, Zhang Y, et al. Degradation mechanism of Cr2O3-Al2O3-ZrO2 refractories in a coal-water slurry gasifier: role of stress cracks. J Am Ceram Soc. 2020;103(5):3299–3310.
- Nath M, Kumar P, Song S, et al. Thermo-mechanical stability of bulk (Al1–xCrx)2O3 solid solution. Ceram Int. 2019;45(9):12411–12416.
- Sandhage KH, Yurek GJ. Indirect dissolution of sapphire into silicate melts. J Am Ceram Soc. 1988;71(6):478–489.
- Vienna JD, Kim D-S, Muller IS, et al. Toward understanding the effect of low-activity waste glass composition on sulfur solubility. J Am Ceram Soc. 2014;97(10):3135–3142.
- Hrma PR, Bagaasen LM, Beck AE, et al. Bulk vitrification castable refractory block protection study, PNNL-15193, PNNL-15193. Pacific Northwest National Laboratory, Richland, WA, USA, 2005. doi:10.2172/877052.
- Marra JC, Congdon JW, KielpinsM AL, et al. Corrosion assessment of refractory materials for waste vitrification. Ceram Trans. 1996;78:273–287.
- Gan H, Lu X, Vidensky I, et al. Corrosion of K-3 Refractory and Metal Alloys in RPP-WTP LAW Glasses, VSL-01R3540-1, Rev. 0. Vitreous State Laboratory, The Catholic University of America, Washington, DC, USA, 2001.
- Matlack KS, Chaudhuri M, Gan H, et al. Glass formulation testing to increase sulfate incorporation, VSL-04R4960-1, Rev. 0, ORP-51808, Rev. 0. Vitreous State Laboratory, The Catholic University of America, Washington, DC, USA, 2005. doi:10.2172/1035193.
- Matlack KS, Muller IS, Gong W, et al. Small scale melter testing of LAW salt phase separation, VSL-07R7480-1, Rev. 0, ORP-63499, Rev.0. Vitreous State Laboratory, The Catholic University of America, Washington, DC, USA, 2007. doi:10.2172/1514890
- Jin T, Kim D, Kruger AA. Effects of sulfate on rhenium incorporation into low-activity waste glass. J Non-Cryst Solids. 2019;521:119528.
- Skidmore CH, Vienna JD, Jin T, et al. Sulfur solubility in low activity waste glass and its correlation to melter tolerance. Int J Appl Glass Sci. 2019;10(4):558–568.
- Hrma P, Kruger AA. Nuclear waste glasses: continuous melting and bulk vitrification. Adv Mater Res. 2008;39–40:633–640.
- Hrma PR, Bagaasen LM, Schweiger MJ, et al. Bulk vitrification performance enhancement: refractory lining protection against molten salt penetration, PNNL-16773. Pacific Northwest National Laboratory, Richland, WA, USA, 2007. doi:10.2172/940754.
- American Society for Testing and Materials (ASTM). Standard Test Method for Isothermal Corrosion Resistance of Refractories to Molten Glass. ASTM International; 2018. Standard No. ASTM C621-09 (2018).
- Rankin WN. Evaluation of corrosion and deposition in the 1941 melter, DPST-82-231. Savannah River Laboratory, E. I. du Pont de Nemours & Co., Aiken, SC, USA, 1982.
- Lu XD, Gan H, Buechele AC, et al. Corrosion of K-3 glass-contact refractory in sodium-rich aluminosilicate melts. MRS Online Proc Libr (OPL). 1999;556:279.
- Williams M, Jantzen C, Burket P. Corrosion Testing of Monofrax K-3 Refractory in Defense Waste Processing Facility (DWPF) Alternate Reductant Feeds, SRNL-STI-2016-00030. Savannah River National Laboratory, Aiken, SC, USA, 2016. doi:10.2172/1250758.
- Schreiber HD. Redox processes in glass-forming melts. J Non-Cryst Solids. 1986;84(1):129–141.
- Jantzen CM, Williams MS, Zamecnik JR, et al. Interim glycol flowsheet reduction/oxidation (redox) model for the Defense Waste Processing Facility (DWPF), SRNL-STI-2015-00702. Savannah River National Laboratory, Aiken, SC, USA, 2016. doi:10.2172/1244066.
- Jantzen CM, Imrich KJ, Brown KG, et al. High chrome refractory characterization: part I. impact of melt reduction/oxidation on the corrosion mechanism. Int J Appl Glass Sci. 2015;6(2):137–157.
- Mickalonis JI, Imrich KJ, Jantzen CM, et al. Corrosion impact of reductant on DWPF and downstream facilities, SRNL-STI-2014-00281. Aiken (SC): Savannah River National Laboratory; 2014. doi:10.2172/1167129
- Crichton S, Barbieri T, Tomozawa M. Solubility limits for troublesome components in a simulated Low level nuclear waste glass. Ceram Trans. 1995;61:283–290.
- Li H, Hrma PR, Vienna JD. Sulfate retention and segregation in simulated radioactive waste borosilicate glasses. Ceram Trans. 2000;119:237–246.
- Jin T, Kim D, Darnell LP, et al. A crucible salt saturation method for determining sulfur solubility in glass melt. Int J Appl Glass Sci. 2019;10(1):92–102.
- Jin T, Kim D, Tucker AE, et al. Reactions during melting of low-activity waste glasses and their effects on the retention of rhenium as a surrogate for technetium-99. J Non-Cryst Solids. 2015;425:28–45.
- Matlack KS, Pegg I, Joseph I, et al. Support for HLW Direct Feed - Phase 2, VSL-15R3440-1, Rev. 0, ORP-60672, Rev.0. Vitreous State Laboratory, The Catholic University of America, Washington, DC, USA, 2017. doi:10.2172/1347547.
- Matlack KS, Kot WK, Muller I, et al. Support for HLW direct feed, VSL-14R3090-1, Rev. 0, ORP-60673, Rev. 0. Vitreous State Laboratory, The Catholic University of America, Washington, DC, USA, 2014. doi:10.2172/1909186.
- Matlack KS, Abramowitz H, Muller IS, et al. DFLAW Glass and Feed Qualifications to Support WTP Start-Up and Flow-Sheet Development (Final Report), VSL-17R4330-1, Rev. 0, ORP-63489, Rev. 0. Vitreous State Laboratory, The Catholic University of America, Washington, DC, USA, 2017. doi:10.2172/1529091.
- Matlack KS, Abramowitz H, Miller IS, et al. Final Report: Support for DF LAW Flowsheet Development Report, VSL-17R4250-1, Rev. 0, ORP-61653, Rev. 0. Vitreous State Laboratory, The Catholic University of America, Washington, DC, USA, 2017. doi:10.2172/1420317.
- Gan H, Feng Z, Chaudhuri M, et al. Corrosion Testing of Inconel and K-3 in LAW Glass, ORP-68804, Rev. 0, VSL-17R4240-1, Rev. 0. Vitreous State Laboratory, The Catholic University of America, Washington, DC, USA, 2017. doi:10.2172/1909239.
- Muller IS, Matlack KS, Pegg IL, et al. Enhanced LAW glass correlation - phase 3, VSL-17R4230-1, Rev. 0, ORP-63484, Rev. 0. Vitreous State Laboratory, The Catholic University of America, Washington, DC, USA, 2017. doi:10.2172/1512925.
- Muller IS, Matlack KS, Pegg IL, et al. Enhanced LAW glass correlation - phase 2, VSL-17R4140-1, Rev. 0, ORP-63483, Rev. 0. Vitreous State Laboratory, The Catholic University of America, Washington, DC, USA, 2017. doi:10.2172/1513830.
- Muller IS, Matlack KS, Pegg IL, et al. Enhanced LAW glass correlation - phase 1, VSL-16R4000-1, Rev. 0, ORP-60674, Rev. 0. Vitreous State Laboratory, The Catholic University of America, Washington, DC, USA, 2016. doi:10.2172/1347604.
- Muller IS, Chaudhuri M, Gan H, et al. Improved high-alkali low-activity waste formulations (Final Report), VSL-15R3290-1, Rev 0, ORP-63488, Rev. 0. Vitreous State Laboratory, The Catholic University of America, Washington, DC, USA, 2015. doi:10.2172/1529004.
- Muller IS, Matlack KS, Gan H, et al. Waste loading enhancements for Hanford LAW glasses, VSL-10R1790-1, Rev. 0, ORP-48578, Rev. 0. Vitreous State Laboratory, The Catholic University of America, Washington, DC, USA, 2010. doi:10.2172/1004083.
- Matlack KS, Joseph I, Gong W, et al. Glass formulation development and DM10 Melter Testing with ORP LAW Glasses, VSL-09R1510-2, Rev 0, ORP-56296, Rev 0. Vitreous State Laboratory, The Catholic University of America, Washington, DC, USA, 2009. doi:10.2172/1105979.
- Matlack KS, Joseph I, Gong W, et al. Final report - enhanced law glass formulation testing, VSL-07R1130-1, Rev 0, ORP-56293, Rev 0. Vitreous State Laboratory, The Catholic University of America, Washington, DC, USA, 2007. doi:10.2172/1105974.
- Matlack KS, Gong W, Muller IS, et al. Final Report - LAW Envelope A and B glass formulations testing in increase waste loading, VSL-06R6900-1, Rev. 0, ORP-56322, Rev. 0. Vitreous State Laboratory, The Catholic University of America, Washington, DC, USA, 2006. doi:10.2172/1109497.
- Muller IS, Joseph I, Pegg IL. Preparation and testing of LAW high-alkali correlation and augmentation matrix glasses (Final Report), VSL-06R6480-3, Rev. 0, ORP-63500, Rev. 0. Vitreous State Laboratory, The Catholic University of America, Washington, DC, USA, 2006. doi:10.2172/1523513.
- Matlack KS, Gong W, Muller IS, et al. Final Report - LAW envelope C glass formulation testing to increase waste loading, VSL-05R5900-1, Rev 0, ORP-56323, Rev 0. Vitreous State Laboratory, The Catholic University of America, Washington, DC, USA, 2005. doi:10.2172/1109496.
- Muller IS, Goloski L, Pegg IL, et al. LAW glass formulation to support AN-104 actual waste testing (Final Report), VSL-04R4470-1, Rev. 0, ORP-63496, Rev. 0. Vitreous State Laboratory, The Catholic University of America, Washington, DC, USA, 2004. doi:10.2172/1523506.
- Muller IS, Pegg IL, Rielley E, et al. LAW glass formulation to support AZ-101 actual waste testing (Final Report), VSL-03R3470-3, Rev. 0, ORP-63494, Rev. 0. Vitreous State Laboratory, The Catholic University of America, Washington, DC, USA, 2003. doi:10.2172/1528888.
- Muller IS, Pegg IL, Rielley E, et al. LAW glass formulation to support AP-101 actual waste testing (Final Report), VSL-03R3470-2, Rev 0, ORP-63486, Rev. 0. Vitreous State Laboratory, The Catholic University of America, Washington, DC, USA, 2003. doi:10.2172/1523467.
- Muller IS, Pegg IL, McKeown D, et al. LAW glass formulation to support AZ-102 actual waste testing (Final Report), VSL-03R3470-1, Rev. 0, ORP-63493, Rev. 0. Vitreous State Laboratory, The Catholic University of America, Washington, DC, USA, 2003. doi:10.2172/1515181.
- Muller IS, Pegg IL, Rielley E, et al. LAW glass formulation to support melter runs with simulants, VSL-03R3460-2, Rev. 0, ORP-58837, Rev. 0. Vitreous State Laboratory, The Catholic University of America, Washington, DC, USA, 2003. doi:10.2172/1855831.
- Muller IS, Pegg IL, Gan H, et al. Final Report. Baseline LAW glass formulation testing, VSL-03R3460-1, Rev. 0, ORP-59016, Rev. 0. Vitreous State Laboratory, The Catholic University of America, Washington, DC, USA, 2003. doi:10.2172/1186012.
- Muller IS, Gilbo K, Chaudhuri M, et al. K-3 Refractory corrosion and sulfate solubility model enhancement (Final Report), VSL-18R4360-1, Rev. 0, ORP-63490, Rev. 0. Vitreous State Laboratory, The Catholic University of America, Washington, DC, USA, 2018. doi:10.2172/1513833.
- Vienna JD, Heredia-Langner A, Cooley SK, et al. Glass property-composition models for support of Hanford WTP LAW Facility operation, PNNL-30932, Rev. 2, EWG-RPT-029, Rev. 2. Pacific Northwest National Laboratory, Richland, WA, USA, 2022. doi:10.2172/1862823.
- Smith-Gray NJ, Sargin I, Beckman S, et al. Machine learning to predict refractory corrosion during nuclear waste vitrification. MRS Adv. 2021;6(4):131–137.
- Fox KM. Crystallization in high level waste (HLW) Glass Melters: operational experience from the Savannah River Site, SRNL-STI-2013-00724, Rev. 0. Savannah River National Laboratory, Aiken, SC, USA, 2014. doi:10.2172/1122185.
- Allen TL, Iverson DC, Plodinec MJ. History of the small cylindrical melter, DP-1676. Savannah River Laboratory, E. I. du Pont de Nemours & Co., Aiken, SC, USA, 1985.
- Iverson DC, Bickford DF. Evaluation of materials performance in a large-scale glass melter after Two years of vitrifying simulated SRP defense waste. MRS Online Proc Lib (OPL). 1984;44:839–845.
- Matlack KS, Gong W, Bardakci T, et al. Integrated DM1200 Melter Testing Of HLW C-106/AY-102 Composition Using Bubblers, VSL-03R3800-1, Rev. 0, ORP-51439, Rev 0. Vitreous State Laboratory, The Catholic University of America, Washington DC, USA, 2003. doi:10.2172/1034652.
- Matlack K, Diener GA, Bardakci T, et al. Final Report Summary of DM1200 Operation at VSL, VSL-06R6710-2, Rev. 0, ORP-51434, Rev. 0. Vitreous State Laboratory, The Catholic University of America, Washington, DC, USA, 2006. doi:10.2172/1034643.
- Smith E, Diener G, Joseph I, et al. Waste vitrification melter throughput enhancement through increased operating temperature. Tucson, AZ, USA: Waste Management (WM) Symposia; 2005.
- Diener G. RPP-WTP LAW Pilot Melter disassembly report, REP-PLT-026, Rev. 0, ORP-68750, Rev. 0. Duratek Inc., Columbia, MD, USA, 2004. doi:10.2172/1906870.
- Hardy JS, Jin T, Hall MA, et al. Vitrification of high-Cr glass in research-scale melter, PNNL-30141, Rev. 0.0, EWG-RPT-028, Rev. 0.0 Pacific Northwest National Laboratory, Richland, WA, USA, 2020. doi:10.2172/1784531.
- Matyáš J, Sevigny GJ, Schweiger MJ, et al. Research-scale melter: an experimental platform for evaluating crystal accumulation in high-level waste glasses. Ceram Trans. 2015;253:49–58.
- Matyáš J, Sevigny GJ, Venarsky JJ, et al. Evaluation of crystal accumulation in high level waste glasses with research-scale melter, PNNL-27419, EWG-RPT-018. Pacific Northwest National Laboratory, Richland, WA, USA, 2018. doi:10.2172/1868935.
- Smith-Gray N, Bussey J, McCloy J. Microstructural examination of interactions between chromia-based refractory and nuclear glass in a melter. J Am Ceram Soc. 2022;105(12):7760–7769.
- Imrich KJ, Iverson DC. Metallurgical evaluation of an inconel 690 insert from a radioactive waste glass melter pour spout. Ceram Trans. 2000;107:643–651.
- Amerine DB. Basic Data Report – Defense Waste Processing Facility Sludge Plant, Savannah River Plant 200-S Area, DPSP-80-1033. E. I. du Pontde Nemours& Company, Savannah River Plant, Aiken, SC, USA, 1982. doi:10.2172/10182928.
- Smith E, Butler T, Ciorneiu B, et al. Advanced joule teated melter design to reduce Hanford Waste Treatment Plant operating costs. Waste Management (WM) Symposia. Phoenix, AZ, USA, 2011.
- Vienna J, Lumetta N, Kim D, et al. Robust and high-waste loaded glass formulations for Hanford Low-Activity Waste. Waste Management (WM) Symposia. Phoenix, AZ, USA, 2019.
- Dixon DR, Stewart CM, Venarsky JJ, et al. Vitrification of Hanford Tank Waste 241-AP-105 in a Continuous Laboratory-Scale Melter, PNNL-27775, RPT-DFTP-010, Rev. 0. Pacific Northwest National Laboratory, Richland, WA, USA, 2018. doi:10.2172/1476729.
- Dixon DR, Stewart CM, Venarsky JJ, et al. Vitrification of Hanford Tank Waste 241-AP-107 in a Continuous Laboratory-Scale Melter, PNNL-28361, Rev. 0, RPT-DFTP-014, Rev. 0. Pacific Northwest National Laboratory, Richland, WA, USA, 2019. doi:10.2172/1505629.
- Richardson B. Melter glass removal and dismantlement, ORNL/TM-2000/324. Oak Ridge National Laboratory, Oak Ridge, TN, USA, 2000. doi:10.2172/885718.
- Plodinec J, Jang PR, Long Z, et al. Use of optical and imaging techniques for inspection of off-line joule-heated melter at the West Valley Demonstration Project. Waste Management (WM) Symposia. Tucson, AZ, USA, 2003.
- Pieczynski T. West Valley Demonstration Project waste characterization of vitrification melter, WVDP-577, Rev. 1. Savannah River National Laboratory, CH2MHILL, B&W West Valley, LLC, West Valley, NY, USA, 2014. https://www.nrc.gov/docs/ML1429/ML14296A529.pdf.
- Iverson DC, Imrich KJ, Bickford DF, et al. Examination of DWPF Melter materials after 8 years of service, WSRC-MS-2003-00318. Westinghouse Savannah River Company, Aiken, SC, USA, 2003. doi:10.2172/810561.
- Iverson DC, Imrich KJ, Bickford DF, et al. Examination of DWPF melter materials after 8 years of service. Ceram Trans. 2004;155:217–226.
- Fox KM. Visual inspection of Defense Waste Processing Facility Melter 2 interior after end of service, SRNL-STI-2017-00428. Savannah River National Laboratory, Aiken, SC, USA, 2018. doi:10.2172/1434645.
- Hrma P. Dissolution of a solid body governed by surface free convection. Chem Eng Sci. 1970;25(11):1679–1688.
- Tsotridis G. The contribution of surface tension driven flows in flux line erosion. J Appl Phys. 1997;81(3):1231–1243.
- Pötschke J. Brüggmann C. premature wear of refractories due to marangoni-convection. Steel Res Int. 2012;83(7):637–644.
- Lian P, Huang A, Gu H, et al. Towards prediction of local corrosion on alumina refractories driven by marangoni convection. Ceram Int. 2018;44(2):1675–1680.
- Kim D. Glass property models, constraints, and formulation approaches for vitrification of high-level nuclear wastes at the US Hanford Site. J Korean Ceram Soc. 2015;52(2):92–102.
- Vienna JD, Piepel GF, Kim D-S, et al. Update of Hanford glass property models and constraints for use in estimating the glass mass to be produced at Hanford by implementing current enhanced glass formulation efforts, PNNL-25835. Pacific Northwest National Laboratory, Richland, WA, USA, 2016. doi:10.2172/1772236.
- Lyon KC. Calculation of surface tensions of glasses. J Am Ceram Soc. 1944;27(6):186–189.
- Kucuk A, Clare AG, Jones L. An estimation of the surface tension for silicate glass melts at 1400°C using statistical analysis. Glass Technol. 1999;40(5):149–153.
- Scholze H. Glass: nature, structure, and properties. New York, NY, USA: Springer; 2012.
- Weirauch DA. The surface tension of glass-forming melts. In: Pye D, Joseph I, Montenero A, editors. Properties of glass-forming melts. 1st ed. Boca Raton, FL, USA: CRC Press; 2005. p. 143–192.
- Tian YL, Guo SG, Wu DL. The study on measurement method of glass melts’ surface tension at high temperature. Adv Mater Res. 2014;889-890:732–736.
- Askari M, Cameron AM, Oakley J. The determination of surface tension at elevated temperatures by drop image analysis. High Temp Technol. 1990;8(3):201–207.
- Brosnan DA. Corrosion of refractories. In: Schacht CA, editor. Refractories handbook. New York, NY, USA: Marcel Dekker, Inc.; 2004. p. 39–77.
- Nishikawa T, Todoriki H, Itoh H, et al. Development of numerical prediction model of refractory corrosion for glass melting tank. Reports of the Research Laboratory, Asahi Glass Co., Ltd., 2005. Available from: https://www.agc.com/en/innovation/library/pdf/55-04.pdf.
- Xu LY, Cheng YF. Electrochemical characterization and CFD simulation of flow-assisted corrosion of aluminum alloy in ethylene glycol–water solution. Corros Sci. 2008;50(7):2094–2100.
- Hu H, Cheng YF. Modeling by computational fluid dynamics simulation of pipeline corrosion in CO2-containing oil-water two phase flow. J. Petrol Sci Eng. 2016;146:134–141.
- Material to Material Calculator (Web Page). Available from: https://thermocalc.com/products/thermo-calc/material-to-material-calculator/, accessed 03/23/2023.
- Lu X, Kim D-S, Vienna JD. Impacts of constraints and uncertainties on projected amount of Hanford low-activity waste glasses. Nucl Eng Des. 2021;385:111543.