Abstract
This paper reports (1) the latest development and application of a modified hyperbolic sine law for minimum creep strain rate and stress for both low Cr and high Cr steels, and (2) the development of a creep fracture criterion based on cavity area fraction along grain boundaries for high Cr steel. This work is part of the fundamental development of creep damage constitutive equations which were identified through a critical literature review. In the former the application of the new law results in an improved fitting; in the latter, a new creep fracture criterion based on cavity area fraction along grain boundaries was derived and quantitatively calibrated using the latest detailed cavity nucleation and growth kinetics models for high Cr steel. Furthermore, this paper revealed the trend of nucleation rate coefficient with stress, and the trend of creep life time coefficient with stress, which provide reliable and universal prediction capabilities. This paper contributes to the specific knowledge on the minimum creep strain rate and stress function, the development of a scientifically sound and novel creep rupture criterion based on the cavity area fraction along grain boundaries for high Cr steel, and the provision of creep damage/life prediction tools.
Introduction
Stress breakdown
In the development of high temperature materials for long term use, the accelerated creep test (short-term) may be used although it may not be reliable in predicting long time service. During high temperature service, this microstructure may progressively degrade, leading to unexpected consequences for long-term (100,000) creep performance.
The stress breakdown phenomenon for high Cr steel received positive reports in past literature [Citation1] and was praised by other research papers and reviews. Basically, it can be summarized as (1) there is a change of mechanisms in creep deformation, fracture, and the coupling between creep deformation and creep damage; and (2) it is understood that the nature of the cavity nucleation, growth and coalesce changes with the stress level, resulting in a change from a ductile to brittle fracture.
Constitutive modelling of creep damage
In an attempt to model the creep behaviour of high Cr steel, Yin et al. [Citation2] originally proposed a phenomenological relationship between the creep cavity damage and creep strain, which departed from the firm mechanism based relationship proposed by Dyson [Citation3]. The relevant equations are listed below for further use:(1.1)
where is the unaixal strain at fracture, kN has an upper limit of ≈ 1/3;
(1.2)
where are material constants respectively, and both
can be functions of temperature, but not of stress. When
, Equation (1.1) is a special case of Equation (1.2).
Such an approach cannot be extrapolated into lower stress levels beyond the range it has been calibrated [Citation4].
Basirat [Citation5] adopted Yin’s approach, but relaxed the definition of material constant A, by allowing there to be a function of stress;
(1.3)
the material constant A is a function of temperature and stress. The specific variation of cavitation coefficient A for P91 steel is shown in Table [Citation5] and graphically in Figure [Citation6].
Table 1. The variation of creep cavitation coefficient A [Citation5].
Figure 1. The variation of creep cavitation coefficient A with different variations of stress and temperature [Citation6].
![Figure 1. The variation of creep cavitation coefficient A with different variations of stress and temperature [Citation6].](/cms/asset/c2227f70-dd89-45d5-8791-8d381e90bfef/ymht_a_1388603_f0001_oc.gif)
Due to the lack of a clear trend for A, it is difficult to use it in prediction with confidence. The current creep damage modelling for long-term service is not yet satisfactory.
Challenges involved with creep damage modelling
The challenges involved with creep damage mechanics and creep damage modelling have been explored in a literature review [Citation7], and are summarised below:
| (1) | Characterising and quantifying the creep cavitation and develop damage criterion for parent metal and weld, respectively; experimental work (uniaxial and multi-axial interrupted creep test) to be carried out or gathered under low stress; cavitation to be quantified, ideally using X-ray micro-tomography. new damage criterion shall be developed; | ||||
| (2) | Quantifying the microstructural evolutions and their effects on the creep deformation; | ||||
| (3) | Developing and/or applying the novel creep formulation suitable for a wider range of stress, and incorporating the damage criterion developed in (1); | ||||
| (4) | Generalising uniaxial version into three dimensional one. | ||||
Aims of this paper
This paper aims to overcome the inaccuracies involved in the process of modelling minimum creep strain rate and stress, and in turn develop and apply a more scientifically sound creep fracture criterion.
Method and experimental data
The development of new minimum creep strain rate and stress function
The process for this part of work is: (1) to identify the deficiencies related to the existing functions, (2) to propose and apply a new mathematical function, and (3) to compare the predictions with experimental data in order to demonstrate and/or verify its capability.
The chosen experimental data of minimum creep strain rate and stress for this part of the work are:
| (1) | Creep Test One: low Cr steel (2·25Cr–1Mo steel), stress range of 60–180 MPa, temperature of 565 °C [Citation8], according Xu [Citation9]; | ||||
| (2) | Creep Test Two: low Cr Steel (0·5Cr–0·5Mo–0·25 V steel), stress range of 70–180 MPa, temperature of 565 °C [Citation10], according to Xu [Citation9]; | ||||
| (3) | Creep Test Three: high Cr steel, P91, stress range of 70–200 MPa; temperature of 600 °C [Citation11]. | ||||
The method of the development and application of creep fracture criterion based on cavity area fraction along grain boundary for high Cr steel
| (1) | To derive a specific quantitative equation for cavity area fraction along grain boundary based on the appropriate cavity nucleation and cavity growth models for a high Cr steel (namely P91); | ||||
| (2) | To determine the material parameter U′ of cavity area fraction equation according to the experimental data on creep rupture time under different stress levels and temperature; | ||||
| (3) | To apply the obtained cavity nucleation model to other high Cr steels in order to reveal the trend of cavity nucleation rate coefficient with stress. | ||||
The experimental data chosen for this part of work include:
| (1) | The creep rupture time for P91 [Citation11], stress range of 70–200 MPa, temperature of 600 °C, lifetime between 971 and 80736 h; temperature of 625 °C, lifetime 99–21372 h, for the work described in step (2) of the above; | ||||
| (2) | Cavitation information (cavity number density, stress) of high Cr steel (CB8, 10%wt Cr) [Citation12], stress range of 120–180 MPa, temperature of 600 °C lifetime between 2800 and 51406 h, for the work described in step (3) of the above. | ||||
Results
Modified hyperbolic sine law for minimum creep strain rate and stress for low Cr steel
The conventional hyperbolic sine law [Citation3,13] is given as:
(3.1)
The effectiveness and/or deficiency of its application to 2·25Cr–1Mo and 0·5Cr–0·5Mo–0·25 V low Cr steel is clearly demonstrated by Figures [Citation9] and [Citation9], respectively.
Figure 2. Comparison of conventional hyperbolic sine law with experiment [Citation8] for 2·25Cr–1Mo steel [Citation9].
![Figure 2. Comparison of conventional hyperbolic sine law with experiment [Citation8] for 2·25Cr–1Mo steel [Citation9].](/cms/asset/36d95a96-c2eb-4aea-b3ab-ea5229c0b8de/ymht_a_1388603_f0002_oc.gif)
Figure 3. Comparison of conventional hyperbolic sine law with experiment [Citation10] for 0·5Cr–0·5Mo–0·25 V steel [Citation9].
![Figure 3. Comparison of conventional hyperbolic sine law with experiment [Citation10] for 0·5Cr–0·5Mo–0·25 V steel [Citation9].](/cms/asset/98ef6142-8ea9-431d-aa3e-08eb72545305/ymht_a_1388603_f0003_oc.gif)
Hence, a modified hyperbolic sine law was proposed by the first author and applied in [Citation9], it is given as:
(3.2)
where q is stress exponent.
The modified hyperbolic sine law was successfully applied to both 0·5Cr–0·5Mo–0·25 V steel with material parameters A = 4·12E-8, B = 2·51E-4, and q = 2 in Figure [Citation9] and 2·25Cr–1Mo steel with material parameters A = 5·57E-7, B = 2·4E-4, and q = 2 in Figure [Citation9].
Figure 4. Comparison of modified hyperbolic sine law with the conventional one and experimental data [Citation8] of 0·5Cr–0·5Mo–0·25 V steel [Citation9].
![Figure 4. Comparison of modified hyperbolic sine law with the conventional one and experimental data [Citation8] of 0·5Cr–0·5Mo–0·25 V steel [Citation9].](/cms/asset/eb4fdf61-20ea-41d4-9e51-740cc3d4412c/ymht_a_1388603_f0004_oc.gif)
Figure 5. Comparison of modified hyperbolic sine law with the conventional one and experimental data [Citation10] of 2·25Cr–1Mo steel [Citation9].
![Figure 5. Comparison of modified hyperbolic sine law with the conventional one and experimental data [Citation10] of 2·25Cr–1Mo steel [Citation9].](/cms/asset/156926d3-f589-492a-a28c-4b7b0bc206d5/ymht_a_1388603_f0005_oc.gif)
The application of the modified hyperbolic sine law to high Cr steel
Deficiencies of conventional functions that measure the relationship between minimum creep strain rate and stress are demonstrated below.
The conventional minimum creep strain rate and stress functions were proposed and compiled in Table [Citation14].
Table 2. The typical functions between minimum creep strain rate and stress [Citation14].
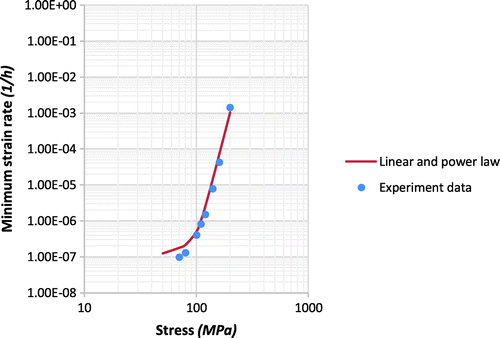
The specific data of minimum creep strain rate for P91 (9Cr–1Mo–V–Nb) for this research was taken from NIMS creep data sheet as shown in Figure . [Citation11].
Figure 6. Experimental data of minimum strain rate and stress at 600 °C under 70–200 MPa for P91 steel [Citation11].
![Figure 6. Experimental data of minimum strain rate and stress at 600 °C under 70–200 MPa for P91 steel [Citation11].](/cms/asset/8d89591c-a37f-41dd-9b1f-d45047324d49/ymht_a_1388603_f0006_oc.gif)
The modelling results of conventional hyperbolic sine law with the calibrated material parameters of A = 4·5E-8, B = 5E-2 [Citation14] and linear power law equation with the calibrated material parameters A = 2·5E-9, B = 1E-22 [Citation14] are re-produced and shown in Figures and . However, the modelling results of conventional hyperbolic sine law and linear power law do not fit well with the experimental data of P91 steel.
Figure 7. The modelling result of conventional hyperbolic sine law compared with experimental data of P91 steel.
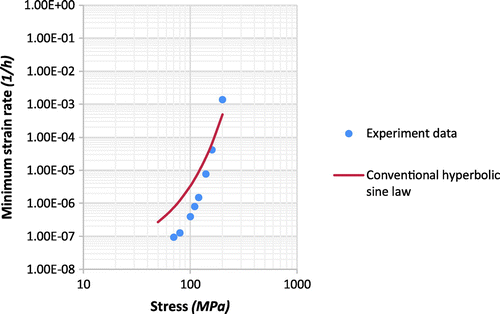
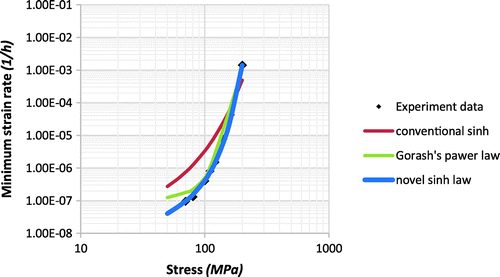
The modified hyperbolic sine law, , is applied to P91 steel. The modelling result is shown in Figure with the calibrated material parameters of A = 6·09867E-7, B = 2·137E-4 and q = 2. As can be observed, a positive agreement was achieved.
Figure 9. The modelling result of modified hyperbolic sine law compared with experimental data for P91 steel.
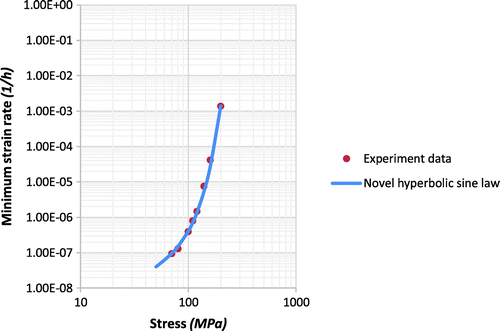
The comparison of the above two functions is shown in Figure .
Results: cavity area fraction along grain boundary based creep fracture criterion for high Cr steel
Functions for cavity area fraction and the cavity size distribution
A generic theory of cavity area fraction along grain boundary was proposed by Riedel [Citation19], and it can be summarised as:
If the non-stationary growth rate of the cavity radius, and the nucleation rate of cavity, J*, are, respectively:
(3.3)
(3.4)
where the unknown constants A1, A2, α, β and γ are material constants.
Then, the cavity size distribution function, represents the number of voids with radii between R and + dR in the time interval t and
, is given as:
(3.5)
Finally, the cavity area fraction, , can be obtained, based on the above three equations [Citation16]:
(3.6)
(3.7)
where the dimensionless factor is a definite integral:
(3.8)
The Equation (3.5) can be converted into the density function of cavity equivalent radius, f(R), and is given as [Citation20]:
(3.9)
To completely calibrate the cavity area fraction along the grain boundaries, Equation (3.7), the material constants ,
,
A1,
need to be found.
Specific values of material constants  ,
,  ,
, 
The physical meaning of these values has been given as:
| (1) | With the value of α = 1, β = 2, the cavity size distribution Equation (3.5) fitted well with experiment of the equivalent diameter against number of cavities [Citation20,21], and it is well known from the literature that the value of β = 1·95 ± 0·05 (closely to 2) is characterised by the constrained diffusional mechanism of void growth [Citation19]; | ||||
| (2) | γ = 1 is characterised for continuum cavity nucleation with cavity constrained growth [Citation19]. | ||||
Further confirmation on the simulation of the value of γ = 1
Determination and proofing of the value of γ is given in this section. The characteristics of the cavity size distribution Equation (3.5) were discussed by Riedel [Citation19], and its shape with γ = 1 is similar to that from the experiment for P91. Additionally, the value of γ = 1 is consistent with constrained diffusion growth and continuums nucleation [Citation19].
This section confirms γ = 1 numerically by comparing predictions with experimental data reported in literature [Citation21]. It is necessary to point out that the actual experimental data is much denser and only a limited number was taken from the graph for comparison.
Firstly, integrating Equation (3.3) yields:
(3.10)
Secondly, using the minimum and maximum cavity diameter of 1·2 and 5·7 μm at 10,200 h, respectively, the values of , A2 and C can be solved with
, β = 2 and given the value
.
Finally, it was found that γ is equal to 1, the theoretical modelling of , and by using the above values, it agrees with the experimental data very well as displayed in Figure . Hence, this confirms that the value of γ is 1.
Figure 11. Probability density function of cavity equivalent R for P91, experimental data from ref [Citation21].
![Figure 11. Probability density function of cavity equivalent R for P91, experimental data from ref [Citation21].](/cms/asset/6dfe28a7-93b1-4bab-9a9e-80f402eb2c07/ymht_a_1388603_f0011_oc.gif)
The application of the cavity area fraction along grain boundary on high Cr steel
Inputting the above obtained values of α = 1, β = 2 and γ = 1 into Equations (3.7) and (3.8), the cavity area fraction of w is expressed as:
(3.11)
Thus,
(3.12)
where .
The cavitation damage equation should be incorporated in the future development of creep damage constitutive equations for high chromium steel, due to its much sounder scientific base than the conventional phenomenological approach.
The trend of creep life time coefficient U′ with stress levels
Rupture is assumed to occur when w reaches its critical vale, wf, and it is assumed to be according to [Citation19]. Hence,
(3.13)
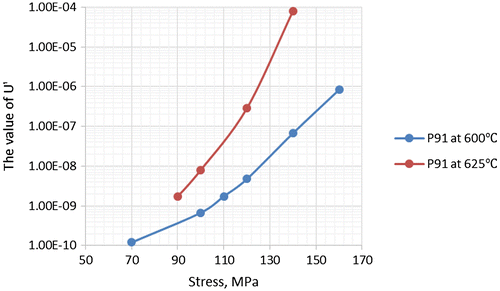
Based on creep data sheets of creep rupture time under different stress levels and temperature on typical ASME Grade 91(9Cr–1Mo–V–Nb) steel [Citation15] in Table , the value of was calculated as shown in Table .
Table 3. The value of U′ for P91 at 600 °C.
Table 4. The value of U′ for P91 at 625 °C.
There is a clear trend that can be observed in Figure , which provides much more stable scientific findings that can be used to convince researchers, than compared to the trend displayed by the value of A in other cavitation damage Equations (1.3) as shown in Figure . This potentially provides a scientifically sound, novel, and rather simple life time prediction method.
The variation between cavity nucleation rate coefficient  and stress
The coefficient A2 in the cavity nucleation rate Equation (3.4) does not change with time, however it might be dependent upon stress and temperature. With , the Equation (3.4) can be converted as:
(3.14)
where is the number density of cavities.
This section investigates the dependency between coefficient A2 and stress.
Fortunately, there is another set of 3D cavity data by X-ray micro-tomography. The number density of cavities at failure for high Cr steel (CB8) under a range of stress levels (120–180 MPa) are available [Citation12]. The relevant data was extracted by reading the published graph and is shown here:
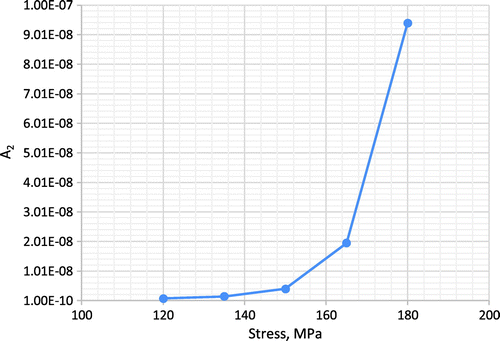
Using the above data in Table , the individual value of A2 at different stress levels is calculated and shown in Table and Figure .
Table 5. The number of cavities at failure under a range of stress levels [Citation12].
Table 6. The relationship between the value of A2 and stress.
It is clear that A2 only reduces slightly with stress below 150 MPa. This is significant as the above trend could be used for extrapolation to lower stress.
Discussion and conclusions
Key conclusions for this research include:
| (1) | A modified sine law for minimum creep strain rate and stress was proposed and used. As can be observed it works well with both low Cr and high Cr steels. Hence it is recommended to be utilised in future creep damage constitutive equations for a wide range of stress situations; | ||||
| (2) | A specific advanced cavity area fraction along grain boundary model related to the cavity nucleation and growth kinetics models was developed/ calibrated based on scientific reasoning and 3D X-ray tomography information for high Cr steel; | ||||
| (3) | The application of cavity area fraction along grain boundary model | ||||
| (4) | The application of the developed/calibrated creep cavity nucleation model gives a scientifically sound and simple cavity nucleation rate dependence of stress. More so, there is a clear trend between creep cavity nucleation coefficient and stress, thus adding to the reliability of this model. | ||||
Suggestions for further work include:
| (1) | To optimize the values for A, B and/or q by using optimization software; | ||||
| (2) | To couple creep deformation and novel cavitation equations in a novel hyperbolic sine law; | ||||
| (3) | To consider | ||||
| Nomenclatures | ||
| σ | = | Applied stress |
| = | Creep strain rate | |
| = | Minimum creep strain rate | |
| = | Creep cavity nucleation rate; | |
| kN | = | Cavitation constant, typically ≤ 1/3 |
| = | Uniaxial strain at fracture | |
| A, B, A′, B′ | = | Material parameters, possibly dependent of temperature |
| n | = | Stress exponent |
| q | = | Stress exponent for minimum creep strain rate |
| R | = | Cavity radius |
| = | Growth rate of the cavity radius | |
| t | = | Time |
| N(R, t) | = | The cavity size distribution function |
| f(R) | = | Probability density function of cavity equivalent radius |
| A1, A2, α, β , γ | = | Material parameter may depend on stress and strain rate |
| = | Cavity nucleation rate | |
| J | = | The number density of cavity |
| w | = | The cavity area fraction along grain boundary |
| wf | = | Critical value of the cavity area fraction at fracture |
| I | = | The dimensionless factor |
| = | Material parameter | |
| wf | = | Critical value of the cavity area fraction at fracture |
| C | = | Integration constant related to the cavity growth rate |
Disclosure statement
No potential conflict of interest was reported by the authors.
Funding
This work was supported by the School of Computing and Engineering; the University of Huddersfield, and the Santander Student Mobility Scholarship.
Acknowledgments
Mr. Xin Yang is grateful for the partial scholarship for PhD research provided by the School of Computing and Engineering at The University of Huddersfield, and the Santander Student Mobility Scholarship.
References
- Lee JS, Armaki HG, Maruyama K, et al. Causes of breakdown of creep strength in 9Cr–1.8 W–0.5Mo–VNb steel. Mater Sci Eng A. 2006;428:270–275.10.1016/j.msea.2006.05.010
- Yin YF, Faulkner RG. Continuum damage mechanics modelling based on simulations of microstructural evolution kinetics. Mater Sci Technol. 2006;22:929–936.10.1179/174328406X102426
- Dyson BF. Use of CDM in materials modelling and component creep life prediction. J Press Vessels Technol. 2000;122:281–296.10.1115/1.556185
- Yang X, Xu Q, Lu ZY. The development and validation of the creep damage constitutive equations for P91 alloy. In: Proceedings of the 2013 World Congress in Computer Science and Computer Engineering and Application. CSREA Press. 2013; p. 121–127. ISBN 1-60132-238-0.
- Basirat M, Shrestha T, Potirniche GP, et al. A study of the creep behavior of modified 9Cr–1Mo steel using continuum-damage modeling. Int J Plast. 2012;37:95–107.10.1016/j.ijplas.2012.04.004
- Xu Q, Yang X, Lu Z. On the development of creep damage constitutive equations, keynote presentation. HIDA-7: Life/defect assessment & failures in high temperature industrial structures; 2015 May 15–17; Portsmouth: Portsmouth University.
- Xu Q, Lu Z, Wang X. Damage modelling: the current state and the latest progress on the development of creep damage constitutive equations for high Cr steels. Mater High Temp. 2017;34(3):229–237. ISSN 0960-3409.10.1080/09603409.2017.1289613
- Cane B. Interrelationship between creep deformation and creep rupture in 2.25 Cr–1Mo steel. Met Sci. 1979;13(5):287–294.10.1179/03063453.1979.11674139
- Xu QH. Development of advanced creep damage constitutive equations for low Cr alloy under long-term service [ doctor thesis]. Huddersfield University; 2016. http://eprints.hud.ac.uk/27858/1/27_AAFinal_thesis_Qihua_Xu_2016_1.pdf.
- Parker J. Creep behaviour of low alloy steel weldments. Int J Press Vessels Pip. 1995;63(1):55–62.10.1016/0308-0161(94)00051-J
- Creep and rupture data of heat resistant steels, National Institute for Materials Science (NIMS). http://smds.nims.go.jp/creep/index_en.html.
- Gupta C, Toda H, Schlacher C, et al. Study of creep cavitation behavior in tempered martensitic steel using synchrotron micro-tomography and serial sectioning techniques. Mater Sci Eng A. 2013;564:525–538.10.1016/j.msea.2012.12.002
- Dyson B, McLean M. Microstructural evolution and its effects on the creep performance of high temperature alloys. In: Strang A, Cawley J, Greenwood GW, editors. Microstructural stability of creep resistant alloys for high temperature plant applications. 1997. p. 371–393.
- Gorash, Y. Development of a creep-damage model for non-isothermal long-term strength analysis of high-temperature components operating in a wide stress range [Doctor thesis], 2008, Zentrum für Ingenieurwissenschaften der Martin-Luther-Universität Halle-Wittenberg verteidigt am 21.07.2008. https://sundoc.bibliothek.uni-halle.de/diss-online/08/08H154/of_index.htm
- Bailey RW. Creep of steel under simple and compound stress. Engineering. 1930;121:129–265.
- Norton FH. The creep of steel at high temperature. New York (NY): McGraw-Hill Book; 1929.
- Naumenko K, Altenbach H. Modelling of creep for structural analysis. Berlin: Springer-Verlag; 2007.10.1007/978-3-540-70839-1
- Naumenko K, Altenbach H, Gorash Y. Creep analysis with a stress range dependent constitutive model. Arch Appl Mech. 2009;79:619–630.10.1007/s00419-008-0287-5
- Riedel H. Fracture at high temperatures. Berlin: Springer Verlag; 1987.10.1007/978-3-642-82961-1
- Sket F, Dzieciol K, Borbely A, et al. Microtomography investigation of damage in E911 steel after long term creep. Mater Sci Eng A. 2010;528:103–111.10.1016/j.msea.2010.07.029
- Renversade L, Ruoff H, Maile K, et al. Microtomographic assessment of damage in P91 and E911 after long-term creep. Int J Mater Res. 2014;105:621–627.10.3139/146.111056


