
 ?Mathematical formulae have been encoded as MathML and are displayed in this HTML version using MathJax in order to improve their display. Uncheck the box to turn MathJax off. This feature requires Javascript. Click on a formula to zoom.
Abstract
Coffee is one of the most important agricultural commodities. Agroforestry systems (AFS) are increasingly used in coffee cultivation because of environmental benefits, adaptability of the systems, and economic profits. However, identifying the spatial distribution of AFS through remote sensing continues to be challenging. The current systematic review focuses on the accuracies obtained and the computational methods and satellite data used in mapping coffee AFS between 2000 and 2020. To facilitate the analysis, we ordered the mapped AFS into five classes according to their density and species composition of shade trees. The Kruskal-Wallis test was applied to evaluate significative differences among classes. Both shade-tree densities and species composition affected the accuracy level. The worst results were obtained in AFS retaining many woody species from the original forest and high tree density (user accuracy 0.5). About the methods, maximum likelihood was the most widely used with very variable results; some non-parametric methods such as CART, ISODATA, RF, SMA, and SVM presented consistently high accuracy (
0.75). High spatial resolution multispectral imagery was suitable for mapping AFS; very few studies were found with radar imagery, so it would be desirable to increase its use combined with optical data.
1. Introduction
Agricultural land cover mapping has advanced significantly in the last decade due to the increased availability of remote sensing data at different spatial resolutions, better algorithms, and increasing computing capabilities for data processing. However, the identification of partially tree-covered land uses using remote sensing data still presents significant challenges, particularly in regions with high agrodiversity and heterogeneous topographic conditions (Philpot Citation2015; Jesus and Kuplich Citation2020; Li et al. Citation2014). It has been observed that topographic heterogeneity, structural complexity of cultivation systems, and the number of vegetation strata influence light reflectance and consequently, radiance scattering (Bense Citation2007). Additionally, the spatial resolution has implications on the pixels’ values, as they can register information from more than one type of land cover, especially in fragmented landscapes (Lamparelli et al. Citation2012). All these considerations make it difficult to characterize spectral patterns and discriminate between different land cover classes or vegetation types. These may also increase uncertainty, particularly in those areas with an approximately similar spectral response (Rizvi et al. Citation2013). High spatial resolution images allow better visual differentiation of vegetation cover or land cover classes, which can reduce confusion in the classification process. However, the availability of this imagery is generally limited to small extensions, with low temporal resolution. In the case of radar images, signals are especially sensitive to surface dielectric properties, and surface component structure influences the backscattering of microwave signals, then the rugged topography of some mountainous crop areas limits the use of radar images (Podest Citation2017). Therefore, agriculture systems under forest cover, also known as agroforestry systems (AFS), are particularly complicated to map through remote sensing data due to the presence of two or more strata of vegetation above the crops and for the topographic conditions. These systems are widely implemented because they provide a variety of socioeconomic and environmental benefits (Borelli et al. Citation2017). For example, the reduction of soil loss and water runoff, they serve as a carbon sink and contribute to biodiversity conservation (Beer et al. Citation2003), in response to the loss caused by the expansion and intensification of agriculture and livestock (Philpott and Bichier Citation2012; Figueroa-Hernández et al. Citation2015).
One of the main agricultural products grown through agroforestry systems is coffee. This system is adapted based on the environmental, cultural, and socioeconomic conditions of the growing areas as well as the needs and technical capacities of coffee growers (Borelli et al. Citation2017). On the other hand, in coffee-growing countries, coffee production represents an important part of the economy and national politics, in some cases is about 80% of the income (Figueroa-Hernández et al. Citation2015). However, mapping these production systems represents a challenge (Hailu et al. Citation2015; Kelley et al. Citation2018). Several studies show that the most frequent classification errors for coffee agroforestry systems correspond to the confusion of disturbed forests with secondary vegetation, and among different types of AFS (Kelley et al. Citation2018; Gomez et al. Citation2010; Tridawati et al. Citation2020).
To reduce uncertainty when creating a map of shade-grown coffee production areas, is common the utilization of auxiliary data, such as digital elevation models, temperature or precipitation maps, which provide complementary information about the conditions of the area. This auxiliary data has been used when spectral data is not enough to discriminate between land cover classes. Due to the specific climate and soil requirements for each type of crop may help as additional context information in the mapping of coffee AFS. Most of the researchers have used as ancillary data texture descriptors, vegetation indices, climatic maps, and digital elevation models (Hunt et al. Citation2020).
Nevertheless, the particularities of each study area and the agroforestry practices implemented in each regions make it difficult to build universal mapping methods, so a review of the state of the art in coffee AFS mapping is critical for defining a discrimination method adjusted to each study area with the least possible uncertainty or confusion. This implies understanding how different remote sensing algorithms and data have responded under specific crop conditions, in order to identify remote sensing data and computational methods to better map different types of agroforestry systems. In this work, an analysis of studies focused on the implementation of computational classifiers in shade-grown coffee cultivation areas was conducted for evaluating the types of classifiers and the information that can be used to have less uncertainty in the resulting maps. This is according to the types of coffee agroforestry systems.
2. Materials and methods
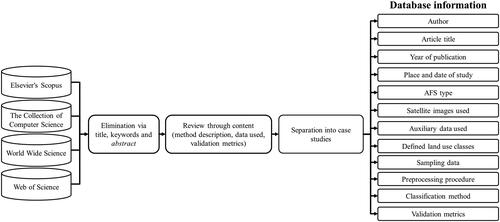
The search was carried out in the Elsevier’ Scopus, the Collection of Computer Science, World Wide Science and Web of Science databases on scientific articles published between 2000 and 2022 focused on mapping coffee agroforestry systems using remotely sensed data through computational methods. The search included articles in Spanish, English and Portuguese languages. Works in Portuguese were included since several of the studies on coffee AFS mapping have been published in Brazilian journals due to Brazil is the largest coffee producer. Works in Spanish were also included for studies that were published in scientific journals from universities in Mexico and Colombia. The search terms used were coffee AND agroforestry OR shade production OR land use OR land cover AND classification OR mapping AND remote sensing OR imagery OR satellite AND accuracy. The papers were selected were chosen according to whether if they reported: (1) fitting models from field data; (2) description of algorithms and remote sensing data used; and (3) at least two validation metrics (overall accuracy and producer’s accuracy for the coffee class) of the resulting classification. In addition, studies that compared the performance between different classification algorithms or that make use of different remote sensing data using the same algorithm were also included. For these cases, each algorithm or implementation variation was considered as an individual case study. Subsequently, a database with the information extracted from each article was created ().
Figure 1. Process of the systematic review of literature for studies of coffee production areas.
As a result of the systematic literature search, 161 articles were chosen. To determine if there are significant differences between the accuracy achieved by different mapping methods and type of agroforestry systems, an analysis of variance was carried out using the Kruskal-Wallis test (McKight and Najab Citation2010), since the samples in most of the studies did not present a normal distribution.
2.1. Definition of coffee agroforestry systems
Moguel and Toledo (Citation1999), taking as a bases the degree of tropical disturbance, they classify agroforestry systems in the following categories: (1) rustic, those systems with a low density of introduced coffee plants in natural vegetation, generally high plant diversity with at least three strata, and canopy coverage greater than 70%; (2) traditional polycultures, where there is a higher density of coffee plants, and species are introduced for exploitation purposes (e.g. fruit trees, medicinal plants, timber), pruning is frequent, two strata are maintained, and canopy coverage is between 40% and 70%; (3) commercial polycultures, defined as intensive coffee production systems, consequently, density is high, associated tree species diversity is low, all species have some exploitation purpose, and canopy coverage is in the range of 30%–40%; (4) finally, shade-grown monocultures are systems where coffee is the only crop, and shade is provided by two or three tree species, regular pruning is applied, and canopy coverage is not greater than 30%.
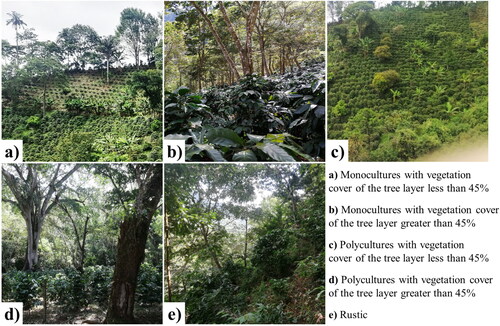
In this review, five types of agroforestry systems were defined based on those proposed by Moguel and Toledo. The objective was to make valid comparisons between the different cases found in the papers used in this. The new classification of coffee AFS have the following categories:
Rustic. Class definition taken from Moguel and Toledo (Citation1999).
Polycultures with vegetation cover of the tree layer greater than 45%.
Polycultures with plant cover of the tree layer less than 45%.
Monocultures with vegetation cover of the tree layer greater than 45%.
Monocultures with plant cover of the tree layer less than 45%.
In , an example of each type of coffee AFS is shown.
Figure 2. Types of coffee agroforestry systems defined for the review.
2.2. Computational approaches used for mapping shade-grown coffee production areas and metrics used for validation
The choice and implementation of classification approaches for mapping shade-grown coffee areas is related to the study objective, available information, and the algorithms’ ability to process input data. In this review, algorithms for mapping coffee agroforestry systems were categorized based on three criteria shown in (Jensen Citation1996; Maurya et al. Citation2021).
Table 1. Classification of AFS mapping approaches.
In the validation phase, usually, a confusion matrix is generated, from which validation metrics are obtained. The most common are commission and omission errors, overall accuracy, user and producer accuracy, and statistics such as the Kappa index, among others. In this systematic review, producer accuracy, user accuracy, and overall accuracy were considered as valid metrics to evaluate the performance of algorithms and the success of AFS mapping.
2.3. Remote sensing data and supplementary information used in the classification
Remote sensing data includes satellite information, manned and unmanned vehicle images. These data present a wide variety of spatial, temporal, radiometric, and spectral resolutions. The selection of images is defined according to user needs, image resolutions and scale. Another important factor to consider is the atmospheric conditions of the study area; in conditions of constant cloudiness, generally present in rain forests, the use of radar images is preferable due to the difficulty of obtaining high-quality data from optical sensors. In this review, sensor data was classified according to the spatial resolution of the images and a category was added for radar images. These groups are shown below:
Low-resolution images (
20 m).
Medium-resolution images (5–20 m).
High-resolution images (
Radar images.
In coffee AFS mapping, complementary data is frequently used to improve accuracy or to address limitations of remote sensing data due to atmospheric conditions and considering type of analysis, for example, temporal crop change analysis, land use classification, among others. For this review, the complementary data found was grouped into the following categories:
Land use maps.
Soil type maps.
Topographic maps, DEM, relief maps.
Other maps.
Statistical data, producer interviews, and field information.
Texture descriptors.
Vegetation indices.
3. Results
In the literature search, 61% of the studies were located in Brazil, 8% in Colombia, and the rest in 13 other countries. The total number of studies per country is shown in . It was found that 45% of the studies focused on the identification of agroforestry systems, 44% on spatially separating two types of systems, such as monocultures with different percentages of shade, and 11% on classifying three or more coffee AFS. When considering only the type of agroforestry system, polycultures were the most addressed systems, while rustic systems were the least analyzed. shows the total number of case studies for each type of coffee agroforestry system. Also, some studies apply different mapping approaches to the same study area or use the same algorithm for different regions. These studies were considered in more than one category.
Figure 3. Map of the studies selected by country.
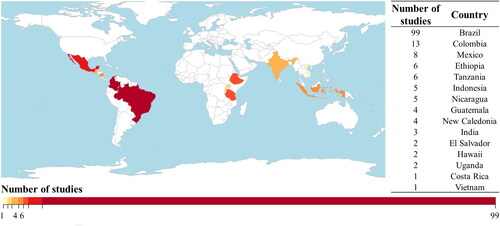
Table 2. Case studies by type of AFS found.
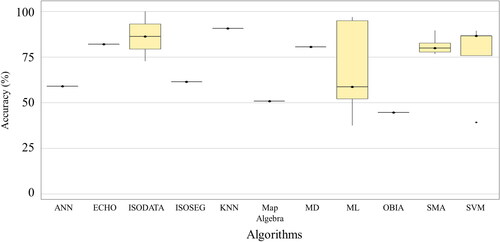
The case studies classified for the type of algorithms used are shown in , and the algorithms identified in the systematic review are shown in . The Map Algebra category considered classifications carried out through visual interpretation assisted by tools included in GIS software such as ArcMap, QGIS, among others.
Figure 4. Algorithms identified for the classification of coffee agroforestry systems. ML = Maximum likelihood; RF = Random Forest; KNN = K-Nearest neighbor; CART = classification and regression tree; SMA = Spectral Mixture Analysis; ANN = artificial neuronal network; ISOSEG = per-field clustering classifier; OBIA = object-based Image Analysis; SVM = Support Vector Machine; LMNL = Multinomial Logit; ISODATA = iterative Self-Organizing data Analysis; ECHO = extraction and classification of homogeneous objects; MD = Minimum distance.
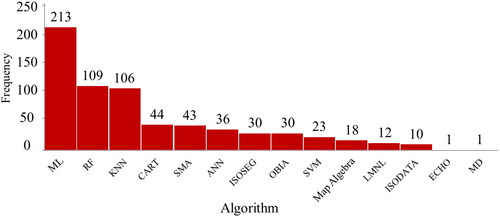
Table 3. Case studies by type of mapping approaches.
The satellite images used in mapping AFS, classified by spatial resolution and sensor, are shown in . Landsat series images were the most used, probably due to high availability, temporal resolution, and no cost to the user.
Table 4. Frequency of identified satellite images.
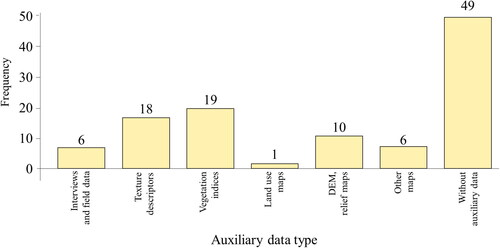
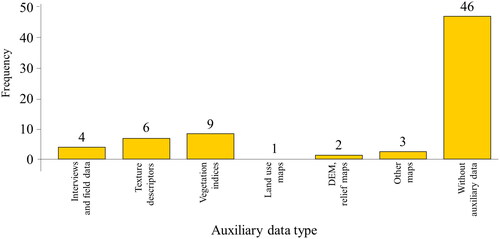
The auxiliary data identified is shown in . This data included information derived from satellite images and aerial photographs, such as vegetation indices and texture descriptors, thematic maps and topographic data. The category of other maps includes precipitation maps, temperature maps, political boundaries, among others. In all cases where vegetation indices were used, NDVI was the most calculated, although in 44% of cases, it was combined with other indices.
Table 5. Auxiliary data used in case studies.
In the process of selection of case studies, we found that around 100 papers did not report values of accuracy by class or overall accuracy, so they were discarded. Additionally, many of the studies do not clearly report the process of defining training and validation datasets, so it is not possible to know if there are a sampling lacking independence and statistical robustness in obtaining the confusion matrix and validation metrics. Likewise, most case studies do not adjust the area by class, according to recommendations of Olofsson et al. (Citation2013, Citation2014), which would avoid bias in mapping. shows case studies classified by validation process validation metrics.
Table 6. Case studies classified by reported accuracy evaluation metrics.
For each type of AFS, the producer, user, and overall accuracies are shown in . The rustic system was the least addressed and had the lowest accuracy values. For polycultures, reported accuracy values varied less between case studies, and very similar user and producer accuracies were obtained for both types of polycultures. Monocultures with shade coverage less than 45% show higher accuracy values (median user accuracy was approximately 75%) compared to monocultures with a higher percentage of shade (median user accuracy was approximately 70%).
Figure 5. Distribution of accuracies reported by type of agroforestry system. (a) Global accuracy, (b) producer accuracy and (c) user accuracy.
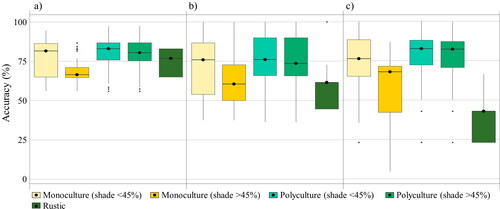
shows the results of the Kruskal-Wallis test for all types of agroforestry systems. Coffee AFS with similar forest coverage do not show significant differences, while significant differences are observed between types of AFS with low coverage and coverage greater than 45%, whether monocultures, polycultures, or rustic systems.
Table 7. Analysis of variance by type of AFS and producer accuracy reported.
Monocultures (shade 45%) have been mostly analyzed through supervised classification algorithms, mainly Random Forest (RF), K-nearest neighbor (KNN), and Support Vector Machine (SVM). However, Object-Based Image Analysis (OBIA) and unsupervised classification methods such as ISOSEG and showed lower mean uncertainty and lower variation between reported producer accuracy values among studies, as shown in .
Figure 6. Producer accuracy for mapping shaded monocultures (shade 45%) by algorithm.
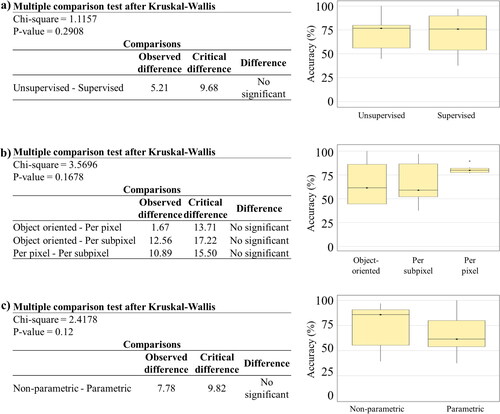
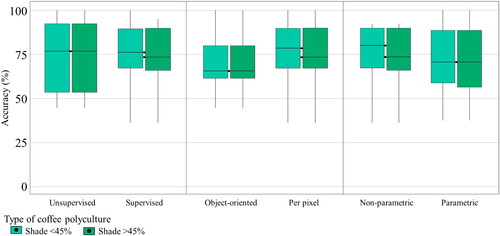
shows that there are no significant differences in the approaches used to map this type of monoculture. The use of supervised and unsupervised methods does not show significant differences in the accuracies reported (). However, the analysis shows a much higher average accuracy for non-parametric algorithms than for parametric algorithms (), although they require more data for training and are computationally more expensive.
Figure 7. Analysis of variance and producer accuracy by (a) whether it use training data, (b) analysis unit and (c) whether it use statistical parameters for mapping monocultures (shade 45%).
For the mapping of these monocultures, the use of Landsat, IKONOS, and SPOT-5 sensors showed similar accuracy values with the use of algorithms such as Maximum Likelihood (ML) or Random Forest (RF), indicating that the spectral resolution of medium-resolution images can be an effective alternative for mapping monocultures when high-resolution images are not available (). Most of the case studies did not use auxiliary information (). However, analyzing those studies where complementary data is incorporated there is significant influence on mapping monoculture systems, according to validation metrics reported.
Figure 8. Producer accuracy for mapping shaded monocultures (shade 45%) by sensor type.
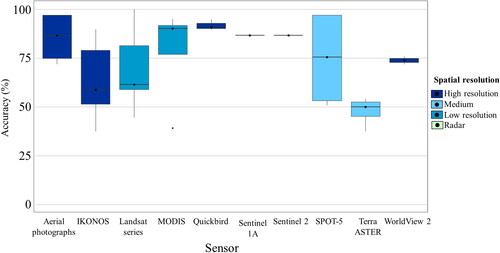
Figure 9. Auxiliary information used for the classification of monocultures (shade 45%).
On the other hand, shows that there is no significant difference in the use of medium spatial resolution images compared to low- or high-resolution images, suggesting high-resolution images could be replaced with medium- or low-resolution images and get similar results.
Table 8. Analysis of variance by spatial resolution and producer accuracy achieved for mapping of monocultures (shade 45%).
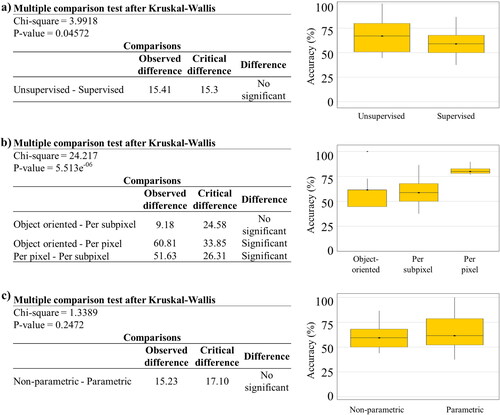
In the analysis of monocultures with vegetation coverage greater than 45%, unsupervised classification showed higher producer accuracy than supervised methods. Spectral Mixture Analysis (SMA) algorithms reported the highest performance in unsupervised classifications, and ML for the supervised category, as shown in . However, the object-based analysis approach had lower uncertainty, as did monocultures with low shade (). The images used in both cases correspond to Landsat sensor images and high-resolution IKONOS images. shows a significant difference between supervised and unsupervised classification algorithms, although the producer accuracy means are very similar. The results shown in suggest that the sub-pixel analysis approach is more successful in mapping monocultures with coverage greater than 45% with a significant difference from the object and pixel approaches, resulting in a considerably higher producer accuracy mean than the other two approaches.
Figure 10. Reported producer accuracy for coffee monoculture (shade 45%) by algorithm type.
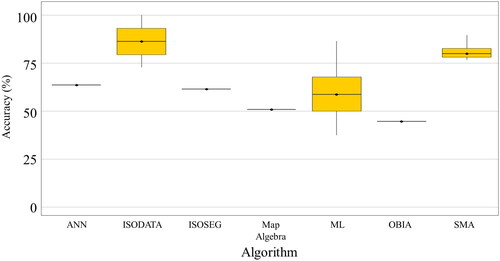
Figure 11. Analysis of variance and producer accuracy by a) type of classification, b) analysis unit and c) whether it use statistical parameters for mapping coffee monocultures (shade 45%).
In some case studies where shade monocultures were analyzed, radar information from the Radarsat sensor was used, but it did not show a significant increase in mapping accuracy compared to studies that did not use radar data (). In the analysis of variance for the use of optical and radar images, no significant differences were found between the types of images used, which is consistent with mapping monocultures with lower coverage, where the range of error is not dependent on the type of images or their spatial resolution, as shown in . According to the reported accuracies, for mapping these systems, the temporal resolution, that is, the analysis through changes in the spectral profiles, has a greater influence on mapping accuracy.
Figure 12. Reported producer accuracy for monocultures (shade 45%) by sensor type.
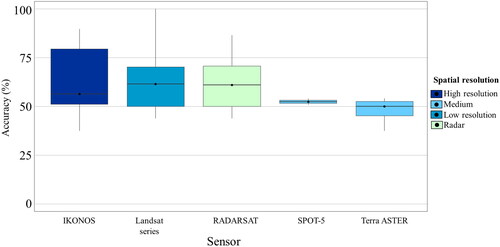
Table 9. Analysis of variance by spatial resolution of the images used and produces accuracy achieved for monocultures (shade 45%).
On the other hand, incorporating digital elevation models into pixel-based analysis algorithms yielded similar commission and omission errors, also the mean accuracy values reported for the classification of vegetated monocultures did not show a significant variation when using this additional data or only satellite images ().
Figure 13. Auxiliary information used for the classification of monocultures (shade 45%).
For monocultures or coffee AFS in highly perturbed areas, the results reported suggest that high-resolution images provide significant information to increase classification accuracy, but using vegetation indices as an auxiliary to low-resolution images through object segmentation algorithms can perform better than using high-resolution images. In the analysis of polycultures, it was found that the mapping error range increases with the percentage of shade, although the difference is not significant. Additionally, a high range of variation was observed between reported accuracies for different algorithms, compared to mapping monocultures (). Although a higher average producer accuracy value was observed for the Latent Multinomial Logit (LMNL) algorithm as an unsupervised classification method and the ML algorithm for supervised classifications ().
Figure 14. Distribution of producer accuracy values reported for polyculture mapping by algorithm.
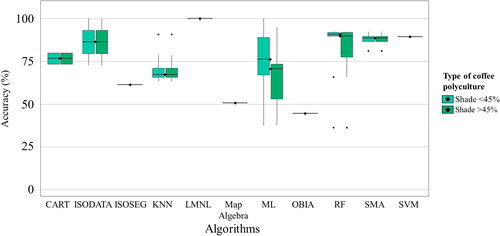
Figure 15. Distribution of producer accuracy values reported for polyculture mapping by algorithm type: a) by supervised or unsupervised classification, b) by analysis unit, and c) whether it is possible to adjust algorithm parameters.
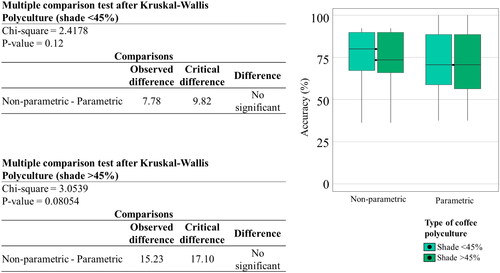
The Kruskal-Wallis analysis did not show a significant difference between supervised and unsupervised classifications () or the use of parametric and non-parametric algorithms () for both types of polycultures. However, the different approaches () for polycultures with a coverage greater than 45% does show a significant difference. The pixel-based analysis showed a higher producer accuracy mean than the object-based approach for polycultures with higher coverage. However, the analysis showed little variation between both types of polyculture, although the mean accuracy for less technified systems was distinctly lower ().
Figure 16. Kruskal-Wallis analysis of variance for supervised and unsupervised classification for mapping polycultures with different shade coverage percentages.

Figure 17. Kruskal-Wallis analysis of variance for object-oriented and per-pixel classifications for mapping polycultures with different shade coverage percentages.
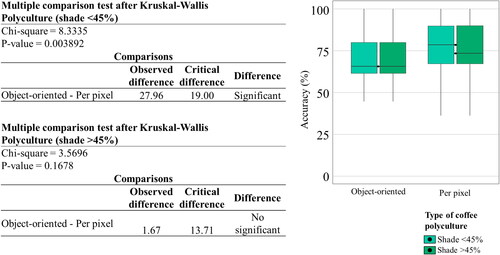
Figure 18. Kruskal-Wallis analysis of variance for parametric and non-parametric algorithms for mapping polycultures with different shade coverage percentages.
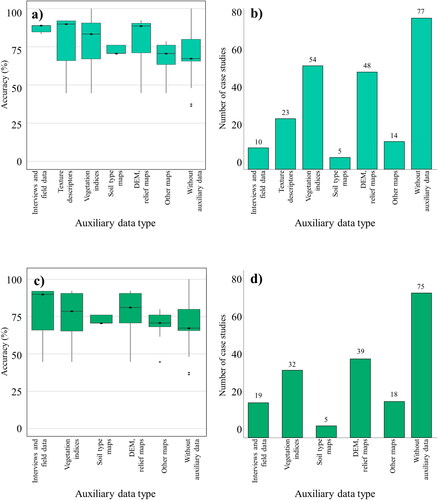
For this type of AFS, a greater use of Landsat sensor images was found. The combination of imagery previously defined as low-resolution images with high-resolution images showed the highest accuracy values, compared to using only high-resolution images. Similarly, for monocultures, information in different spectral bands contributes more to classification performance than spatial resolution (). Additional data used for case studies with lower reported error rates were topographic information (slope, elevation, among others) and information on vegetation in the study areas, such as vegetation indices and land use maps, as shown in .
Figure 19. Producer accuracy reported for polycultures by sensor type.
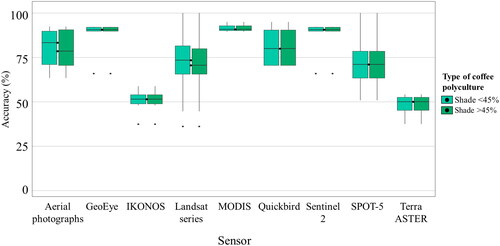
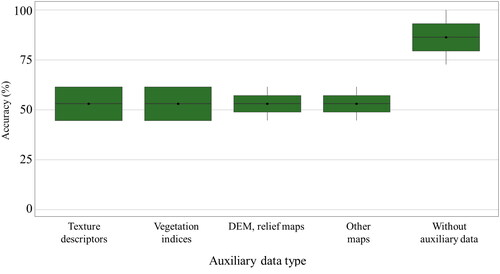
Figure 20. (a) Producer accuracy reported by type of auxiliary data used and (b) number of case studies by type of auxiliary data used for polycultures (shade 45%); and (c) global accuracy reported by type of auxiliary data used and (d) number of case studies by type of auxiliary data used for polycultures (shade
45%).
Rustic systems were the least addressed, less than 5% of all reviewed studies. Most of the cases analyzed reported user accuracies below 50% (). Minimum pruning forest coverage and heterogeneous distribution of coffee plants made it difficult to identify these AFS. Therefore, different approaches from traditional methods are used for the classification of rustic systems. The use of rule-based algorithms, image segmentation and OBIA approaches through algorithms included in GIS analysis software were the only reported, as shown in .
Figure 21. Producer accuracy reported for mapping of rustic systems by a) algorithm, b) by supervised or unsupervised classification, c) by analysis unit and d) whether it is possible to adjust algorithm parameters.
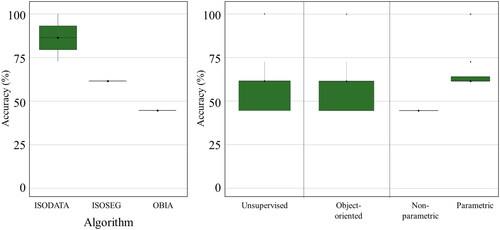
The analysis of variance for rustic agroforestry systems was developed only between parametric and non-parametric algorithms, which showed significant differences (). The mean producer accuracy between the two types of algorithms also differs considerably. Mapping through non-parametric algorithms showed a higher mean producer accuracy; because non-parametric algorithms do not assume a specific model, there is greater range of adjustment, generating a higher performance, i. e., more accurate results compared to algorithms with previously established parameters.
Table 10. Analysis of variance of parametric and non-parametric algorithms and producer accuracy reported for mapping of rustic AFS mapping.
In all reviewed studies, Landsat sensor images are used, with 50% of cases using auxiliary information from digital elevation models. The highest reported accuracies were reported using ISODATA algorithms that combine Landsat images with topographic data. However, the use of complementary data did not show a lower range of error, according to reported studies ().
Figure 22. Producer accuracy for mapping rustic systems by type of auxiliary data used.
The systematic review showed pixel-based analysis through supervised classification algorithms was the most used method, with two main approaches: the use of high spatial resolution images and the multispectral analysis of low- and medium-resolution images. The use of high-resolution images had relative success in mapping areas with little forest cover or with a well-defined spatial distribution, i.e. with alleys between crops, spatial separation between types of vegetation and types of crops. Multispectral approach, on the other hand, had acceptable success for all types of AFS addressed in this review, although it requires greater knowledge of the ecosystems studied. The ML algorithm is the most used along with RF, where commission and omission errors are low, but performance for global classification was lower than unsupervised classifications. Despite acceptable accuracies were obtained through unsupervised classification methods, since 2015, the use of these approaches has not been reported. In the last 5 years, there has been an increase in the use of machine learning methods (SVM, RF, and kNN).
On the other hand, the object-based approach showed high performance for detecting monocultures and polycultures with low forest coverage, but the highest producer accuracy values (above 85%) were obtained through the use of high-resolution images. For mapping coffee AFS, the use of high spatial resolution images does not seem to have a significant improvement compared to the use of images with higher spectral resolution. This is mainly more noticeable in coffee crops with lower degrees of anthropization. According to the different cases studied, the use of visible and infrared bands seems to generate better separability of agroforestry systems. The reported accuracy of algorithm that used Sentinel 2 image is similar to Landsat and presents a smaller range of variation between studies.
4. Discussion
The comparison of accuracy levels obtained in mapping coffee AFS was a complex task due to their high variability, with factors such as shade tree density, canopy species composition, and topographic and environmental conditions contributing significantly to this heterogeneity. In this sense, assigning each AFS studied in the reviewed articles to one of the five proposed AFS classes allowed the detection of several common patterns that could not have been identified otherwise. The results showed that by increasing the forest density over the coffee crop, the mapping accuracy decreases since the confusion with areas of secondary forest, forest plantations or other shade-grown crops is greater. The use of high spatial resolution images is desirable when available for coffee AFS mapping.
For monocultures with little forest cover (45%), the use of aerial photographs and images from the Quickbird sensor showed a significant increase in classification accuracy (Gomez et al. Citation2010; Hailu et al. Citation2015). The cases of study reviewed suggest that the spatial organization of crop polygons and alleys are the attributes that allow its differentiation with other types of vegetation for low tree density coffee production areas. For systems with high tree density, whether monocultures, polycultures, or rustic systems, the analyzed studies do not show a significant difference in the use of high- or low-spatial resolution images. However, incorporating information from different ranges of the electromagnetic spectrum and different phases of the phenological cycle contributes to obtaining acceptable accuracies in the study of systems with greater forest cover (Kelley et al. Citation2018; Tridawati et al. Citation2020; Ortega-Huerta et al. Citation2012).
For mapping monocultures with little shade, there was no significant difference in the types of algorithms used, according to the Kruskal-Wallis test. However, greater precision is observable in the use of non-parametric algorithms under the pixel analysis approach, which is why the use of high spatial resolution images is key. The processing of multiple bands of the electromagnetic spectrum through robust learning algorithms such as Random Forest or SVM improves the accuracy in mapping systems with a greater tree cover because it allows a better highlight of the intrinsic attributes of plants related to the greenness and vigor of the agricultural areas (Baloloy et al. Citation2020). Furthermore, according to the Kruskal-Wallis test, the unit of analysis and the type of learning (supervised or unsupervised) do not present significant advantages over each other for monocultures with high tree density and polycultures. Thus, in the use of non-parametric algorithms for AFS mapping, spectral resolution should be considered elementary to obtain acceptable accuracies.
Although the use of auxiliary information to satellite images, mainly topographic data, increases the overall accuracy of classifications, the producer and user accuracy for monocultures and polycultures with little forest coverage do not show improvements compared to classifications that do not use auxiliary data. On the other hand, for polycultures (shade 45%) and rustic systems, the highest per-class accuracies were obtained by incorporating vegetation indices derived from low-resolution and high-resolution images, such as NDVI and MSAVI, with robust non-parametric algorithms like Random Forest. This is because the phenological changes of coffee affects the concentrations of chlorophyll a and b and the leaf area index (Marín-Garza et al. Citation2018; Castañeda-Castro Citation2018), cause changes in the spectral patterns of coffee areas, which are reflected in the optical images and the variability of vegetation index values, as shown in Júnior et al. (Citation2013) and Bernardes et al. (Citation2012). Moreover, several studies have addressed the variability of the coffee spectral response over the infrared range of the electromagnetic spectrum in relation to fruit ripening, which has provided a better identification of AFS (Escobar-López et al. Citation2022; Nogueira Martins et al. Citation2021). The use of multispectral images and non-parametric algorithms seems to provide better identification of coffee AFS with high tree density.
Hyperspectral images could contribute significantly to the mapping of complex agroforestry systems (Sharma et al. Citation2022), however, no studies were found in the review that made use of these images.
Radar images were rarely addressed in the studies included in this review. Only radar data in the C Band were used in the selected case studies. Because the SAR signal penetrates the first levels of vegetation, it is useful in mapping coffee AFS with little canopy or with a structure of only one level of shade trees, such as monocultures.
The rustic system is one of the most critical coffee Agroforestry Systems (AFS) in terms of the biodiversity it harbors. This system contains a high density of shade trees, and its woody species are usually native to the region’s forests. This type of AFS is often found in forested areas with high topographic heterogeneity. Unfortunately, due to these characteristics, it has been little studied using remote sensing, and the accuracies values obtained in the reviewed works have been very low (0.5). In that sense, mapping these AFS still represents a challenge.
The analyzed studies described important common challenges such as access to crop areas for information gathering, topographic and climatic conditions (as obstacles for signals from optical and radar sensors) and changes in spectral patterns throughout the phenological cycle. To address these challenges, the proposed future perspectives focus on using a more diverse range of multi-temporal datasets to improve classification approaches in complex forest and agroforestry landscapes, exploring more multi-scale fusion strategies to further improve coffee crop recognition and address the problem of training imbalanced data sets due to lack of field data.
Finally, the structural characteristics of agroforestry systems are adapted to different variables, including the environmental conditions of the growing areas. However, these conditions also vary considerably from one study area to another. For this review, it was considered that each type of agroforestry system is implemented on similar topographic and vegetation characteristics that do not impact mapping accuracy along with the same types of AFS. Future studies could address the physical characteristics of the crop areas for the same type of agroforestry system to identify the impact in the mapping process.
Also, the comparative analysis was carried out only between the types of algorithms defined in this review. Future reviews could consider an analysis that also incorporates the type of satellite images by spatial resolution or topographic characteristics of the study area along with the type of algorithm.
5. Conclusion
Studies show that the increase in tree density in coffee AFS produces a decrease in the accuracy of the identification of these systems. When the tree cover is greater than 45%, confusion occurs mainly with secondary vegetation and with other types of agroforestry systems. In mapping monocultures with little shade (45% coverage) better results were observed using high-resolution images like aerial photographs or multispectral images, where different bands are used for classification. The use of different algorithms did not show a significant difference for the identification of these types of monocultures. In contrast, in systems with a tree cover greater than
45%, the use of non-parametric algorithms that use pixels as the unit of analysis showed better accuracy in classification, regardless of the type of images used. For the identification of polycultures, the increase in tree density also generates confusion, however, it is not as significant as in monocultures. Robust non-parametric algorithms such as SVM or RF perform better and show notably less variation among different cases of studies. On the other hand, there is a better classification when multispectral images are used regardless of the resolution. The incorporation of multiple bands improves the performance of these algorithms and generates less confusion with other classes of vegetation or crops. In the case of rustic systems, it is necessary to expand the mapping work using different algorithms and remote sensing information. In the identification of coffee agroforestry systems, future analysis perspectives could focus on the incorporation of long wavelength SAR information that have been used very little for coffee mapping or the use of hybrid classification models, that is, the combination of optical multiespectral data from different sources and radar images with complementary information such as texture descriptors.
Author contributions
Conceptualization: M.A. C-S, A. E-L; methodology: A. E-L, M.A. C-S; validation: M.A. C-S, A. E-L, J.L. H-S, J.F. M, J.O. L-M; formal analysis: A. E-L; investigation: A. E-L, M.A. C-S; Resources: M.A. C-S, A. E-L, J.L. H-S, J.F. M, J.O. L-M; writing-original draft preparation: A. E-L; writing-review and editing: M.A. C-S, J.L. H-S, J.F. M, J.O. L-M; supervision: M.A. C-S. All authors have read and agreed to the published version of the manuscript.
Acknowledgements
We want to thank to colleagues M. C. Laura Mónica Hernández Huerta and Roberto De Jesús Dominguez Vera from the Departamento de Observación y Estudio de la Tierra, la Atmósfera y el Océano in ECOSUR. We also wish to thank two anonymous reviewers whose comments enriched this manuscript.
Disclosure statement
The authors declare no conflict of interest.
Additional information
Funding
References
- Baloloy AB, Blanco AC, Ana RRCS, Nadaoka K. 2020. Development and application of a new mangrove vegetation index (MVI) for rapid and accurate mangrove mapping. ISPRS J Photogramm Remote Sens. 166:95–117. https://www.sciencedirect.com/science/article/pii/S0924271620301519. doi: 10.1016/j.isprsjprs.2020.06.001.
- Beer J, Harvey C, Ibrahim M, Harmaand JM, Somarriba E, Jiménez F. 2003. Servicios ambientales de los sistemas agroforestales. Agroforestería en las América. 10(37–28):80–87.
- Bense T. 2007. Procesamiento de las imágenes satelitales. In: Sextas Jornadas de Educación en Percepción Remota en el Ámbito Del Mercosur.
- Bernardes T, Moreira MA, Adami M, Giarolla A, Rudorff BFT. 2012. Monitoring biennial bearing effect on coffee yield using MODIS remote sensing imagery. Remote Sens. 4(9):2492–2509. http://www.mdpi.com/2072-4292/4/9/2492. doi: 10.3390/rs4092492.
- Borelli S, Conigliaro M, Olivier E. 2017. Agroforesteria para la restauración del paisaje: explorando el potencial de la agroforesteria para mejorar la sostenibilidad y la resiliencia de los paisajes degradados. FAO.
- Castañeda-Castro O. 2018. Variaciones en Área Foliar y Concentraciones de Clorofilas y Nutrimentos Esenciales en Hojas de Café Robusta (Coffea Canephora P.) Durante un Ciclo Anual. Agro Productividad. 11(4):36–41.http://www.revista-agroproductividad.org/index.php/agroproductividad/article/view/266. doi: 10.32854/agrop.v11i4.266.
- Escobar-López A, Castillo-Santiago MA, Hernández-Stefanoni JL, Mas JF, López Martínez JO. 2022. Identifying coffee agroforestry system types using multitemporal sentinel-2 data and auxiliary information. Remote Sens. 14(16):3847. doi: 10.3390/rs14163847.
- Figueroa-Hernández E, Pérez-Soto F, Godínez-Montoya L. 2015. La producción y el consumo del café. Spain: ECORFAN, p. 182.
- Gomez C, Mangeas M, Petit M, Corbane C, Hamon P, Hamon S, De Kochko A, Le Pierres D, Poncet V, Despinoy M. 2010. Use of high-resolution satellite imagery in an integrated model to predict the distribution of shade coffee tree hybrid zones. Remote Sens Environ. 114(11):2731–2744. doi: 10.1016/j.rse.2010.06.007.
- Hailu BT, Maeda EE, Pellikka P, Pfeifer M. 2015. Identifying potential areas of understorey coffee in Ethiopia’s highlands using predictive modelling. Int J Remote Sens. 36(11):2898–2919. doi: 10.1080/01431161.2015.1051631.
- Hunt DA, Tabor K, Hewson JH, Wood MA, Reymondin L, Koenig K, Schmitt-Harsh M, Follett F. 2020. Review of remote sensing methods to map coffee production systems. Remote Sens. 12(12):2041. https://www.mdpi.com/2072-4292/12/12/2041. doi: 10.3390/rs12122041.
- Jensen J. 1996. Introductory digital image processing. Upper Saddle River: prentice Hall
- Jesus J, Kuplich TM. 2020. Applications of SAR data to estimate forest biophysical variables in Brazil. CERNE. 26(1):88–97. http://www.scielo.br/scielo.php?script=sci_arttext&pid=S0104-77602020000100088&tlng=en. doi: 10.1590/01047760202026012656.
- Júnior AFC, de Carvalho Júnior OA, de Souza Martins O, Guerra AF. 2013. Phenological characterization of coffee crop (Coffea arabica L.) from MODIS time series. Rev Bras Geof. 31(4):569–578. doi: 10.22564/rbgf.v31i4.338.
- Kelley LC, Pitcher L, Bacon C. 2018. Using google earth engine to map complex shade-grown coffee landscapes in Northern Nicaragua. Remote Sens. 10(6):952. http://www.mdpi.com/2072-4292/10/6/952. doi: 10.3390/rs10060952.
- Lamparelli RAC, Johann JA, Santos É, Esquerdo JCDM, Rocha JV. 2012. Use of data mining and spectral profiles to differentiate condition after harvest of coffee plants. Eng Agríc. 32(1):184–196. http://www.scielo.br/scielo.php?script=sci_arttext&pid=S0100-69162012000100019&lng=en&tlng=en. doi: 10.1590/S0100-69162012000100019.
- Li M, Zang S, Zhang B, Li S, Wu C. 2014. A review of remote sensing image classification techniques: the role of spatio-contextual information. Eur J Remote Sens. 47(1):389–411. doi: 10.5721/EuJRS20144723.
- Marín-Garza T, Gómez-Merino FC, Aguilar-Rivera N, Murguía-González J, Trejo-Téllez LI, Pastelín-Solano MC, Castañeda-Castro O. 2018. Composición Bioactiva De Hojas De Café Durante Un Ciclo Anual. RevFitotecMex. 41(4):365–372. http://167.172.243.173:80/index.php/RFM/article/view/121. doi: 10.35196/rfm.2018.4.365-372.
- Maurya K, Mahajan S, Chaube N. 2021. Remote sensing techniques: mapping and monitoring of mangrove ecosystem - a review. Complex Intell Syst. 7(6):2797–2818. doi: 10.1007/s40747-021-00457-z.
- McKight PE, Najab J. 2010. Kruskal-wallis test. The corsini encyclopedia of psychology. Hoboken, NJ: Wiley; p. 1.
- Moguel P, Toledo V. 1999. Biodiversity conservation in traditional coffee systems of Mexico. Conserv Biol. 13(1):11–21. doi: 10.1046/j.1523-1739.1999.97153.x.
- Nogueira Martins R, de Carvalho Pinto F, Marçal de Queiroz D, Magalhães Valente DS, Fim Rosas JT. 2021. A novel vegetation index for coffee ripeness monitoring using aerial imagery. Remote Sens. 13(2):263. doi: 10.3390/rs13020263.
- Olofsson P, Foody GM, Herold M, Stehman SV, Woodcock CE, Wulder MA. 2014. Good practices for estimating area and assessing accuracy of land change. Remote Sens Environ. 148:42–57. https://linkinghub.elsevier.com/retrieve/pii/S0034425714000704. doi: 10.1016/j.rse.2014.02.015.
- Olofsson P, Foody GM, Stehman SV, Woodcock CE. 2013. Making better use of accuracy data in land change studies: estimating accuracy and area and quantifying uncertainty using stratified estimation. Remote Sens Environ. 129:122–131. https://linkinghub.elsevier.com/retrieve/pii/S0034425712004191. doi: 10.1016/j.rse.2012.10.031.
- Ortega-Huerta MA, Komar O, Price KP, Ventura HJ. 2012. Mapping coffee plantations with Landsat imagery: an example from El Salvador. Int J Remote Sens. 33(1):220–242. doi: 10.1080/01431161.2011.591442.
- Philpot W. 2015. Remote sensing fundamentals. Report No.
- Philpott SM, Bichier P. 2012. Effects of shade tree removal on birds in coffee agroecosystems in Chiapas, Mexico. Agric Ecosyst Environ. 149:171–180. https://linkinghub.elsevier.com/retrieve/pii/S0167880911000533. doi: 10.1016/j.agee.2011.02.015.
- Podest E. 2017. Basics of Synthetic Aperture Radar (SAR). p. 1–56.
- Rizvi RH, Dhyani SK, Newaj SR, Karmakar PS. 2013. Mapping extent of agroforestry area through remote sensing: issues, estimates and methodology. Indian J Agrofor. 15(2):26–30.
- Sharma P, Bhardwaj DR, Singh MK, Nigam R, Pala NA, Kumar A, Verma K, Kumar D, Thakur P. 2022. Geospatial technology in agroforestry: status, prospects, and constraints. Environ Sci Pollut Res Int. 30(55):116459–116487. doi: 10.1007/s11356-022-20305-y.
- Tridawati A, Wikantika K, Susantoro TM, Harto AB, Darmawan S, Yayusman LF, Ghazali MF. 2020. Mapping the distribution of coffee plantations from multi-resolution, multi-temporal, and multi-sensor data using a random forest algorithm. Remote Sens. 12(23):3933. https://www.mdpi.com/2072-4292/12/23/3933. doi: 10.3390/rs12233933.