
 ?Mathematical formulae have been encoded as MathML and are displayed in this HTML version using MathJax in order to improve their display. Uncheck the box to turn MathJax off. This feature requires Javascript. Click on a formula to zoom.
Abstract
Waluyo G, Laksono FXAT, Zaenurrohman JA, Mishra M, Piranti AS, Kovács J. 2024. Sediment dredging assessment of the Mrica Banjarnegara hydroelectric reservoir based on technical and economic aspects. Lake Reserv Manage. XX:XXX–XXX.
The Mrica Dam, built in Banjarnegara Regency, Indonesia, in 1988, was designed to have a usable life of 50 yr. However, the current life span is estimated to be less than 50 yr due to a decrease in the dam’s capacity. This dam is facing a significant challenge in the form of intensive sedimentation, resulting in siltation issues. Active measures such as dredging efforts and catchment area management have been initiated to address this problem and prolong the dam’s durability. Consequently, a comprehensive technical and economic analysis is imperative to gauge the efficacy of the dredging program. The engineering aspect of the study focused on sedimentation dispersal patterns and the identification of suitable dredging methods to combat the sedimentation problem effectively. Meanwhile, the economic review factored in both the cost of dredging operations and the profits derived from the sale of sedimentation materials. The findings from our assessment reveal the existence of 17 lucrative spoil banks, yielding an average annual gain of USD 118,575. However, it is crucial to note that dredging the foreset slope costs USD 1.65 million per year. Optimally, the most effective and efficient dredging initiatives should commence at the foreset slope and extend upstream of the dam. A strategically positioned disposal area has been designated south of the dredging location to facilitate the mobilization of dredged products. In conclusion, our analysis indicates that the cost incurred by the company for dredging the dam exceeds the profit generated from the sale of sedimentation materials.
Sediment accumulation in reservoirs is an important issue as it relates to the continued function of dams as power plants, clean water sources, flood control, and agricultural irrigation sources (Wang and Hu Citation2009, Miranda et al. Citation2021). Intensive sedimentation leads to the degradation of water storage capacity and shortens the life span of dams (Mulu and Dwarakish Citation2015, Mohammad et al. Citation2016). This issue is common in many dams around the world, such as the siltation of the Three Gorges Reservoir in China, the Mauvoisin Dam in Switzerland, the Aswan Dam in Egypt, the Mujib Dam in Jordan, the Mosul Dam in Iraq, the Shihmen Dam in Taiwan, and the Cancano and Valgrosina reservoirs in Italy (Shalash Citation1982, Ijam and Al-Mahamid Citation2012, Wang and Kondolf Citation2014, Issa et al. Citation2015, Schleiss et al. Citation2016, Espa et al. Citation2019, Ren et al. Citation2021). Hence, there is a need for studies addressing sedimentation management in dams, with a particular focus on financial efficiency and method effectiveness. One commonly employed approach for mitigating dam sedimentation is dredging, a method favored for its relative ease of sediment removal and disposal (Willis and Griggs Citation2003, Boudjerda et al. Citation2022). However, there is a lack of studies evaluating the method’s effectiveness in relation to financial considerations. Assessing the effectiveness of dredging methods in handling reservoir sedimentation is essential for extending the life span of reservoirs and saving reservoir maintenance budgets. Therefore, this study aims to assess the economic effectiveness of dredging methods and to provide recommendations for the most efficient approach. To achieve this, we conducted a case study at the Mrica Dam in Banjarnegara, Central Java Province, Indonesia.
The volume of sediment deposited in the reservoir reached 88.55 million m3 by 2014, equivalent to 59.72% of the total volume of 148.28 million m3 (Hanafi Citation2015). The sediment deposition in the reservoir is significant, amounting to 4.2 million m3 per year or an average of approximately 11,506 m3 per day, indicating that sedimentation rate is greater than anticipated when the dam was built (PT Indonesia Power Citation2017, Citation2022). If this condition continues, the life span of the reservoir will be less than 50 yr, which is its original design life span. The sedimentation rates from the Merawu River, Serayu River, Lumajang River, and areas outside the Merawu, Lumajang, and Serayu rivers are 4.7 mm3/yr, 3.1 mm3/yr, and 2.7 mm3/yr, respectively. Therefore, accurate and comprehensive measures to address the sedimentation in the Mrica Reservoir are needed (Harjadi Citation2021). Sediment management to reduce the volume of sediment deposited in the reservoir, especially near the intake (foreset slope), has been implemented through use of drawdown culverts (DDC). The frequency of DDC operations has increased from 3 times in 2007 to 14 times per year in 2013, and it was projected to continue rising if sediment management relied solely on DDC operations. Therefore, additional sediment management measures are necessary to reduce the volume of sedimentation effectively. Dredging is considered one of the alternative solutions, alongside catchment management (Mtibaa et al. Citation2018, Ge et al. Citation2021, Ren et al. Citation2021).
The dredged sediment material is temporarily stored in a designated disposal area before being transported and utilized for building materials and land reclamation (Smith et al. Citation2013, Lee et al. Citation2019, Kantoush et al. Citation2021). This study aims to evaluate the sediment dredging activities near the intake (foreset slope) of the Mrica Banjarnegara Reservoir from both technical and economic perspectives. The assessment results will serve as the basis for determining future policies that PT Indonesia Power stakeholders could adopt in the management of the Mrica Reservoir to mitigate reservoir siltation. An assessment of sediment dredging in the Mrica Reservoir based on technical and economic aspects has never been conducted. Therefore, this study might serve as a valuable reference for addressing reservoir sedimentation in the future. Bagarani et al. (Citation2020) and Shrestha et al. (Citation2021) conducted assessments of sediment dredging in the reservoir and catchment area, considering economic and technical perspectives, at the Liscione Dam in Italy and the Nam Kong catchment area in Laos, respectively. Their methodologies were utilized as references for sedimentation management and evaluating the profitability of reservoir dredging.
Materials and methods
Study area
The Soedirman Reservoir, often referred to as the Mrica Dam, was built in 1988 for a hydroelectric power plant by damming the Serayu River (Utomo Citation2017, Marhendi Citation2019, Harjadi Citation2021). The Mrica Dam also supports irrigation and fish farming (Ulfiana et al. Citation2020). The flow of the Serayu River before entering the Mrica Dam is fed by 2 other major rivers: the Merawu River and the Lumajang River (Brontowiyono et al. Citation2019, Purwono et al. Citation2019). This dam is located in Bawang District, Banjarnegara Regency, approximately 8 km west of Banjarnegara City, Indonesia, at an altitude of roughly 200 m above sea level (). The dam, which is 6.5 km long and covers an area of 1250 ha, is the longest artificial lake and the largest dam in Southeast Asia, with an electricity production capacity of 184.5 MW (Suroso and Widiyanto Citation2009, Irayani et al. Citation2016, Suryanta et al. Citation2018). The power plant supplies the electricity needs of Java–Bali. The lifetime of the Mrica Reservoir was planned to be 50 yr at the time of its construction. However, only 26 yr since its inauguration, siltation has become more evident due to the high level of sedimentation in the Serayu River Basin, and it is estimated that only 4–7 yr of lifetime remain (Brontowiyono et al. Citation2019, Ulfiana et al. Citation2020). The observation locations of this study are focused on blocks I, II, III, and IV, which are the disposal areas of the Mrica Dam, Banjarnegara ().
Figure 1. Mrica Dam is located in Banjarnegara Region, Central Java Province, Indonesia. It was built in 1988 as a hydroelectric power plant supplying electricity to southern Java.
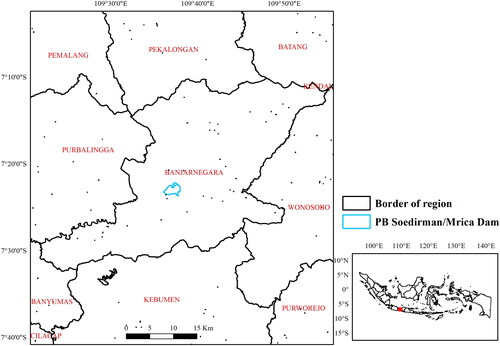
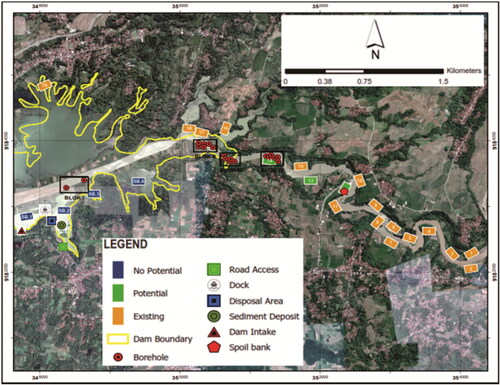
Figure 2. The spoil bank map and borehole points are shown on the satellite image. The existing spoil bank is the spoil bank that has been dredged by the community and consists of 19 locations. Potential spoil banks are spoil banks that have never been dredged and include 3 spots: 12, 13, and 14. No-potential spoil banks are spoil banks that are not profitable economically if the sand materials are sold.
Data source
This study commenced with an analysis of environmental impact documents (PT Indonesia Power Citation2017, Citation2022), followed by a survey of the research location and interviews with the management of PT Indonesia Power company and the mining communities in the sediment dredging area. Samples were collected through coring at 19 locations (). The focus of this study was on dredging activities in the vicinity of the intake (foreset slope; ). We observed the dredging process and other sediment management activities such as temporary storage of dredged sediments, sale of sand for building materials and land reclamation, and monitoring of sedimentation rate and volume. Additionally, a review of the environmental impact assessment reports of the Mrica Dam, Banjarnegara, which covers an area of 267 ha, was conducted to investigate the impact of dredging activities on the surrounding environment (). We estimated the operational dredging costs based on the government-set unit price of fuel designated for industrial and private company activities. Fuel prices in Indonesia are uniform across the country, as only one public company is authorized to sell consumer fuel, regulated by national government policies. Meanwhile, the dredging labor costs were calculated according to the minimum wage in Central Java Province, where the dam is situated. Additionally, the sale price of sediment material, specifically sand, was determined based on the market rate typically used by local sand mining communities and companies in the Banjarnegara Region. Furthermore, we compared this price with the prevailing market prices of sand sediment in several sand mining communities and companies in the Central Java Region.
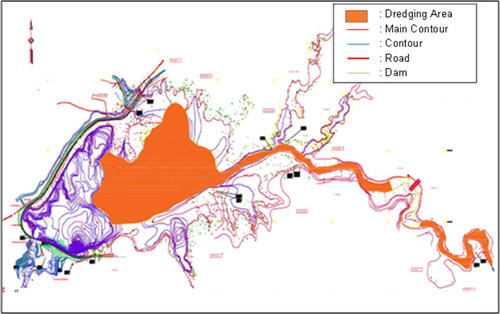
Figure 3. Map showing the sediment dredging area at Mrica Dam.
Grain size analysis of sediment cores
The stages of sediment core grain size analysis consist of pretreatment and grain fraction size analysis (Goossens Citation2008, Romano et al. Citation2018, Varga et al. Citation2019). In the pretreatment, the samples were soaked with a solution of distilled or natural water and hydrogen peroxide (30% H2O2) and left for 24 h to remove organic matter attached to sediment grains (Gray et al. Citation2010, Laible et al. Citation2023). Subsequently, the samples were stirred using a spoon and poured gradually into particle size analyzers with the specifications of the Mastersizer 3000 device from Malvern Panalytical, with the ability to analyze grain sizes between 0.01 µm and 3500 µm, equipped with laser diffraction technology. Data processing was carried out using the GRADISTAT program integrated with Microsoft Excel. This software can perform statistical calculations and classification of grain size, such as mean, sorting, skewness, and kurtosis. The software also automatically displays the distribution of gravel, sand, and mud, as well as the percentage of sand, silt, and clay (Menéndez-Aguado et al. Citation2015, Bhattacharya and Das Chatterjee Citation2021, Oyedotun Citation2022). To facilitate graphical presentation and statistical manipulation of grain size frequency data, the class scale boundaries are transformed into millimeter and micrometer units (; Blott and Pye Citation2001, Hairan et al. Citation2023).
Table 1. Sediment size classification applied in GRADISTAT software (Blott and Pye Citation2001, Hairan et al. Citation2023).
Analysis of the sediment dredging
Technical analysis was conducted by examining secondary data, such as erosion-sedimentation rates of the reservoir, sediment distribution, and a comparative assessment of different dredgers’ advantages and disadvantages (). The size of the study area was determined using satellite imagery and ArcGIS 10.8.1. Subsequently, the dredging costs were calculated using the environmental impact reports. The calculation formulas for dredging costs on the foreset slope and profit sharing per day and year (Bagarani et al. Citation2020, Shrestha et al. Citation2021) were
(1)
(1)
(2)
(2)
(3)
(3)
where FS is the foreset slope dredging cost calculation, BPP is the balanced payment plan (USD/m3), TP is total production of the foreset slope (m3), PS is profit sharing (USD), R is trips made by a truck, SPO is the number of sand pump owners, and ND is the number of days.
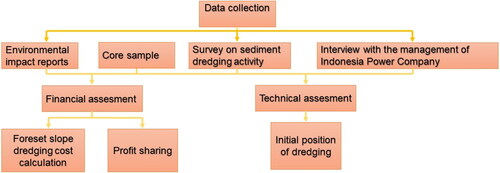
Figure 4. Flowchart of sediment dredging assessment at PB Soedirman Dam, Banjarnegara, Indonesia.
Results
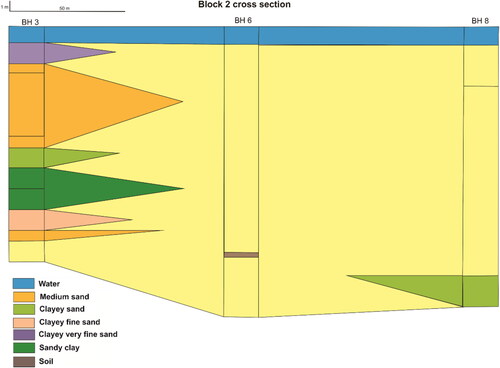
Observations conducted at the sand mining site have yielded valuable insights into the nature of the sand produced. The sand extracted from this site predominantly falls within the medium to coarse sand category (). Notably, the quality of this sand is relatively high, making it a sought-after commodity in the market, with the price of 10 tons of medium-sized sand reaching USD 41.5. Regarding production capacity, the site demonstrates a daily output ranging from 20 to 24 trucks of sand. Reservoir sedimentation sand is used for beach reclamation in the north and south coastal areas of Java, Indonesia, and some is utilized for building materials. Generally, the demand for sand annually grows due to increased coastal reclamation activities and massive new housing developments (PT Indonesia Power Citation2017, Citation2022). Further insights were gleaned from the drilling data collected at borehole (BH) 3, BH 6, and BH 8 (). In the case of BH 3, materials extracted from various depths included clayey fine sand, medium sand, clayey sand, sandy clay, and fine sand. On the other hand, BH 6 only yielded fine sand, while BH 8 produced fine sand and clayey sand. Upon analyzing the correlation of data from these 3 drilling points within block II (), it becomes apparent that the economic potential for medium sand primarily resides within BH 3. This suggests that the overall economic potential in block II is relatively limited, with medium sand being the focal point of interest.
Figure 5. The cross section of block II (BH 3–6–8) is dominated by medium sand.
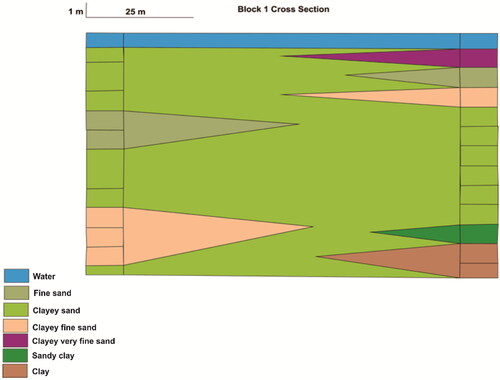
Observations at 3 existing spoil bank (SB) points 12, 13, and 14 based on the drilling data of BH 16, BH 18, and BH 19 () revealed sedimentary material, which, from top to bottom, consisted of fine sand, medium sand, coarse sand, medium sand, fine sand, and very fine sand. Correlating the drilling data from these 3 points in block IV indicated the dominance of medium sand sediment size at spoil bank points 12, 13, and 14. The economic potential of medium sand-sized sediment material is relatively high, as it could be directly sold and utilized after dredging. Block I, the block closest to the dam intake, represents 4 no-potential spoil banks (SB.1–SB.4). The sedimentary material deposited in BH 1 () is predominantly clayey sand, fine sand, and clayey fine sand. The clayey sand material has a brown color and exhibits plastic properties. Loamy sand-sized sedimentary materials require additional treatment to enhance their value, such as making roof tiles and fertilizers or serving as planting media.
Figure 6. Medium sand dominates the cross section of block IV (BH 16–18–19).
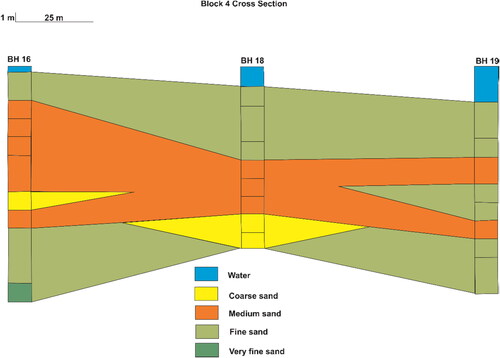
Figure 7. The cross section of block I (BH 1–2) exhibits the dominance of clayey sand.
Sediment dredging on the reservoir slope requires financing for operating expenditure (OPEX) and capital expenditure (CAPEX) by the asset owner because sediment holds no economic value. Dredging of sediment in bank spoil areas 3 to 19, conducted by existing dredging operators, might be profitable if the sediment price meets the regulatory requirements set by the government. Based on satellite image analysis, the dredged sediment area covers 2,691,082.55 m2, while the silting area, as reported in environmental impact assessments, measures 2,668,216.24 m2 (PT Indonesia Power Citation2017, Citation2022). The dredging area extends from the foreset slope near the intake to the headwaters of the Mrica Reservoir. The disposal area is south of the dredging area, making the mobilization of dredged products easier ().
Figure 8. Map depicting dredging and disposal sites of sediments around the Mrica Dam. The dock is located adjacent to the disposal area to save time and cost of loading and unloading dredged sediments.
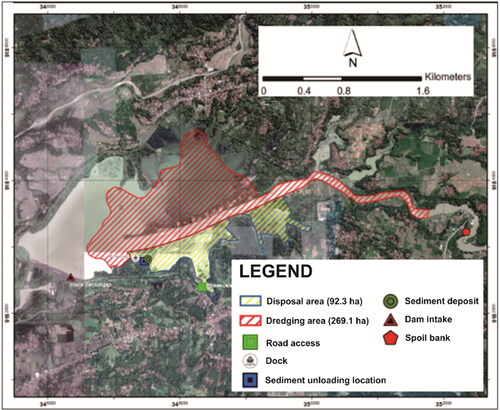
The disposal area serves as a temporary shelter for dredged sediment from the foreset slopes in reservoirs, utilizing filtering ponds or reservoir pools located near the pier. Based on satellite image analysis, the area of the disposal site covers 92.3 ha. However, according to the environmental impact assessment reports (PT Indonesia Power Citation2017, Citation2022), the disposal area measures 94.5 ha. The difference in the disposal area between the aerial photo analysis and the environmental impact assessment reports is due to a discrepancy in measurement methods. In the aerial photo analysis, the area measurement refers to the digitization of area boundaries, which might have inaccuracies because of perspective distortion, interpretation errors, objects covered by vegetation, differences in mapping scale, and weather disturbances that affect the resolution of aerial photos (Li et al. Citation2008, Zhang et al. Citation2010, Cai et al. 2018). Meanwhile, the measurement of the disposal area in the environmental impact assessment reports is based on direct observation and measurement methods in the field (PT Indonesia Power Citation2017, Citation2022). This location might temporarily accommodate the dredged sediment from the foreset area, which amounts to 5.54 million m3. The area near the jetty is the most suitable place for a temporary shelter for the dredged sediment (). This area already features water depths ranging from 1 to 3 m, with a ±3 m difference in elevation between the water and the green belt. On average, the sediment pile is 1 m above the green belt elevation. The landscape morphology naturally formed pools separated by land resulting from sediment deposition.
The annual volume of dredged sediment material in the dredging area is 4.44 million m3. This volume would be accommodated at 23 spoil bank points. The dredging results on the foreset slope (near the intake) amount to 1.110 million m3 per year, while the remaining 3.33 million m3 originated from existing areas where the sand quality and economic value are relatively low. Sediments temporarily stored in the disposal area can be utilized by third parties to produce various refined products with commercial value. The party responsible for managing this dredged sediment must fulfill the licensing requirements as per an agreement with PT Indonesia Power, the asset owner. PT Indonesia Power is obligated to cover the operational costs of electricity generation, including operating expenses, maintenance costs, employee costs, administration, and depreciation (). The daily dredging rate was 15,051 m3/day, considering 295 working days and 70 days of holidays within a year.
Table 2. Operational expenditure data.
The dredging targets for existing spoil banks 3–19 are 3.33 million m3, while the dredging targets for foreset slopes at existing spoil banks 1 and 2 are 1.11 million m3 within a year (). The selection of the dredger type considers several impact factors, including the occurrence of water turbidity, the suitability of the dredged material, water loss during sediment transportation, dredging productivity, and compatibility with the depth of the dredged sediment. Technically, the cutter submersible hydraulic dredge pump (CSHDP) is suitable for dredging various materials in the Mrica Dam, including mud, clay, sand, and stone, based on the sediment composition (Wei et al. Citation2022). Economically, CSHDP is the most suitable method for dredging due to its minimal water loss factor and high productivity compared to other methods (Ogorodnikov et al. Citation1987, Castro and Mantilla Citation2021, Kantoush et al. Citation2021). The capacity factor of Mrica’s power plant reaches 80% with an annual production of 350,400 m3. The total revenue is around USD 1.94/m3, with a margin of USD 0.45/m3. Routine expenditure data by PT Indonesia Power as the dam manager includes taxes, barge booster fuel costs, sand suction costs, sand unloading costs, sand transport truck costs, and barge rental costs ().
Table 3. Profit-sharing calculation based on the difference between expenditure components and company income.
The calculation of dredging costs on the foreset slope (Equation 1) amounts to USD 1.65 million annually. The 4 points of the spoil bank, located close to the intake, are unprofitable areas for dredging. Observations found that the dredged sediment primarily consists of fine clay–fine sand, with fine clay dominating and having almost no value. The existing spoil banks 3 to 19 sites are considered to have better potential compared to other spoil banks. The results of dredging in existing spoil bank 17 yielded backfill sand with a price of USD 21 per cycle at 7 points and USD 17.4 per cycle at 7 other points. In Pucang, Banjarnegara, the cost of sand per 8 m3 reaches USD 38.8 at 3 points, with an average price per 8 m3 of sand amounting to USD 22.6. The profit earned by PT Indonesia Power is the difference between the total sales price of sand and the routine costs spent by the company for sediment dredging ().
The profit sharing per day obtained by the company in relation to dredging dam sediments (Equation 2) is USD 23.65. The calculation of profit sharing per year (295 d; Equation 3) amounts to USD 118,575. The total volume of dredged sediment in the existing spoil bank areas from 3 to 19 is assumed to be 15 cycles × 8 m3 × 17 points × 295 d = 601,800 m3 per year. If we assume that the 17 points of the existing spoil banks (3 to 19), classified as profitable areas, have a sand sales potential of USD 6975 per year, respectively, then in 1 yr, for the 17 spoil banks, it would yield 17 × USD 6975 = USD 118,575. From this amount, we can conclude that the dredging of existing spoil banks 3 to 19, considered to have good sediment potential, did not generate sufficient profit to finance the dredging of the foreset slopes. This is due to the sand produced being of medium to low quality, with a low market price and subject to tax. The imposition of taxes on the dredgers significantly affects their income.
The expenditure cost for dredging on the foreset slope with the CSHDP dredger is USD 1.65 million/yr. while the revenue from the sale of sand (existing spoil banks 3 to 19 outside the foreset slope) is USD 118,575/yr. Therefore, PT Indonesia Power needs to provide funds of USD 1.54 million/yr as the difference between the cost of dredging sediments on the foreset slope (near the intake) and the revenue from the sale of sand. The budget to be incurred by PT Indonesia Power could be higher than USD 1.54 million/yr if each spoil bank does not contain the same volume and quality of sand. Additional costs by PT Indonesia Power are also adopted to restore the function of the Mrica Reservoir so that the life span of the reservoir returns to the original plan design. However, the profit-sharing agreement has not been regulated currently.
Discussion
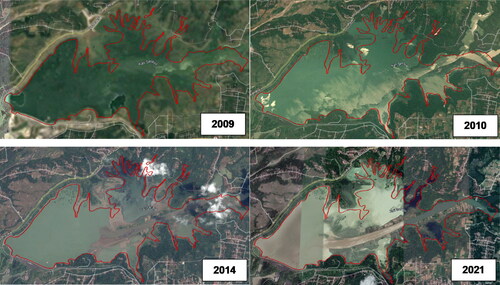
The issue of sedimentation in dams stems primarily from the confluence of multiple factors. A significant driver is the relentless growth of human populations, which in turn spurs increased exploitation of both land and water resources. Moreover, the catchment area surrounding the dam is characterized by a high annual rainfall of approximately 3900 mm/yr (Dian et al. Citation2012). Notably, 3 major rivers, the Serayu, Lumajang, and Merawu, traverse this watershed, originating from the volcanic mountains of Mount Sumbing, Mount Sindoro, and the Dieng Mountains (Cantik et al. Citation2021). These volcanic terrains, composed of igneous rocks, become the sediment source as they are transported from the upper reaches to downstream areas, eroded in the process, and eventually redeposited in sediment basins (Tsai et al. Citation2021). Increased sedimentation is observed in satellite images of the Mrica Dam from 2009 to 2021, showing very high levels over time (). Over time, the dam’s capacity has experienced a substantial reduction, amounting to a decrease of 53.67% relative to its initial construction capacity. This decline transpires at a rate of 2.82% per year (Marhendi Citation2019).
Figure 9. Satellite images of the Mrica Dam indicate a significant increase in sedimentation between 2009 and 2021.
The primary contributor to the intensified sedimentation issue at the Mrica Dam lies in the increased sediment load supplied by the Serayu, Merawu, and Lumajang rivers, which have collectively augmented their sediment volumes by 4.2 million m³ (Dian et al. Citation2012). This accelerated sedimentation rate at the dam can be attributed to the degradation of the upstream catchment areas along these rivers (Do et al. Citation2022). This degradation is a consequence of various detrimental activities, including deforestation for human settlements, plantations, and agricultural purposes, as well as illegal logging. The cumulative effect of these activities is 2-fold: a marked reduction in the dam’s capacity and a shortened life span for the Mrica Dam (Marhendi Citation2019).
Although dredging can only provide a short-term solution to the problem of sedimentation build-up at the dam, the benefits of selling the sedimentary material and utilizing it for coastal reclamation are positive aspects for the dam operator of adopting this method (Bagarani et al. Citation2020). Meanwhile, the long-term solution is to combine upstream catchment restoration with regular dredging of dam sedimentation and controlling the concentration of sediment flow from upstream to downstream (Wang and Kondolf Citation2014, Espa et al. Citation2019, Shrestha et al. Citation2021). Catchment rehabilitation also includes reforestation initiatives in the upstream regions of the Serayu, Merawu, and Lumajang rivers and forging collaborative partnerships with relevant stakeholders to enact regulations that prohibit further forest-clearing activities in these critical areas. Moreover, slope stabilization to prevent sediment mass avalanches and the construction of sediment settling ponds are also essential (Schleiss et al. Citation2016). Controlling sediment concentration in catchments and dams requires sediment flushing and sluicing (Wang and Kondolf Citation2014, Espa et al. Citation2019). Schleiss et al. (Citation2016) explained that sediment control must consider multiple parameters such as geographic location, catchment geometry (topography and river network), land cover, reservoir geometry, dam sedimentation rate, environmental issues, and equipment availability. Furthermore, Do et al. (Citation2022), in their study linking climate change to sedimentation at Pleikrong Dam, Vietnam, stated that climate change was shown to accelerate reservoir sedimentation, making it necessary to include this parameter when planning dam capacity maintenance. Nevertheless, the influence of climate change on sedimentation in Mrica Dam was not examined in this study and would require additional research.
Adopting a permanent solution to reduce dam sedimentation would mitigate the company’s recurrent costs in executing sediment dredging programs and ensure long-term environmental sustainability (Espa et al. Citation2019). Notably, the costs associated with sediment dredging and alternative methods to combat sedimentation consistently outweigh the revenue generated from the sale of sedimentation materials (Morris Citation2020). Numerous case studies have underscored the effectiveness and efficiency of reforestation and environmental preservation initiatives in the catchment and upstream areas as robust strategies for sedimentation management, both at the localized level and on a broader scale. Unfortunately, alternative methods, such as diverting sediment downstream by constructing large-capacity outlets that allow rapid sediment transportation through reservoirs, require comprehensive studies of factors such as construction costs, dam geometry, land use around the dam, availability of finance, and ecological impacts (Kondolf et al. Citation2014, Espa et al. Citation2019, Shrestha et al. Citation2021).
The essential component of reducing the financial burden of dredging sediment at dams is to increase the surplus value of dredged sediment sales. Therefore, to expedite the dredging progress and decrease operational costs, selecting the right initial dredging location is necessary based on technical considerations and geological aspects. The distance between the disposal area and the dredging site is another crucial aspect affecting the company’s expenditure. In the Mrica Dam study in Banjarnegara, Indonesia, it was found that the foreset slope is an appropriate location for the initial stage of dredging, with the disposal area also situated near the dredging area. Company management and the sediment mining community need to collaborate to increase the sales price of dredged sediment. Generally, the accuracy of dredging site selection and disposal area should be the main factors considered for dam dredging applications elsewhere. Increasing profit sharing through the enhanced added value of dredged sediment is another essential aspect that could be applied to sediment dredging programs in other case studies.
Conclusion
Sediment dredging activities in the foreset slope region (1 and 2) present a challenge in terms of profitability, ultimately resulting in a financial burden for the asset owner. The spoil banks located near the intake, often referred to as foreset slope (1 and 2), do not currently offer a viable avenue for profitable business operations. This situation persists unless comprehensive treatment measures are undertaken to address the dredged sediment effectively.
In contrast, the 17 spoil bank points (3 to 19), handled by the existing dredging operations, can be categorized as profitable dredging areas. The level of profitability associated with these 17 spoil bank points hinges on several critical factors, primarily the sediment’s composition, quality, and classification. These factors serve as the foundational criteria for determining the material’s selling value and the applicable sales tax.
Based on satellite imagery analysis, the area designated for temporary sediment storage during dredging activities spans approximately 923,777 m2 or ∼92 ha. This aligns with data from the environmental impact reports indicating a disposal area of 94.5 ha and a corresponding disposal volume of 5.67 million m3. Delving further into the financial aspects, an analysis of the dredging costs associated with sediment removal from the forest slopes, estimated at a volume of 1.1 million m3 annually, reveals an annual expenditure of USD 1.65 million. In contrast, the revenue generated by the existing miners engaged in upstream dredging activities (3 to 19) amounts to USD 118,575 per year. Note that no profit-sharing agreement pertaining to the sales value of the dredged sand currently exists.
PT Indonesia Power, serving as the custodian of the Mrica Reservoir assets and responsible for sediment management, consistently allocates CAPEX and OPEX budgets for dredging on foreset slopes, amounting to USD 1.54 million annually. These financial details underscore the complex interplay of costs and revenues associated with sediment dredging activities, particularly in the context of foreset slopes and the broader reservoir management. Finding a sustainable and cost-effective solution for sediment management remains a paramount challenge for the asset owner and stakeholders involved in the Mrica Reservoir.
Author contributions
Gentur Waluyo contributed to the research concept, designed the experiments, and wrote the manuscript. FX Anjar Tri Laksono conducted the experiments and data processing and wrote the manuscript. Januar Aziz Zaenurrohman collected data and wrote the manuscript. Manoranjan Mishra wrote and reviewed the manuscript. Agatha Sih Piranti reviewed the data analysis and wrote the manuscript. János Kovács reviewed the manuscript.
Acknowledgments
The authors thank PT Indonesia Power company, which funded this research and permitted us to collect data about their location. The authors also acknowledge the University of Pécs for financing the publication of this article. The corresponding author would like to thank Polina Bochkareva for motivating and inspiring the second author to do research.
Disclosure statement
The authors declare that they hold no competing interests.
Additional information
Funding
References
- Bagarani M, De Vincenzo A, Ievoli C, Molino B. 2020. The reuse of sediments dredged from artificial reservoirs for beach nourishment: technical and economic feasibility. Sustainability. 12(17):6820. doi: 10.3390/su12176820.
- Bhattacharya RK, Das Chatterjee N. 2021. Sediment grain size analysis and mining intensity: estimation by GRADISTAT, G-STAT and LDF techniques. In: Förstner U, Rulkens WH, editors. Environmental science and engineering. New York (NY): Springer-Verlag; p. 105–149.
- Blott SJ, Pye K. 2001. Gradistat: a grain size distribution and statistics package for the analysis of unconsolidated sediments. Earth Surf Processes Landf. 26(11):1237–1248. doi: 10.1002/esp.261.
- Boudjerda M, Touaibia B, Mihoubi MK, Basson GR, Vonkeman JK. 2022. Application of sediment management strategies to improve reservoir operation: a case study Foum El-Gherza Dam in Algeria. Int J Environ Sci Technol. 19(11):10957–10972. doi: 10.1007/s13762-021-03896-w.
- Brontowiyono W, Wardhana RK, Wacano D. 2019. Suitability conservation types analysis of Panglima Besar Soedirman Reservoir. MATEC Web Conf. 280:01006. doi: 10.1051/matecconf/201928001006.
- Cai L, Shi W, Miao Z, Hao M. 2018. Accuracy assessment measures for object extraction from remote sensing images. Remote Sens. 10(2):303. doi: 10.3390/rs10020303.
- Cantik BKP, Legono D, Rahardjo AP. 2021. Efektivitas penggelontoran sedimen (flushing) studi kasus waduk PB Soedirman. JTS. 16(1):14–23. Indonesian. doi: 10.24002/jts.v16i1.4213.
- Castro PW, Mantilla CA. 2021. Implementation of strategies for the management of dams with sedimented reservoirs. Water Resour Manage. 35(13):4399–4413. doi: 10.1007/s11269-021-02956-7.
- Dian SW, Budi SA, Karsinah. 2012. Dampak sedimentasi Bendungan Soedirman terhadap kehidupan ekonomi masyarakat. Jejak. 5:117–229. Indonesian.
- Do XK, Nguyen TH, Ngo LA, Felix ML, Jung K. 2022. Prediction of reservoir sedimentation in the long term period due to the impact of climate change: a case study of Pleikrong Reservoir. JDR. 17(4):552–560. doi: 10.20965/jdr.2022.p0552.
- Espa P, Batalla RJ, Brignoli ML, Crosa G, Gentili G, Quadroni S. 2019. Tackling reservoir siltation by controlled sediment flushing: impact on downstream fauna and related management issues. PLoS One. 14(6):e0218822. doi: 10.1371/journal.pone.0218822.
- Ge H, Zhu L, Lin Q, Deng C. 2021. Analysis of sediment deposition in Lushui Reservoir to guide dredging. Arab J Geosci. 14(2):133. doi: 10.1007/s12517-021-06512-w.
- Goossens D. 2008. Techniques to measure grain-size distributions of loamy sediments: a comparative study of ten instruments for wet analysis. Sedimentology. 55(1):65–96. doi: 10.1111/j.1365-3091.2007.00893.x.
- Gray AB, Pasternack GB, Watson EB. 2010. Hydrogen peroxide treatment effects on the particle size distribution of alluvial and marsh sediments. Holocene. 20(2):293–301. doi: 10.1177/0959683609350390.
- Hairan MH, Jamil NR, Azmai MNA, Looi LJ, Aris AZ, Rosli MH. 2023. The analysis of large dam impacts on sediment grain size distribution in a tropical river system. Civil Eng J. 9:15–26. doi: 10.28991/CEJ-SP2023-09-02.
- Hanafi F. 2015. Kajian perubahan penggunaan lahan terhadap laju erosi permukaan di daerah tangkapan air Waduk Mrica. J Geogr. 12:1–14. Indonesian.
- Harjadi B. 2021. Erosion analysis in the Mrica Reservoir catchment area in Indonesia using the soil erosion status method. For Geo. 35(2):116–129. Indonesian. doi: 10.23917/forgeo.v35i2.13943.
- Ijam AZ, Al-Mahamid MH. 2012. Predicting sedimentation at mujib dam reservoir in Jordan. Jordan J Civ Eng. 6:448–463.
- Irayani Z, Permanajati I, Haryadi A, Wihantoro W, Azis AN. 2016. Investigasi bidang gelincir tanah longsor dengan metode tahanan jenis dan pengujian sifat plastisitas tanah di Bukit Pawinihan Desa Sijeruk, Kecamatan Banjarmangu, Kabupaten Banjarnegara. DINAREK. 12(2):53–57. Indonesian. doi: 10.20884/1.dr.2016.12.2.145.
- Issa EI, Al-Ansari N, Knutsson S, Sherwany G. 2015. Monitoring and evaluating the sedimentation process in Mosul Dam Reservoir using trap efficiency approaches. Engineering. 07(04):190–202. doi: 10.4236/eng.2015.74015.
- Kantoush SA, Mousa A, Shahmirzadi EM, Toshiyuki T, Sumi T. 2021. Pilot field implementation of suction dredging for sustainable sediment management of dam reservoirs. J Hydraul Eng. 147(2):04020098. doi: 10.1061/(ASCE)HY.1943-7900.0001843.
- Kondolf GM, Gao Y, Annandale GW, Morris GL, Jiang E, Zhang J, Cao Y, Carling P, Fu K, Guo Q, et al. 2014. Sustainable sediment management in reservoirs and regulated rivers: experiences from five continents. Earth’s Future. 2(5):256–280. doi: 10.1002/2013EF000184.
- Laible J, Camenen B, Le Coz J, Pierrefeu G, Mourier B, Lauters F, Dramais G. 2023. Comparison of grain size distribution measurements of sand-silt mixtures using laser diffraction systems. J Soils Sediments. 23(5):2310–2325. doi: 10.1007/s11368-023-03470-6.
- Lee FZ, Lai JS, Guo WD, Sumi T. 2019. Scouring of replenished sediment through reservoir flood discharge affects suspended sediment concentrations at downstream river water intake. Water. 11(10):1998. doi: 10.3390/w11101998.
- Li F, Kustas WP, Anderson MC, Prueger JH, Scott RL. 2008. Effect of remote sensing spatial resolution on interpreting tower-based flux observations. Remote Sens Environ. 112(2):337–349. doi: 10.1016/j.rse.2006.11.032.
- Marhendi T. 2019. Analisa perubahan volume sedimentasi waduk Pangsar Soedirman menggunakan karakteristik curah hujan berbasis Universal Soil Loss Equation (USLE). Teknik. 39(2):120–125. Indonesian. doi: 10.14710/teknik.v39i2.13763.
- Menéndez-Aguado JM, Peña-Carpio E, Sierra C. 2015. Particle size distribution fitting of surface detrital sediment using the Swrebec function. J Soils Sediments. 15(9):2004–2011. doi: 10.1007/s11368-015-1156-9.
- Miranda MN, Rosa C, Peres A, Maia R. 2021. Sedimentation assessment and effects in Venda Nova dam reservoir (Portugal). Sci Total Environ. 766:144261. doi: 10.1016/j.scitotenv.2020.144261.
- Mohammad ME, Al-Ansari N, Issa IE, Knutsson S. 2016. Sediment in Mosul Dam Reservoir using the HEC-RAS model. Lakes Reservoirs. 21(3):235–244. doi: 10.1111/lre.12142.
- Morris GL. 2020. Classification of management alternatives to combat reservoir sedimentation. Water. 12(3):861. doi: 10.3390/w12030861.
- Mtibaa S, Hotta N, Irie M. 2018. Analysis of the efficacy and cost-effectiveness of best management practices for controlling sediment yield: a case study of the Joumine watershed, Tunisia. Sci Total Environ. 616-617:1–16. doi: 10.1016/j.scitotenv.2017.10.290.
- Mulu A, Dwarakish GS. 2015. Different approach for using trap efficiency for estimation of reservoir sedimentation. An overview. Aquat Procedia. 4:847–852. doi: 10.1016/j.aqpro.2015.02.106.
- Ogorodnikov SP, Mikheev II, Kulakov AE. 1987. Optimization of the mud intakes of dredges with submersible pumps. Hydrotech Construct. 21(7):432–436. doi: 10.1007/BF01427276.
- Oyedotun TDT. 2022. GRADISTAT in environmental sciences: a sampled review of the 21 years of the program application in environmental sciences. IER. 22(1):43–66. doi: 10.1504/IER.2022.122993.
- PT Indonesia Power. 2017. Environmental impact assessment report for Mrica Dam, Banjarnegara in 2016. Banjarnegara: IP/01/08/2017.
- PT Indonesia Power. 2022. Environmental impact assessment report for Mrica Dam, Banjarnegara in 2021. Banjarnegara: IP/03/06/2022.
- Purwono P, Ristiawan A, Ulya AU, Matin HAA, Ramadhan BS. 2019. Physical-chemical quality analysis of Serayu River water, Banjarnegara, Indonesia in different seasons. J Environ Sustain. 3:1–66.
- Ren S, Zhang B, Wang WJ, Yuan Y, Guo C. 2021. Sedimentation and its response to management strategies of the Three Gorges Reservoir, Yangtze River, China. Catena 199:105096. doi: 10.1016/j.catena.2020.105096.
- Romano E, Magno MC, Bergamin L. 2018. Grain size of marine sediments in the environmental studies, from sampling to measuring and classifying. A critical review of the most used procedures. Acta IMEKO. 7(2):10–15. doi: 10.21014/acta_imeko.v7i2.537.
- Schleiss AJ, Franca MJ, Juez C, De Cesare G. 2016. Reservoir sedimentation. J Hydraul Res. 54(6):595–614. doi: 10.1080/00221686.2016.1225320.
- Shalash S. 1982. Effects of sedimentation on the storage capacity of the High Aswan Dam reservoir. Hydrobiologia. 91:623–639.
- Shrestha B, Cochrane TA, Caruso BS, Arias ME, Wild TB. 2021. Sediment management for reservoir sustainability and cost implications under land use/land cover change uncertainty. Water Resour Res. 57:e2020WR028351.
- Smith C, Williams J, Nejadhashemi AP, Woznicki S, Leatherman J. 2013. Cropland management versus dredging: an economic analysis of reservoir sediment management. Lake Reserv Manag. 29(3):151–164. doi: 10.1080/10402381.2013.814184.
- Suroso, Widiyanto W. 2009. Sedimentation control model of Mrica reservoir using model fluiditation. Dinarek. 5:1858–3075. Indonesian.
- Suryanta J, Windiastuti R, Rachma TRN, Nahib I. 2018. Sustainable water management in serayu cathment area in supporting potency of electrical energy microhydro Banjarnegara regency central Java province. In: Cho K, editor. Remote sensing enabling prosperity. Asian Conference on Remote Sensing 39; 15 Oct 2018. Asian Association on Remote Sensing. Kuala Lumpur. p. 1–6.
- Tsai CW, Yeh TG, Hsu Y, Wu KT, Liu WJ. 2021. Risk analysis of reservoir sedimentation under non-stationary flows. J Flood Risk Manag. 14:e12706.
- Ulfiana D, Wulandari DA, Parmantoro PN, Susilowati. 2020. Effect of change of channel width in the downstream of the check dam on controlling sedimentation in Mrica Reservoir. IOP Conf Ser: Mater Sci Eng. 771(1):012047. doi: 10.1088/1757-899X/771/1/012047.
- Utomo P. 2017. Mrica Reservoir sedimentation: current situation and future necessary management. J Civil Eng Forum. 3:95–100.
- Varga G, Gresina F, Újvári G, Kovács J, Szalai Z. 2019. On the reliability and comparability of laser diffraction grain size measurements of paleosols in loess records. Sediment Geol. 389:42–53. doi: 10.1016/j.sedgeo.2019.05.011.
- Wang HW, Kondolf GM. 2014. Upstream sediment-control dams: five decades of experience in the rapidly eroding Dahan River basin, Taiwan. J Am Water Resour Assoc. 50(3):735–747. doi: 10.1111/jawr.12141.
- Wang ZY, Hu C. 2009. Strategies for managing reservoir sedimentation. Int J Sediment Res. 24(4):369–384. doi: 10.1016/S1001-6279(10)60011-X.
- Wei Z, Xiaoge X, Hao H, Lin C, Yuehong L, Xiaowei L, Yong W. 2022. Water quality and change pattern of residual water in reservoir environmental dredging and plate and frame dewatering project. J Lake Sci. 34(2):468–477. doi: 10.18307/2022.0209.
- Willis CM, Griggs GB. 2003. Reductions in fluvial sediment discharge by coastal dams in California and implications for beach sustainability. J Geol. 111(2):167–182. doi: 10.1086/345922.
- Zhang RH, Tian J, Li ZL, Su HB, Chen SH, Tang XZ. 2010. Principles and methods for the validation of quantitative remote sensing products. Sci China Earth Sci. 53(5):741–751. doi: 10.1007/s11430-010-0021-3.