
 ?Mathematical formulae have been encoded as MathML and are displayed in this HTML version using MathJax in order to improve their display. Uncheck the box to turn MathJax off. This feature requires Javascript. Click on a formula to zoom.
ABSTRACT
Asymmetric minimal receptors based on 4-nitrophenylurea, 1, and 4-nitrophenylthiourea, 2, were shown to bind a range of anions and are deprotonated by both fluoride and hydroxide to give a colorimetric response. A 4-trifluoromethylphenylurea receptor, 3, was deprotonated by fluoride but not hydroxide but was not discernible by the naked eye. Deprotonation of 1 by fluoride ultimately resulted in the formation of its bicarbonate complex as determined by X-ray crystallography in agreement with DFT calculations. Fluorescence spectroscopy revealed that emission of 2 reaches a maximum at two equivalents of anions except for fluoride where it continues to increase with increasing addition of TBAF allowing 2 to give a fluoride-specific response.
GRAPHICAL ABSTRACT
Introduction
The supramolecular chemistry of anion binding can be traced back to the work of Park and Simmons in 1968 [Citation1] and its subsequent progress is the subject of numerous reviews [Citation2–10]. Our interest in anionbinding stems from the possibility of detecting the hydrolysis products from G-series chemical warfare agents () [Citation11,Citation12]. While cyanide liberated from tabun can be detected using a chromogenic coumarin [Citation13,Citation14], other G-agents sarin (GB) and soman (GD) initially produce fluoride and isopropyl methylphosphonic acid (IMPA) or pinacolyl methylphosphonic acid (PMPA), respectively, upon hydrolysis as shown in [Citation15].
Figure 1. Minimal anion-binding receptors 1-4.

Scheme 1. G-series chemical warfare agents and their hydrolysis products.

We have therefore turned our attention to three of the most common motifs in anion recognition, urea [Citation16,Citation17], thiourea [Citation18,Citation19] and squaramide [Citation20] groups, as potential fluoride receptor moieties within a molecular sensor.
Considerable effort has gone into understanding how anions bind to these molecular clefts, particularly the balance between hydrogen bonding and deprotonation. There are numerous reports of symmetric systems based on these motifs [Citation21–30], but our interest is in linking self-indicating chromophores to secondary binding sites for bifunctional recognition. To this end we identified four ‘minimal’ anionbinding structures to assess based on asymmetric 4-nitrophenylurea 1 [Citation31], 4-nitrophenylthiourea 2 [Citation19] and 4-(trifluoromethyl)phenylurea 3 [Citation32] motifs. A novel asymmetric squaramide derivative, 4, was prepared for further comparison.
Materials and methods
Unless otherwise stated, all materials and solvents were purchased from Sigma-Aldrich (Gillingham, Dorset, UK) and used without further purification. Dimethyl squarate was prepared by the method of Mohammed et al. [Citation33]. 3-Methoxy-4-(methylamino)cyclobut-3-ene-1,2-dione was prepared by the method of Benenato et al. [Citation34]. NMR spectra were recorded on a Bruker Avance-400 instrument at 400, 377 and 100 MHz for1H, 19F and13C, respectively. Chemical shifts (in ppm) were referenced to tetramethylsilane (TMS). HRMS was recorded on a Bruker microTOF instrument operating in the positive mode. Melting points were determined with a BI Barnstead Electrothermal Ltd melting point apparatus and are uncorrected. Computer simulations utilised Spartan ’20 software [Citation35] and were carried out on a 6-Core Mac Pro running 3.5 GHz Intel Xeon E5 processors in parallel. UV-visible spectra were recorded on a Shimadzu 2401PC UV-Vis Dual Beam spectrophotometer and fluorescence spectra on a Cary Eclipse Fluorescence Spectrophotometer. Single crystal X-ray data were collected by the EPSRC UK National Crystallography Service and solved in-house with SHELX [Citation36].
Synthesis
1-Methyl-3-(4-nitrophenyl)urea, 1 [Citation31]: Methylamine in THF (3.8 mL of a 2 M solution, 7.6 mmol) was added to a solution of 4-nitrophenyl isocyanate (1.15 g, 7 mmol) in THF (100 mL) and stirred at room temperature for 24 h. The pale yellow precipitate was collected by vacuum filtration and recrystallised from hot ethyl acetate to give 1-methyl-3-(4-nitrophenyl)urea, 1, as colourless crystals. Yield: 0.99 g (73%); m.p.: 237–241°C; 1H NMR (400 MHz, CD3CN) δ 8.11 (d, J = 9.2 Hz, 2 H, ArH), 7.74 (s, 1 H, NH), 7.61 (d, J = 9.5 Hz, 2 H, ArH), 5.27 (s, 1 H, NH), 2.74 (d, J = 4 Hz, 3 H, CH3); 13C NMR (100 MHz, CDCl3/d6-DMSO) δ ppm: 155.64, 147.16, 140.85, 124.89, 116.76, 26.28; HRMS: m/z calculated for [1 + Na – H]+: 217.0463; found: 217.8910, calculated for [12 + Na]+: 413.1186, found: 413.0997; λmax (acetonitrile) 340 nm.
1-Methyl-3-(4-nitrophenyl)thiourea, 2 [Citation19]: Methylamine in THF (3.8 mL of a 2 M solution, 7.6 mmol) was added to a solution of 4-nitrophenyl isothiocyanate (1.26 g, 7 mmol) in THF (100 mL) and stirred at room temperature for 24 h. The solvent was removed under reduced pressure. The crude solid was dissolved in hot ethyl acetate, filtered and cooled to give a pale-yellow precipitate which was recrystallised from ethyl acetate to give 1-methyl-3-(4-nitrophenyl)thiourea, 2, as pale yellow crystals. Yield: 0.98 g (66%); m.p.: 201–205°C; 1H NMR (400 MHz, CD3CN) δ 8.50 (s, 1 H, NH), 8.17 (d, J = 8 Hz, 2 H, ArH), 7.74 (d, J = 8 Hz, 2 H, ArH), 6.93 (s, 1 H, NH), 3.03 (d, J = 4 Hz, 3 H, CH3); 13C NMR (100 MHz, CDCl3/d6-DMSO) δ ppm: 181.05, 146.18, 141.91, 123.97, 120.07, 30.79; HRMS: m/z calculated for [2 + Na]+: 234.0313; found: 234.0341; λmax (acetonitrile) 343 nm.
1-Methyl-3-(4-(trifluoromethyl)phenyl)urea, 3: Methylamine in THF (1.9 mL of a 2 M solution, 3.8 mmol) was added to a solution of 4-trifluoromethyphenyl isocyanate (0.5 mL, 3.5 mmol) in THF (50 mL) and stirred at room temperature for 24 hrs. The white precipitate was collected by vacuum filtration and recrystallised from hot ethyl acetate to give 1-methyl-3-(4-(trifluoromethyl)phenyl)urea, 3, as colourless crystals. Yield: 0.39 g (51%); m.p.: 195–198°C; 1H NMR (400 MHz, CD3CN) δ 7.56 (dd, J1 = 24 Hz, J2 = 8 Hz, 4 H, ArH), 5.25 (s, 1 H, NH), 2.72 (d, J = 4.8 Hz, 3 H, CH3); 13C NMR (100 MHz, CDCl3/d6-DMSO) δ ppm: 156.06, 143.92, 125.73, 125.69, 125.65, 117.25, 26.24; 19F NMR (377 MHz, CDCl3) δ ppm: −61.10 (s, -CF3); HRMS: m/z calculated for [3 + Na]+: 241.0565; found: 241.0427; λmax (acetonitrile) 251 nm.
3-N-Methyl-4-(N’-4-nitrophenyl)squaramide, 4: 3-Methoxy-4-(methylamino)cyclobut-3-ene-1,2-dione (4.23 g, 3.0 mmol) and 4-nitroaniline (0.46 g, 3.3 mmol) were dissolved in toluene-DMF mixture (10:1, 44 mL). To this, zinc triflate was added (0.2181 g, 0.6 mmol) and the mixture was heated to 100°C for 20 h whereupon a green precipitate formed. The solution was cooled to room temperature and filtered under vacuum. The precipitate was washed with methanol to leave 3-N-methyl-4-(N’-4-nitrophenyl)squaramide, 4, as a green powder. Yield: 0.18 g, 24%; m.p.: decomp. >300°C; 1H NMR (400 MHz, d6-DMSO) δ 10.18 (s, 1 H, NH), 8.20 (d, J = 8 Hz, 2 H, ArH), 7.58 (d, J = 8 Hz, 3 H, ArH – overlapping with NH signal at 7.62), 2.53–2.47 (m, 3 H, CH3); 13C NMR (100 MHz, d6-DMSO) δ ppm: 162.06, 145.33, 141.34, 125.56, 117.62, 30.78; HRMS: m/z calculated for [4 + Na]+: 270.0491; found: 270.1619; λmax (DMSO) 406 nm.
NMR studies
Stock solutions of receptors 1 to 3 were prepared in d3-acetonitrile +1.0% TMS at 2 × 10⁻² M. Stock solutions of tetrabutylammonium (TBA) F−, Cl−, H2PO4−, OH− and CH3CO2− were prepared in the same solvent at 2 × 10⁻¹ M. One hour before running the experiment, mixtures of the receptor and anions were made up whereby 0.5 mL of receptor solution was added, plus a volume of TBA anion solution equivalent to 0.25, 0.5, 0.75, 1.0, 1.5, 2 and 5 mol ratios, then made up to a volume of 1.0 mL with solvent, ensuring the host concentration stayed constant throughout the titration. For titrations with TBAF, the19F NMR spectra were also recorded.
UV-visible and fluorescence spectroscopy
The response of the receptors in the UV-visible spectrum on addition of one equivalent of ten different TBA salts was evaluated. Solutions of the receptors (0.1 mM) were made up in acetonitrile. Solutions of TBA F−, Cl−, Br−, I−, NO3−, BF4−, HSO3−, H2PO4−, OH− and CH3CO2− (10 mM) were also made up in acetonitrile. Solutions were made up in a quartz cuvette, path length 10 mm, using 2 mL of the receptor solution and 20 µL of TBA anion salt solution to achieve a 1:1 mole ratio. Spectra were recorded from 200 nm to 800 nm using quartz cuvettes. The stock solutions of the receptors and the TBA salts described above were then used for titration studies, gathering data from which binding constants can be calculated. Solutions containing the respective receptor and 0.2, 0.4, 0.6, 0.8, 1.0, 1.5, 2, 5 or 10 equivalents of anions were analysed.
Stock solutions prepared as above were also used for fluorescence studies. Solutions containing the respective receptor and 0.5, 1, 2 or 5 equivalents of TBA salt solutions were added to 2 mL of receptor solution and scanned at the appropriate wavelengths in triplicate. UV-visible data were used to select the scanning wavelengths as summarised in .
Table 1. Experimental parameters used for fluorescence scans of compounds 1-3.
Computational studies
Structures of 1-3 together with a range of their anion complexes were built in Spartan ‘20 using the Build mode. The geometry was optimised using the Minimizer, before the ground-state equilibrium geometry in the gas phase was calculated by the semiempirical PM6 method. The Gibbs’ free energies for the resulting structures were used to calculate the likelihood that the proposed complexes were stable using:
ΔG(formation) = G(complex) – ΣG(ligand + anion)
The free energy of the ligand’s lowest energy conformer was summed with the guest free energy as complexation often involved a higher energy conformer. Subsequently the receptors and their complexes with F−, OH−, CH3CO2− and HCO3− were investigated by DFT using the EDF2 functional and 6-31G* basis set to generate structural models.
Crystallography
X-Ray crystallographic quality crystals of 1, 2 and 3 were obtained through slow evaporation of supersaturated solutions of the receptors in ethyl acetate. Crystals of 1 with TBA+CH3CO2− and TBA+HCO3− were obtained by slow evaporation from ethyl acetate solutions of the receptor with TBA+CH3CO2− and TBA+F−, respectively.
Results
Synthesis
Urea and thiourea receptors were prepared following literature methods, . A synthetic route to urea receptor 1 was first reported by Scholl [Citation37] and Nyberg [Citation38] in 1906 with others subsequently preparing it under a range of conditions [Citation39–41]. Similarly, its thiourea analogue, 2, has been known since its synthesis by Hunter and Parken in 1934 [Citation19] with other routes also reported [Citation42–44]. Receptor 3 was prepared by a variation the method of Martin [Citation32], where THF was substituted for acetonitrile, with similar methods reported by others [Citation45–47]. The novel squaramide was prepared using the method of Taylor [Citation20].
Scheme 2. Synthesis of minimal receptors: 1 (X = O, R = NO2), 2 (X = S, R = NO2), 3 (X = O, R = CF3) and 4.

NMR studies
1H NMR titrations of 1 and 2 with tetrabutylammonium fluoride, chloride, dihydrogen phosphate, acetate and hydroxide salts were undertaken. The two NH singlet peaks were most sensitive to anions but the adjacent aromatic and methyl signals can often be used to assess binding. Downfield shift perturbations in these peaks indicated hydrogen-bonding interactions between anions and NH protons. Titrations with tetrabutylammonium chloride, acetate and dihydrogen phosphate could be monitored by observing shifts of the NH peaks throughout. Unfortunately, deprotonation, NH proton exchange and the small magnitude of shifts of other protons made this method unsuitable for determining binding constants.
19F NMR spectroscopy was useful when following the addition of TBAF to receptor 3. On addition of 0.25 equivalents of TBAF, a signal was observed at −62.04 ppm, corresponding to the trifluoromethyl group of the receptor, and another at −95.11 ppm, corresponding to F−. As five equivalents of salt were added, the F− peak moved gradually 20.72 ppm upfield to −115.83 ppm suggesting release of bound fluoride from the receptor (see ESI Figure S14). Bowman-James observed a similar19F upfield shift from −96.7 to −111.7 ppm, together with the appearance of a downfield signal, following the addition of TBAF to a solution of a bicyclic azacryptand [Citation48]. This was interpreted as an internal and external F− signal when greater than one equivalent of F− was present with one F− in in the cavity, downfield, and one as solvated F−, upfield. In our case, 1H NMR supports deprotonation by F− and19F NMR is in agreement with increasing electron density on F− as it is released from the receptor. This behaviour highlights the complex nature of the speciation of the receptor-fluoride system in which fluoride binds, deprotonates and, ultimately, generates bicarbonate (vide infra).
UV-visible and fluorescence spectroscopy
An initial, visual assessment was made of the chromogenic effects observed when a single equivalent of a range of anions, as their TBA salts, was added to the receptors as shown in . Receptors 1, 2 and 4 contain the 4-nitrophenyl chromophore and receptor 3 contains the 4-trifluoromethylphenyl group. Those groups act as signalling units for binding at the urea site, so colour changes and spectral changes were expected to occur on addition of guests into solutions of these receptors.
Figure 2. Colour changes of receptors (from top) 1, 2, 3 (in acetonitrile) and 4 (in DMSO) with one equivalent of TBA anions (5 mM in acetonitrile): (l to r) free receptor, F−, Cl−, Br−, I−, NO3−, CH3CO2−, H2PO4−, OH−, HSO4−, BF4−.

At the concentrations used, receptors 1 to 3 gave colourless solutions to the naked eye but, on addition of a single equivalent of TBA anions, the only colour changes that could be clearly observed were for 2 in the presence of OH− and F−. On addition these changed from colourless to yellow; addition of dihydrogen phosphate and acetate gave a visible colour change to a lesser degree. Some very subtle changes were observed for 1 on addition of TBA OH− and F−.
The intense response by 4, and its limited solubility in solvents other than DMSO, rendered it unsuitable for further study. To assess the effects of the anions on receptors 1 to 3, an excess of each salt was added and the shifts of the absorption bands determined in acetonitrile (). As expected, receptors incorporating the 4-nitrophenyl moiety exhibited the largest shifts.
Table 2. Bathochromic shifts of the main absorption bands of 1 to 3 from the initial λmax shown on addition of excess anion. *Not determined due to overlap of anion and receptor absorbance.
Titrations were then performed with the receptors and TBA salts to address the binding and calculate binding constants. Binding constants were calculated using Bindfit [Citation49], based on a 1:1 model, using the Nedler-Mead method and are summarised in (see ESI for links to data). Inspection of the titration spectra ( and ESI) show that titrations against a number of anions fail to give clear isosbestic points, indicative that the solution contains more species than the ligand and its complex. This is particularly so when an excess of the anion is present. Titration data for 2·F− show a clear isosbestic point up to 1:1 stoichiometry with a clear hypsochromic shift of the entire spectrum at higher anion concentrations suggesting the formation of a new species, potentially the deprotonated receptor. Similar, symmetric urea receptors are known to bind in a 2:1 receptor:anion ratio [Citation27] so binding calculations were also attempted with this stoichiometry. In almost all case, particularly those systems where isosbestic behaviour is observed, the K2:1 values were either nonsensical, e.g. negative, or had errors up to ± 60%. also shows an example of the response towards a weakly binding anion, nitrate, for which an association constant could not be determined.
Figure 3. Examples of UV-visible titration responses of 2: F− (top) and NO3− (bottom).

Table 3. Anion-binding constants calculated from UV-vis titrations for receptors 1-3 in acetonitrile for their respective TBA salts. *Not determined.
Minimal receptor 1, despite having an observable colour change with F− and OH−, exhibits a relatively low binding constant for both. This is consistent with both anion complexation and receptor deprotonation occurring. However, receptor 2 has a very high binding constant with OH− suggesting that complexation, rather than deprotonation, occurs. The data for receptor 3 indicate strong OH− binding but relatively weak F− binding, presumably because the receptor is in the deprotonated form. The result demonstrates discrimination between F− and OH−.
The fluorescent response of receptors 1 to 3 to anions was investigated as the technique is frequently more sensitive than UV-visible methods. When 1 was excited at 335 nm, a broad emission peak appeared at 434 nm. Addition of up to five equivalents of TBA anion salts resulted in an increase in the magnitude of the peak at 434 nm. This was negligible for most anions but significant for F−, H2PO4−, CH3CO2− and OH− with a twofold increase in intensity for the latter. When 2 was excited at 216 nm, an emission peak appeared at 294 nm. For F−, the absorption peak increased fivefold over the same range and sevenfold by the time five salt equivalents had been added. An approximate threefold increase in peak intensity was observed for all other anions, including OH−, when between one and two equivalents of salt had been added (). Significantly, the absorbance intensities of all other anions were almost unchanged after two equivalents of salts had been added. The lack of response of 2 to OH− allows it to function as an indicator of F−.
Figure 4. Fluorescent response of receptor 2 to additions of TBAF (top) and TBAOH (middle) in acetonitrile with a comparison over 5 equivalents of anions (bottom).

Excitation of 3 at 250 nm led to emission at 311 nm which was significantly quenched by OH−, F−, CH3CO2− and I− but unaffected by other anions. The emission peak increased by about one-third on the addition of half an equivalent of OH− but was subsequently quenched as further equivalents were added.
Modelling
Insights into host–guest interactions associated with chemical warfare agents and their breakdown products can often be gained by modelling the complexes involved [Citation11,Citation12,Citation50]. Computational methods were used to predict the likelihood that anion complexation would occur by calculating the Gibbs free energies of the receptors, the anion guests and the corresponding complexes. From these, binding constants could be calculated to identify receptors’ affinities for a range of common anions. Gas phase calculations were chosen as they optimise calculation time and accuracy of result, however, the DFT approach generated binding constants which were far higher than could reasonably be expected. A less rigorous PM6 semiempirical route was taken as we have previously shown gas phase calculations can replicate much higher-level solvated models [Citation51]. Despite their small size, the receptors were conformationally mobile and the predicted lowest energy geometries often changed upon binding to anions. This was taken into account when calculating binding affinities (see ESI Table S1). While the results still yielded large binding constants, they followed the expected trend. As shown in , OH− and F− are predicted to have the highest affinities for all receptors with OH− significantly more strongly bound than F−. This clearly poses a problem for detection of F− as OH− is far more abundant and will be a significant interferent. Overall, binding was predicted to be strongest for squaramide 4 followed by nitrophenylthiourea 2, nitrophenylurea 1 and trifluoromethylphenylurea 3. This is consistent with the observations by Fabbrizzi of greater stability of squaramide-anion complexes over their urea analogues [Citation22] and of the greater acidity of thiourea over urea [Citation21]. The electron withdrawing effect of the trifluoromethylphenyl moiety reduces the acidity of the urea protons and consequently anion binding is predicted to be the lowest all complexes modelled. Regardless of the ligand, the trend for complex formation is predicted to be: OH− >> F− > Br− ≈ Cl− > CH3CO2− > I− > NO3− ≈ H2PO4− > HCO3−.
Table 4. Gibbs’ free energies calculated by PM6.
To investigate the binding behaviour further, receptors 1 - 3 were modelled by DFT along with the two complexes formed by 1; 1·CH3CO2− and 1·HCO3−. Comparisons with the X-ray structures (qv) showed that the models replicated receptor conformations and anion-binding geometries as detailed in .
Table 5. Experimental and computed structural data for receptors 1-3.
Gas phase calculations cannot model the intermolecular interactions but, nevertheless, the DFT geometries replicate the experimental torsion angles well. The N-H distances are slightly overestimated as these are highly susceptible to the effects of crystal packing. Given the good agreement between X-ray and DFT data, the theoretical studies were extended to the fluoride and hydroxide complexes of receptor 1. Both simulations indicated that deprotonation occurred, yielding HF and H2O respectively, rather than the formation of hydrogen bonded complexes, as shown in .
Figure 5. Structures of a) 1·CH3CO2−, b) (1·HCO3−)2, c) 1·F− and d) 1·OH− from DFT calculations.

X-Ray crystallography
Receptor 1
Crystals of the urea receptor formed as colourless blocks and its structure was solved in the monoclinic P21/n space group (). The main intermolecular interactions are asymmetric H-bonds between the urea oxygen and hydrogens of an adjacent molecule. The NH···O distance for the N-methyl proton is 2.216 Å compared to that for the N-phenyl proton of 2.206 Å. The receptor packs in a herringbone pattern with alternating molecules at 60.35° to each other interacting through these NH···O interactions. There are also short contacts between an aromatic proton and adjacent nitro oxygen atom of 2.622 Å as shown in .
Figure 6. Crystal structure of 1 showing the solid-state molecular structure (left) and hydrogen bonding within the crystal structure (right).

Table 6. Single crystal X-ray crystallographic details and parameters for 1, 1·TBA·CH3CO2, 1·TBACO3H, 2 and 3.
1·TBA·CH3CO2·H2O
Crystals of 1·TBA·CH3CO2·H2O formed as colourless blocks and its structure was solved in the triclinic 1space group (). The acetate anions interact with the urea protons with a similar asymmetry to that observed for the hydrogen bonding in the parent receptor with the NH···CH3CO2− distance for the N-methyl proton of 2.010 Å compared to that of the N-phenyl proton of 1.981 Å. These are shorter than observed in Fabbrizzi’s symmetric 1,3-bis(4-nitrophenyl)urea analogue [Citation52] although, perhaps surprisingly, more symmetric. The receptors are arranged in planes, separated by counterions, in an interdigitated head-to-tail manner as shown in . Short contacts between an aromatic proton and adjacent nitro oxygen atom are seen of 2.176 Å with additional interactions between the nitro oxygen atoms and the acetate oxygens at 2.412 Å and a proton on the nBu4N+ α-carbon of 2.622 Å and 2.663 Å.
Figure 7. Solid-state molecular structure from single crystal X-ray diffraction of 1·TBA·CH3CO2·H2O showing hydrogen bonding (left) and crystal packing (right) with TBA counterions removed for clarity.

1. TBA·HCO3·2 H2O
A solution of the urea receptor was mixed with an equimolar solution of TBAF·3 H2O in acetonitrile and left for several weeks whereupon green crystals formed. The structure solved not as the fluoride complex, as expected, but as the hydrated hydrogen carbonate complex.
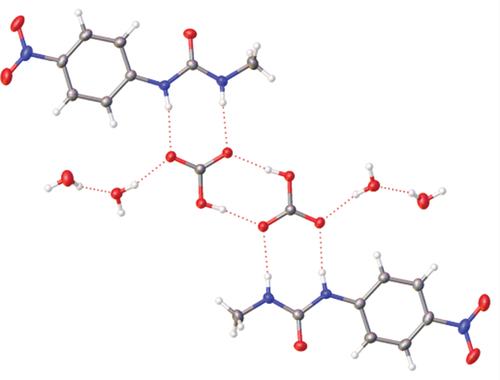
1·TBA·HCO3·2 H2O crystallises with two water molecules and its structure was solved in the triclinic 1space group (). The anion binds with the NH···O2COH distance for the N-methyl proton of 1.989 Å compared to that of the N-phenyl proton of 1.97 Å. As in Fabrizzi’s example, two HCO3− anions form hydrogen bonded dimers with O···HO interaction of 1.743 Å. Additional stability comes from hydrogen bonds between the HCO3− anions and water molecules at 1.944 Å and 1.946 Å as shown in .
Figure 8. Crystal structure of 1·TBA·HCO3·2 H2O showing hydrogen bonding (left) and the (HCO3−)2 dimer (right) with TBA counterions removed for clarity.

Receptor 2
Thiourea receptor 2 crystallised as yellow blocks and its structure was solved in the monoclinic P21/n space group (). Unlike 1, or its complexes, receptor 2 adopted an anti-orientation of the NH groups in the thiourea motif which allowed CS···HN hydrogen bonds to form and generate dimeric assemblies with S···HN interactions of 2.504 Å. A similar orientation preference for the thiourea was observed when modelling this and other [Citation53] anion receptors. As shown in , receptor 2 packs with alternating molecules at 74.16° to each other interacting through the NH···S contacts but with a torsion angle between the methyl carbon and the NH hydrogen adjacent to the nitrophenyl ring of 4.77°. The equivalent torsion angle in free receptor 1 is 176.97°.
Figure 9. Crystal structure of 2 showing the solid-state molecular structure (left) and intermolecular hydrogen bonding within the crystal structure (right).

Receptor 3
Trifluoromethyl receptor 3 was obtained as colourless lath-shaped crystals and its structure was solved in the monoclinic P21/n space group (). Receptor 3 packs in a similar fashion to 1 with a herringbone motif in which the planes of molecules are at 74.73° to each other. The NH···O interactions are, as expected, asymmetric with the N-methyl proton at 2.095 Å and the N-phenyl proton at 2.169 Å as shown in .
Figure 10. Crystal structure of 3 showing the solid-state molecular structure (left) and hydrogen bonding within the crystal structure (right).

Discussion
Preliminary modelling of the receptor complexes with common anions indicated that F− and OH− were bound most strongly by 1 and 2. The data agreed with spectroscopic observations where the most intense colour changes occurred for those anions. Squaramide receptor 4 gave a range of often intense colour changes with all species tested with no single colour seemingly indicative of a specific anion.
Binding constant determinations, however, revealed that something more complex was occurring. In acetonitrile it was found that F− and OH− were the most weakly bound by 1 with H2PO4− and OH− the most weakly bound by 2. Furthermore, our, and others’ [Citation52,Citation54,Citation55], inability to isolate a F−-urea complex suggests that F− binds and then rapidly deprotonates urea- and thiourea-containing receptors. This is consistent with the significant colour changes observed yet small binding constants determined.
The unexpected isolation of 1·TBA·HCO3·2 H2O from the reaction of 1 with TBAF·4 H2O has precedence in the literature. During spectroscopic studies, F− binding and subsequent deprotonation is observed through changes in colour over 24 hours. It appears that over an extended time period, the liberated F− or HF initiates a reaction with CO2 to give [FCO2]−. This phenomenon has been observed by others attempting to isolate F− complexes of urea-containing ligands and is consistent with a mechanism initiated by deprotonation by F−:
LH2 + TBA+F− → TBA+ + LH− + HF
Addition of atmospheric carbon dioxide forms [FCO2]− as first demonstrated by Seppelt [Citation56]:
TBA+ + LH− + HF + CO2 → TBA+ + LH2 + FCO2−
A water molecule from the hydrated F− source, TBAF·3 H2O, then reacts to form HCO3− as proposed by Rossi and von Helden [Citation57]:
TBA+ + LH2 + FCO2− + H2O → TBA+ + LH2 + HCO3− + HF
Finally, HCO3− binds to the minimal receptor.
TBA+ + LH2 + HCO3− → TBA+ [LH2·HCO3−]
It is this TBA+ [LH2·HCO3−] complex which ultimately crystallises. Martínez-Máñez and Rurack propose a similar mechanism for their diazo dye which incorporates urea as a binding site for HCO3− [Citation58] although, in that instance, it is assumed that F− first deprotonates the urea and the latter reacts with atmospheric carbon dioxide and water to form HCO3−. An almost identical outcome was observed by Fabbrizzi, when reacting a 1,3-bis(4-nitrophenyl)urea analogue [Citation52] with TBAF·4 H2O, and Das reported the X-ray structure of a carbonate complex formed upon the addition of TBAF·4 H2O to a tren-based tris(4-nitrophenyurea) podand [Citation54]. Das later reported that reaction of linear bis(4-nitrophenyurea) receptors derived from 1,2- and 1,3-diaminobenzene with TBAF·4 H2O crystallised as the HCO3− complexes in which the anion was trapped as the (HCO3)2 dimer [Citation55]. Previous authors have assumed that the source of CO2 was atmospheric but, to test this, ethyl acetate solutions of receptor 1 and TBAF·3 H2O were left under a dry ice-generated atmosphere of CO2 (see ESI). A yellow precipitate formed overnight, rather than several weeks required for the X-ray quality crystals, with NMR spectra consistent with 1·TBA·HCO3·2 H2O. It has been shown that increasing CO2 concentration can increase the rate of carbonate formation in a series of lanthanide complexes [Citation59,Citation60] and the presence of a peak in the13C NMR at 161.29 ppm is in excellent agreement with the values reported by Pironti et al. for NaHCO3 and NH4HCO3 at 161.20 ppm and 160.94 ppm, respectively [Citation61]. As there was no deliberate addition of CO2 when forming 1·TBA·HCO3·2 H2O crystals, we concur with the literature consensus that its source was atmospheric. The deprotonation of urea- and thiourea-containing receptors by both F− and OH−, as illustrated above and noted by others, makes the definitive detection of F− difficult. Fortunately, we have found that the concentration-dependent fluorescent response of receptor 2 towards F− was significantly different to its response to OH− above two equivalents of their TBA salts.
In summary, we have shown that the minimal urea and thiourea receptors 1 and 2 bind to a range of anions but are deprotonated by both F− and OH− and give a colorimetric response. Receptor 3 is deprotonated by F− but not OH−, however, this is not discernible by the naked eye. Deprotonation of 1 by F− ultimately results in the formation of its bicarbonate complex as determined by X-ray crystallography in agreement with observations of others and our own DFT calculations. Fluorescence spectroscopy revealed that emission of 2 reaches a maximum at two equivalents of anions, of all those studies, except for F− where it continues to increase with increasing addition of TBAF allowing the receptor to give a F−-specific response.
Supplemental Material
Download PDF (2.5 MB)Acknowledgments
This work was supported by the DSTL under contract no. DSTLX-1000143403, the University of Brighton (studentship for BMM) and the EPSRC (studentship for CEVN). We thank the EPSRC UK National Crystallography Service at the University of Southampton for collecting the crystallographic data [Citation62]. CCDC 2292299-2292303 contain the supplementary crystallographic data for this paper. The data can be obtained free of charge from The Cambridge Crystallographic Data Centre via www.ccdc.cam.ac.uk/structures.
Disclosure statement
The authors have no interests to declare.
Supplementary Material
Supplemental data for this article can be accessed online at https://doi.org/10.1080/10610278.2024.2307016
Additional information
Funding
References
- Park CH, Simmons HE. Macrobicyclic amines. III. Encapsulation of halide ions by in, in-1,(K + 2)-diazabicyclo[K.L.M.]-alkane ammonium ions. J Am Chem Soc. 1968;90(9):2431–2432. doi: 10.1021/ja01011a047
- Duke RM, Veale EB, Pfeffer FM, et al. Colorimetric and fluorescent anion sensors: an overview of recent developments in the use of 1,8-naphthalimide-based chemosensors. Chem Soc Rev. 2010;39(10):3936–3953. doi: 10.1039/b910560n
- Gale PA. Structural and molecular recognition studies with acyclic anion receptors. Acc Chem Res. 2006;39(7):465–475. doi: 10.1021/ar040237q
- Suksaia C, Tuntulani T. Chromogenic anion sensors. Chem Soc Rev. 2003;32(4):192–202. doi: 10.1039/b209598j
- Amendola V, Fabbrizzi L, Mosca L. Anion recognition by hydrogen bonding: urea-based receptors. Chem Soc Rev. 2010;39(10):3889–3915. doi: 10.1039/b822552b
- Li A-F, Wang J-H, Wanga F, et al. Anion complexation and sensing using modified urea and thiourea-based receptors. Chem Soc Rev. 2010;39(10):3729–3745. doi: 10.1039/b926160p
- Piepenbrock M-O, Lloyd GO, Clarke N, et al. Metal- and anion-binding supramolecular gels. Chem Rev. 2010;110(4):1960–2004. doi: 10.1021/cr9003067
- Kundu S, Egboluche TK, Hossain AM. Urea- and thiourea-based receptors for anion binding. Acc Chem Res. 2023;56(11):1320–1329. doi: 10.1021/acs.accounts.2c00701
- Evans NH, Beer PD. Advances in anion supramolecular chemistry: from recognition to chemical applications. Angew Chem Int Ed. 2014;53(44):11716–11754. doi: 10.1002/anie.201309937
- Finnegan TJ, Liyana Gunawardana VW, Badjić JD. Molecular recognition of nerve agents and their organophosphorus surrogates: toward supramolecular scavengers and catalysts. Chemistry A European J. 2021;27(53):13280–13305. doi: 10.1002/chem.202101532
- Sambrook MR, Vincent JC, Ede JA, et al. Experimental and computational study of the inclusion complexes of β-cyclodextrin with the chemical warfare agent Soman (GD) and commonly used simulants. RSC Adv. 2017;7(60):38069–38076. doi: 10.1039/C7RA03328A
- Sambrook MR, Gass IA, Cragg PJ. Spectroscopic and inclusion properties of G-series chemical warfare agents and their simulants: a DFT study. Supramol Chem. 2018;30(3):206–217. doi: 10.1080/10610278.2017.1401074
- Davis AB, Lambert RE, Fronczek FR, et al. An activated coumarin−enamine Michael acceptor for CN −. New J Chem. 2014;38(10):4678–4683. doi: 10.1039/C4NJ00862F
- Mia R, Cragg PJ, Fronczek FR, et al. Killing two birds with one stone: phosphorylation by a tabun mimic and subsequent capture of cyanide using a single fluorescent chemodosimeter. New J Chem. 2022;46:21278–21286. doi: 10.1039/D2NJ04014J
- Yang Y-C, Baker JA, Ward JR. Decontamination of chemical warfare agents. Chem Rev. 1992;92(8):1729–1743. doi: 10.1021/cr00016a003
- Amendola V, Fabbrizzi L, Mosca L, et al. Urea-, squaramide-, and sulfonamide-based anion receptors: a thermodynamic study. Chem Eur J. 2011;17(21):5972–5981. doi: 10.1002/chem.201003411
- Wezenberg SJ, Chen L-J, Bos JE, et al. Photomodulation of transmembrane transport and potential by stiff-stilbene based bis(thio)ureas. J Am Chem Soc. 2022;144(1):331–338. doi: 10.1021/jacs.1c10034
- Kaupp G, Schmeyers J, Boy J. Quantitative solid-state reactions of amines with carbonyl compounds and isothiocyanates. Tetrahedron. 2000;56(36):6899–6911. doi: 10.1016/S0040-4020(00)00511-1
- Hunter RF, Parken ER. The unsaturation and tautomeric mobility of heterocyclic compounds. Part 18. The methylation and bromination of a series of 2-p-substituted anilinothiaxoles. J Chem Soc. 1934;1175–1177.
- Rostami A, Colin A, Li XY, et al. NN’-diarylsquaramides: general, high-yielding synthesis and applications in colorimetric anion sensing. J Org Chem. 2010;75:3983–3992. doi: 10.1021/jo100104g
- Gómez DE, Fabbrizzi L, Licchelli M, et al. Urea vs. thiourea in anion recognition. Org Biomol Chem. 2005;3(8):1495–1500. doi: 10.1039/B500123D
- Amendola V, Bergamaschi G, Boiocchi, et al. The squaramide versus urea contest for anion recognition. Chem Eur J. 2010;16(14):4368–4380. doi: 10.1002/chem.200903190
- Niu H, Shu Q, Jin S, et al. A simple ratiometric and colorimetric chemosensor for the selective detection of fluoride in DMSO buffered solution. Spectrochim Acta A Mol Biomol Spectrosc. 2016;153:194–198. doi: 10.1016/j.saa.2015.08.030
- Smith PJ, Reddington MV, Wilcox CS. Ion pair binding by a urea in chloroform solution. Tetrahedron Letters. 1992;33(41):6085–6088. doi: 10.1016/S0040-4039(00)60012-6
- Bose P, Ahamed BN, Ghosh P. Functionalized guanidinium chloride based colourimetric sensors for fluoride and acetate: single crystal X-ray structural evidence of -NH deprotonation and complexation. Org Biomol Chem. 2011;9(6):1972–1979. doi: 10.1039/c0ob00947d
- Pfeifer L, Engle KM, Pidgeon GW, et al. Hydrogen-bonded homoleptic fluoride–diarylurea complexes: structure, reactivity, and coordinating power. J Am Chem Soc. 2016;138(40):13314–13325. doi: 10.1021/jacs.6b07501
- Kirby IL, Pitak MP, Wenzel W, et al. Systematic structural analysis of a series of anion receptor complexes. CrystEngcomm. 2013;15(44):9003–9010. doi: 10.1039/c3ce41503a
- Kirby IL, Brightwell M, Pitak MP, et al. Systematic experimental charge density analysis of anion receptor complexes. Phys Chem Chem Phys. 2014;16(22):10943–10958. doi: 10.1039/C3CP54858A
- Kirby IL, Pitak MP, Wilson C, et al. Electron density distribution studies as a tool to explore the behaviour of thiourea-based anion receptors. Cryst Eng Comm. 2015;17(14):2815–2826. doi: 10.1039/C5CE00213C
- Pupo G, Vicini AC, Ascough DMH, et al. Hydrogen bonding phase-transfer catalysis with potassium fluoride: enantioselective synthesis of β-fluoroamines. J Am Chem Soc. 2019;141(7):2878–2883. doi: 10.1021/jacs.8b12568
- Fujita T, Tsuji H, Deura H, et al. Insect sterilization activity of the 1-methyl-1-nitroso-3-phenylurea derivatives. Agric Biol Chem. 1969;33(5):785–789. doi: 10.1080/00021369.1969.10859381
- Martin H, Dipling AL, Duerr D, et al. Patent DE1802739 (A1) - Neue biozide Mittel. 1969.
- Mohamed M, Gonçalves TP, Whitby RJ, et al. New insights into cyclobutenone rearrangements: a total synthesis of the natural ROS-generating anti-cancer agent cribrostatin 6. Chem: Eur J. 2011;17(49):13698–13705. doi: 10.1002/chem.201102263
- Benenato KE, Kumarasinghe ES, Cornebise M Patent WO2017049245.
- Spartan ’20, Wavefunction Inc., Irvine CA 92612 USA.
- SHELX Sheldrick GM. Crystal structure refinement with SHELXL. Acta Crystallogr Sect C Struct Chem. 2015;71(1):3–8. doi: 10.1107/S2053229614024218
- Scholl R, Holdermann K. Ueber die Einwirkung von Phenylisocyanat auf Methylnitramin. Justus Liebigs Ann Chem. 1906;345(3):376–384. doi: 10.1002/jlac.19063450311
- Scholl R, Nyberg B. Umlagerung des a - Nitro- a - Methyl- b - Phenylharnstoffs in symm. Methyl-Nitrophenylharnstoff. Ber Dtsch Chem Ges. 1906;39(3):2491–2494. doi: 10.1002/cber.19060390323
- Backer HJ, Groot J. Transposition intramoléculaire de nitrophénylsulfonylurées: (Les propriétés du groupe sulfonyle XIII). Recl Trav Chim Pays‐Bas. 1950;69(11):1323–1347. doi: 10.1002/recl.19500691102
- O’Neill RC, Basso AJ Substituted phenyl urea compositions for treating coccidiosis US2787574 (A). 1957.
- Benson WR, Kagan B, Lustig E, et al. Selective carbamylation with methyl isocyanate. J Org Chem. 1967;32(11):3635–3640. doi: 10.1021/jo01286a074
- Ambati NB, Anand V, Hanumanthu P. A facile synthesis of 2-N(methyl amino) benzothiazoles. Synth Comm. 1997;27(9):1487–1493. doi: 10.1080/00397919708006084
- Roecker L, Aiyegbo M, Al-Haddad A, et al. Synthesis and characterisation of [(en)2Co]3+ complexes coordinated by substituted thiourea ligands. Aust J Chem. 2013;66(8):944–951. doi: 10.1071/CH13150
- Arora SK, Banerjee R, Kamboj RK, et al. Patent WO2009109998 (A1) - Novel protein tyrosine phosphatase - Ib inhibitors. 2009.
- Palomo C, Mestres R. Convenient and improved synthesis of unstable carbodiimides. Synthesis. 1981;1981:373–374. doi: 10.1055/s-1981-29454
- Volonterio A, Zanda M. Multicomponent, one-pot sequential synthesis of 1,3,5- and 1,3,5,5-substituted barbiturates. J Org Chem. 2008;73:7486–7497. doi: 10.1021/jo801288s
- Patel HJ, Sarra J, Caruso F, et al. Synthesis and anticonvulsant activity of new N-1’,N-3’-disubstituted-2’H,3H,5’H-spiro-(2-benzofuran-1,4’-imidazolidine)-2’,3,5’-triones. Bioorg Med Chem Lett. 2006;16:4644–4647. doi: 10.1016/j.bmcl.2006.05.102
- Kang SO, Llinares JM, Powell D, et al. New polyamide cryptand for anion binding. J Am Chem Soc. 2003;125(34):10152–10153.
- http://supramolecular.org
- Ede JA, Cragg PJ, Sambrook MR. Comparison of binding affinities of water-soluble calixarenes with the organophosphorus nerve agent Soman (GD) and commonly-used nerve agent simulants. Molecules. 2018;23(1):207. doi: 10.3390/molecules23010207
- Sheehan R, Cragg PJ. Supramolecular chemistry in silico. Supramol Chem. 2008;20:443–451.
- Boiocchi M, Del Boca L, Gómez DE, et al. Nature of urea-fluoride interaction: Incipient and definitive proton transfer. J Am Chem Soc. 2004;126:16507–16514. doi: 10.1021/ja045936c
- Cave H, Ede JA, Sambrook MR, et al. Hydrogen-bonding interactions in crown-(thio)urea complexes with anions, chemical warfare agents and simulants. Supramol Chem. 2019;31(11):703–712. doi: 10.1080/10610278.2019.1659268
- Dey SK, Chutia R, Das G. Oxyanion-encapsulated caged supramolecular frameworks of a tris(urea) receptor: evidence of hydroxide- and fluoride-ion-induced fixation of atmospheric CO2 as a trapped CO32− anion. Inorg Chem. 2012;51:1727–1738. doi: 10.1021/ic2020379
- Manna U, Das A, Das G. Self-assemblies of positional isomeric linear bis-urea ligands with oxyanions/hydrated oxyanions: evidence of F− and OH− induced atmospheric CO2 fixation. Cryst Growth Des. 2018;18:6801–6815. doi: 10.1021/acs.cgd.8b01044
- Zhang X, Gross U, Fluorocarbonate SK. [FCO2]−: preparation and structure. Angew Chem Int Ed Engl. 1995;34:1858–1860. doi: 10.1002/anie.199518581
- Thomas DA, Mucha E, Lettow M, et al. Characterization of a trans–trans carbonic acid–fluoride complex by infrared action spectroscopy in helium nanodroplets. J Am Chem Soc. 2019;141(14):5815–5823. doi: 10.1021/jacs.8b13542
- Ros-Lis JV, Martínez‐Máñez R, Sancenón F, et al. Signalling mechanisms in anion-responsive push-pull chromophores: the hydrogen-bonding, deprotonation and anion-exchange chemistry of functionalized azo dyes. Eur J Org Chem. 2007;2007:2449–2458. doi: 10.1002/ejoc.200601111
- Metal-based carbon dioxide uptake and conversion, Charis E. V. Nathan [ PhD thesis]. University of Brighton; 2022.
- Gass IA, Moubaraki B, Langley SK, et al. A π–π 3D network of tetranuclear μ2/μ3-carbonato Dy(III) bis-pyrazolylpyridine clusters showing single molecule magnetism features. Chem Commun. 2012;48:2089–2091. doi: 10.1039/c2cc16946k
- Pironti C, Cucciniello R, Camin F, et al. Determination of the 13C/12C carbon isotope ratio in carbonates and bicarbonates by 13C NMR spectroscopy. Anal Chem. 2017;89(21):11413–11418. doi: 10.1021/acs.analchem.7b02473
- Coles SJ, Gale PA. Changing and challenging times for service crystallography. Chem Sci. 2012;3:683–689. doi: 10.1039/C2SC00955B