
 ?Mathematical formulae have been encoded as MathML and are displayed in this HTML version using MathJax in order to improve their display. Uncheck the box to turn MathJax off. This feature requires Javascript. Click on a formula to zoom.
ABSTRACT
Background
Preeclampsia (PE) presence could lead to hemodynamic changes. Previous research suggested that morphological parameters based on photoplethysmographic pulse waves (PPGW) could help diagnose PE.
Aim
To investigate the performance of a novel PPGPW-based parameter, falling scaled slope (FSS), in distinguishing PE. To investigate the advantages of the machine learning algorithm over the conventional statistical methods in the analysis.
Methods
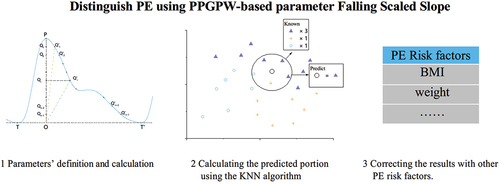
Eighty-one pieces of PPGPW data were acquired for the study (PE, n = 44; normotensive, n = 37). The FSS values were calculated and used to construct a PE classifier using the K-nearest neighbors (KNN) algorithm. A predicted PE state varying from 0 to 1 was also calculated. The classifier’s performance in distinguishing PE was evaluated using the ROC and AUC. A comparison was conducted with previously published PPGPW-based models.
Result
Compared to the previous PPGPW-based parameters, FSS showed a better performance in distinguishing PE with an AUC value of 0.924, the best threshold of 0.498 could predict PE with a sensitivity of 84.1% and a specificity of 89.2%. As for the analysis method, training a classifier using the KNN algorithm had an advantage over the conventional statistical methods with the AUC values of 0.878 and 0.749, respectively.
Conclusion
The result indicated that FSS might be an effective tool for identifying PE. Moreover, the machine learning algorithm could further help the data analysis and improve performance.
Introduction
Preeclampsia (PE) is a multi-system disorder, one of the most hazardous factors leading to maternal and perinatal morbidity and mortality (Citation1,Citation2). The onset of hypertension is the most representative characteristic of PE (Citation1,Citation2). Although the etiology of the disease is not fully clarified, it could affect 5%–8% of the universal pregnancies (Citation1–3). Several factors are regarded as the risk and contributing to the occurrence of PE, including maternal age, parity, prior PE, multiple gestations and obesity (Citation2,Citation4,Citation5). Specifically, PE could have a series of impacts on both patient and infant, resulting in maternal cerebrovascular, cardiac, hepatic, hematologic, and renal complications, sometimes even prematurity and neonatal mortality (Citation2,Citation6). As a result, it is essential to perform accurate PE identification and provide the best care possible (Citation2).
In clinical practice, PE screening usually utilizes the data of the patient risk factors mentioned earlier (Citation1,Citation4,Citation7). However, this method could not reflect any dynamic changes during pregnancy and has limited effects on PE prediction thus. Widely used PE biomarkers help solve these problems to a certain extent, but they usually require expensive and professional medical equipment and quite a long examination time as well (Citation1,Citation8–12). In this condition, it will be more convenient if people develop any noninvasive multi-occasion inspection method for PE diagnosis.
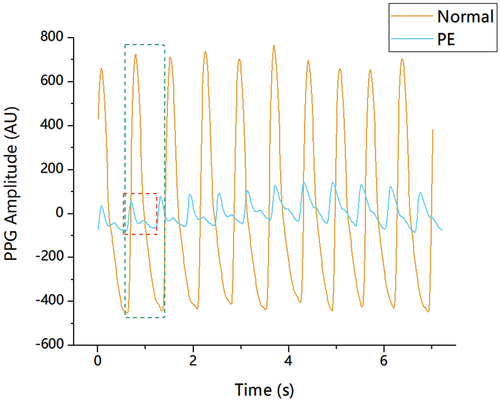
Recently, the photoplethysmographic pulse wave (PPGPW) has been considered a potential noninvasive PE inspection index and has attracted the attention of researchers (Citation13–23). PPGPW could record changes in blood volume noninvasively and continuously, which tends to be concentrated expression of arterial and venous blood interaction with the cardiac, respiratory, and autonomic systems (Citation24). On the other hand, some findings suggest that pregnancy is associated with changes in intravascular volume, cardiac output, and heart rate, a marked decrease in vascular resistance, and a tendency toward decreased mean blood pressure (Citation13,Citation22,Citation25,Citation26). Previous research have made some preliminary clinical explorations and found that the morphology of PPGPW could reflect these changes to a certain extent (Citation14,Citation15). As shown in , there are some obvious morphological distinctions between preeclamptic and healthy patient pulses. Both amplitude and pulse-duration varied for the pulses, and the pulse pattern between peak and minimum value was also dissimilar. Moreover, the presence of PE affected whether the pulses showed the apparent notch point, which is one of the most representative feature points for the pulse. Therefore, it is logical that such morphological distinctions of the pulses should be quantized accurately.
Figure 1. Pulse pattern contrast for preeclamptic and healthy patients. Pulse waveforms from patients with/without PE were drawn in different colours and shapes with magnitudes in arbitrary units (AU). There are obvious differences in amplitude and pulse shape. The notch point is inapparent for the preeclamptic pulse.
Previous research have already proposed some morphological parameters of the PPGPW and analyzed the PE presence using the specific mathematical algorithms and tools. The results of these studies showed the latent capacity of the PPGPW to diagnose/predict PE (Citation16–23). However, these studies used the conventional statistical methods to obtain the conclusions, which means that the original PPGPW data were not utilized at the most. Thus, the following two studies were conducted in this paper. First, a novel PPGPW-based parameter, the falling scaled slope (FSS), was proposed to describe the morphology of the data and distinguish the PE presence. The FSS utilized a set of slopes to demonstrate the PPGPW after locating the specific points in the pulse, and the slope refers to the ratio of the amplitude to the time duration for the pulse. Second, the machine learning (ML) algorithm was utilized to analyze to data involved in this study. ML helped infer significant connections between target items from diverse datasets that are otherwise difficult to correlate (Citation27–29). Compared to conventional methods, ML shows advantages in certain clinical occasions (Citation30–40).
In summary, a trial to analyze PE occurrence was conducted in this study using ML technology with PPGPW-based morphological parameters.
Materials and methods
Data source
Due to the deficiency of the standard dataset that contains the available cases for PE study, an arduous data collection process was compulsory before all the possible research. As a result, all the PPGPW data utilized in this paper were obtained from the Department of Gynaecology and Obstetrics at the Women’s Hospital, Zhejiang University School of Medicine. A cohort study was conducted from June 2017 to April 2019 with 44 PE patient volunteers at gestation weeks 33.1 ± 4.1, and 37 normotensive patient volunteers at gestation weeks 34.8 ± 4.2 served as the contrast group. The approval was obtained from the local Research Ethics Committee (No. 20170131) and so were the informed consents from all the patient volunteers.
Abiding by the broadened definition proposed by the International Society for the Study of Hypertension in Pregnancy, the previously normotensive patient would be assessed as PE cases whose systolic blood pressure (SBP) at ≥140 mmHg and/or diastolic blood pressure (DBP) at ≥90 mmHg on at least two occasions measured 4 h apart and who suffered from new-onset proteinuria, maternal organ dysfunction, and uteroplacental dysfunction at or after 20 weeks of gestation (Citation1). No patients were involved in this cohort study if they suffered from any type of cardiovascular, renal, or other hypertension-associated diseases, especially those with hypercoagulable disorders. Neither multiple gestation patients nor artificial insemination patients were involved in this study.
Data acquirement
The PPGPW data acquisition was performed using the common standard medical monitor CARESCAPE B650 Patient Monitor (General Electric, Boston, USA) with the oxygen sensor (DS-100A Dura sensor, OxiMax, Nellcor Puritan Bennett Inc, USA). The CARESCAPE has been designed to be strong on both the motion artifacts and white noises. Patient volunteers were required to maintain a seated posture throughout the PPGPW acquisition process. After the volunteer took a rest for at least 5 min, the data were obtained from the index finger of the non-dominant hand of the subject for at least 1 min. The PPGPW signals were then exported to PC as [sample time, sample value] pairs in comma-separated-value (CSV) format files for further analysis with a sample rate of 100 Hz and a 12-bit digital resolution.
Pulse pre-processes
Before any analysis began, some pre-processes on the original PPGW data were mandatory. These pre-processes included raw data cleaning to discard data with severe distortions, data filtering to remove noise within the acceptable ranges, and the pulse wave localization and detection using the corresponding algorithm (Citation41,Citation42). Specifically, both manual and auto-code pulse checks were conducted to ensure that all detected pulses were corrected. Finally, the PPGW data were ready for the morphological parameters’ calculation.
Falling scaled slope definition
In this material, FSS was defined as a slope vector to quantify the morphological differences between the PPGPW pulses shown in . helps explain the process of locating specific points when calculating the FSS, and the detailed steps were as follows. For a single PPGPW beat TTY,’ firstly locate the peak point P and its projection O on the baseline TT.’ We then locate points Qi which separate line P into n equal subsections and find the point Qi matching point Qi on the falling part of the pulse with the same amplitude 0Qi (0 ≤ i ≤ n −1). Finally, we calculate the slope of line 0Qi and mark it as Ki. Thus, FSS was presented in the formula:
Figure 2. The diagram of falling scaled slope parameter. The pre-process had already adjusted the baseline TT” to 0. The curve TT” indicated acomplete PPGPW beat. Point P was the peak for the pulse, and Point O was the vertical projection of point P on the baseline. Points separated line OP into n pieces. Points were the matching points of on the PPGPW beat.
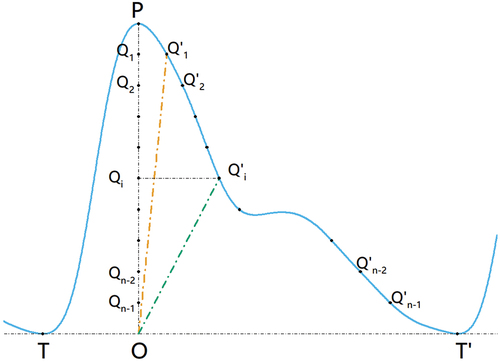
In fact, the slopesKi was the ratio of the amplitude to the time duration for the PPGPW beat TT.’ The subscript n was set to 10 in this research which meant that FSS was a 9-element vector for the subsequent analysis. Specifically, boxes two pulses from the preeclamptic and healthy patients, and the detailed FSS values for them were contrasted in
Table 1. The FSS values contrast for the pulse from the preeclamptic and healthy patients.
Machine learning algorithm
The purpose of FSS calculation is to confirm whether there is any discrepancy between pulses from preeclamptic and healthy patients, which is a binary classification task (PE or normotensive) based on the FSS actually (Citation43). Recently, a series of ML algorithms in the field of computer science were introduced to study the PE classification problem based on different types of data (Citation32–40). In general, depending on whether the data processed any data label or not, ML tasks could be divided into supervised learning and non-supervised learning (Citation43). Obviously, the task above is an instance of supervised learning with the data label “PE presence”, while the FSS values acted as the input data. The ML process could be summarized as utilizing part of the input data to train an ML model based on the specific ML algorithm and utilizing the rest to evaluate the performance of the model using the specific evaluation index. The assessment was often conducted comparing the true label with the predicted label for data not involved in the model training process (Citation43).
After the preliminary screening of our research group, the K-nearest neighbors (KNN), a popular non-parametric supervised ML algorithm, was selected for the classification task (Citation43,Citation44). When training ML models, the KNN makes no assumptions about the underlying data distribution and there is no explicit process for constructing the models in fact. Instead, it classifies new data points based on their similarity to the existing examples. When predicting the data label for a given new input, the algorithm would find a certain number of the “nearest” data points among the existing examples and acquire their data label and then assign the input with the most common class label in the neighbors after a plurality vote. The nearest in the KNN implies the degree of data similarity, which is usually assessed using the distance metric. The K in the KNN refers to the number of nearest neighbors when voting (Citation43,Citation44).
Parameters evaluation
This section provides a more detailed explanation of the supervised ML processing process and the FSS evaluation. First, the pulse rather than the entire PPGW data piece was treated as the basic analysis element for ML processing, which could increase the number of inputs. Second, the FSS value for each pulse was treated as a vector input, and the nine vector elements in the formula.1 were treated as the different features of the input. For the data label of the pulse, the PE presence/absence was set to a logic value of 1/0 consistent with the PE state of the patient the pulse belonged. Third, the input data were divided into training set and test set, and the 5-fold cross-validation strategy was applied to avoid the trained model overfitting the data, which meant that the model learned too much for the given data but behaved poorly for the unseen data (Citation43). Fourth, the training set helped construct the classification model using the KNN, while the test set helped to evaluate it.
Once the ML model has been trained, every random pulse in the test set could be predicted (determined) whether its data label is PE or not. For a random pulse, set the FSS value as the model’s input, the model would generate a logic output 0 or 1. Since the pulse was treated as the basic analysis element, an additional statistic should be performed to obtain the prediction for a specific patient after the prediction value for all of her pulses. The exact amounts of her PE and normotensive pulses could be counted, which could be presented as the ratio of PE pulses to total pulses. Thus, all patients would process a predicted PE state varying from 0 to 1 and an actual PE state of 0 or 1.
Moreover, considering that other possible covariates might contribute to the PE prediction, a binary logistic regression (BLR) analysis was also conducted together with the predicted PE state for further correction.
Statistical analysis
The pre-processes were conducted using the MATLAB (R2018a, The MathWorks, United States). The KNN classifier was constructed using the Anaconda Python (3.6.5, Anaconda, United States) and the scikit-learn package (0.19.1, open-source online) (Citation33). SPSS analysis tools were utilized to quantify and assess the performance of FSS using SPSS Statistics (25.0, IBM, United States). Student’s t-test and the Mann–Whitney U-test were used for categorical variables. The evaluation metric used to validate the models was the Area Under the Curve (AUC) from the Receiver Operating Characteristic Curve (ROC). The BLR was used for all possible covariates, and Hosmer–Lemeshow goodness-of-fit was also conducted for the calibration check. All figures were drawn using Origin Pro (b9.2.272, OriginLab Corporation, United States).
Results
Demographics
The demographic information of the patient volunteers involved is shown in
. It was suggested that there were no clinically significant differences in age, height, gestational week at sampling, and heart rate between healthy patients and those with PE. As expected, preeclamptic patients had significantly higher systolic and diastolic blood pressure when compared to the healthy. Moreover, the weight and body mass index (BMI) between the patients were statistically significant.
Table 2. Demographic and clinical information of control and preeclampsia groups.
The model’s output based on FSS
illustrates the proportion distributions of the model’s output based on FSS for the patient volunteers involved. Intuitively, patients with/without PE tended to be a cluster, which was also proved by the SPSS analysis (p-value less than 0.001). Patients with PE tended to have a more significant predicted portion near 1, whereas those without PE had a smaller one near 0. The AUC and ROC analysis helped quantify how the parameter was affected, as interpreted in and . SPSS suggested that the AUC was 0.924 using the output to predict PE. The optimal portion threshold value for PE classification was 0.498: when the output portion was less than 0.498, PE could be predicted with a sensitivity of 84.1% and a specificity of 89.2%.
Figure 3. Predicted proportion distributions indicating PE based on PPGPW morphological parameters. The distributions generated from parameter CHAR (above) and FSS (below) were contrasted. The red circle represented the predicted output for the preeclamptic and the bluesquare stood for the healthy. The best threshold values for classification were also given. Threshold at 0.557 for CHAR could achieve a sensitivity of 0.818 and a specificity of 0.892, and threshold at 0.498 for FSS could achieve a sensitivity of 0.841 and a specificity of 0.892.
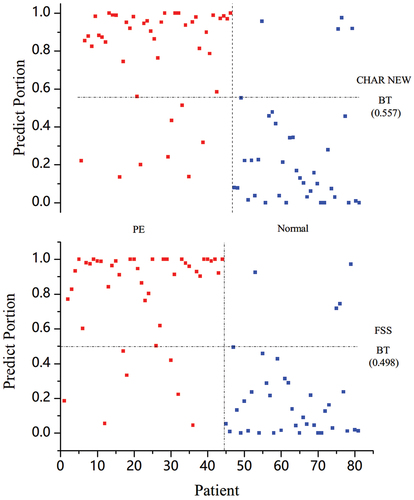
Figure 4. The contrast of ROC indicating PE based on the PPGPW morphological parameters. The AUC values for each parameter were marked in legend.The identity line was also drawn using dash dot.
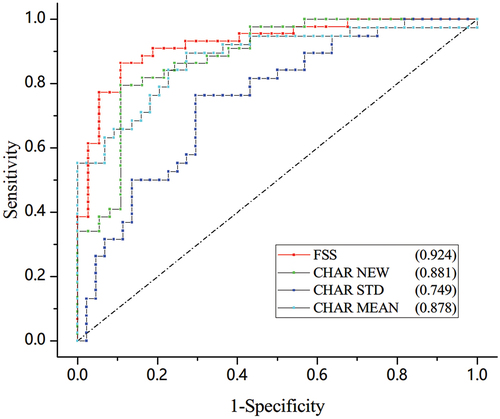
Table 3. Detailed AUC values and thresholds for different models involved.
Parameters contrast
The widely used augmentation index (AIX) was not considered for comparison, as it is derived invasively from the central aortic pulse (Citation18). A comparison was performed to quality FSS between the comparative hierarchical area ratio (CHAR) proposed by our research group earlier (Citation16). As shown in , the KNN classifier based on FSS processed the best performance among all these methods. The AUC of CHAR was calculated following the previous standard-deviation-based and mean-based analysis methods based on the new dataset. As a supplement, we also computed the AUC of CHAR using the KNN classifier. Detailed results can be found in . The SPSS analysis suggested that the AUC was 0.878 when using the mean value of CHAR to indicate PE and the AUC was 0.749 when using the standard deviation. When using the KNN classifier to analyze the parameters, the AUC value was 0.891 for CHAR and 0.924 for FSS.
Binary logistic regression
A BLR was applied to distinguish PE using the portions and the statistically significant demographic information in as covariates, including BMI, SBP, and DBP. The output of the KNN model based on CHAR and FSS, respectively, is contrasted in . The coefficients are given for the covariates involved as well as the calibration results. The p-values of the Hosmer–Lemeshow test for the two BLR models were both above 0.05, which showed that the generated BLR prediction models possessed good calibration capability. P values for the portions of the two models are both statistically significant (both <.001) compared to the p values for BMI (1.000 versus 0.816), SBP (0.062 versus 0.497) and DBP (0.388 versus 0.851). This proved that the PPGPW-based parameter played a more important role in the BLR models.
Table 4. Detailed results for the binary logistic regression and Hosmer–Lemeshow test.
Discussion
Despite all the efforts of previous research, predicting preeclampsia is still challenging due to its high variability from patient to patient and the number of factors involved (Citation1,Citation2,Citation5,Citation6,Citation8–12). This research promoted FSS, a novel morphological parameter of PPGPW, to distinguish PE using the ML method KNN. An ML classifier was trained based on the FSS parameter and would determine whether the PE presence/absence for a patient by outputting a value between 0 and 1. The closer the value got to 1, the more likely the model determined the patient suffered from PE. Meanwhile, it was observed that the patient with/without PE tended to be a cluster for the learned models’ output. Meanwhile, ROC analysis also explained that FSS processed a high sensitivity and specificity in distinguishing PE.
The machine learning
As ML technologies developed, researchers have already explored the possibility to apply them in the analysis of clinical medical problems (Citation27–31), and PE prediction is one of these popular research topics (Citation32–40). In fact, ML helps to identify the key among the large number of influencing factors that may contribute to PE and the potential relationships between these factors and PE, which could be difficult for conventional statistical methods (Citation32–40,Citation43). On the other hand, previous ML studies on PE were usually based on the data of PE risk factors, PE biomarkers, and mRNAs (Citation32–40). These types of data could not be acquired without professional medical devices, and usually cost a great deal at the same time. Furthermore, electrophysiological signals were rarely utilized in these studies. To solve these disadvantages, PPGW-based data were applied to find out the PE presence through ML methods and algorithms. PPG is a common and noninvasive signal in clinical practice and the detection process could be both fast and low-cost (Citation1).
The KNN algorithm
When constructing the ML model based on FSS values in this research, the KNN algorithm was selected as the training method (Citation43,Citation44). As a matter of fact, there are quite a lot of supervised ML algorithms besides KNN. Decision tree (DT) and random forest (RF) were utilized to construct models as well (Citation43–46). Among these three algorithms, the KNN could achieve the best performance when predicting PE. As algorithm comparison was not the focus of our study, the relevant content was not given in the text. On the other hand, the results of our research showed that PE presence might be related to PPGW-based parameters. Therefore, exploring the best algorithm to construct a PE prediction model could be one of the goals for the next stage.
Parameters Effect
The results of our study suggested that FFS, a novel morphological PPGW parameter, is related to PE presence with the help of ML method. Since the ML method could be regarded as a black box model to an extent, the reason why this parameter effect is worthy of further discussion (Citation43). Clinical consultation helped explain that PE might result in hemodynamic changes in the vascular system, including increased vascular stiffness and resistance, mean arterial pressure, and a decrease in small artery compliance and cardiac output (Citation13,Citation22,Citation24–26). Thus, a reasonable explanation is that these parameters defined by area and slope were two-dimensional reflections of the original PPGPW in integrations and ratios. Detailed parameter values quantify the morphological variations of PPGPW and eventually map the hemodynamic changes caused by PE.
Contrast with previous parameters
Our group defined and designed different morphological PPGPW-based parameters concerning arc lengths, angles, and time durations during the primary screening (Citation16). Nevertheless, our previous research also indicated that these simple one-dimensional parameters had limited effects on PE distinguishing PE, and none could produce an AUC value above 0.85. Therefore, we focused on area-based (CHAR) and slope-based (FSS) two-dimensional parameters to quantize the details and trends of a pulse. As shown in , the AUC results suggested that the ML method might make the best use of data, and the novel parameter FSS had an advantage over CHAR to indicate PE. Moreover, as the ratio of PE pulses to total pulses calculated using the KNN classifier is normalized, it could also be regarded as a possibility index that predicts whether the patient suffers from PE. The learned best threshold could be viewed as the tolerance level for pulse aberration.
Contrast with statistically significant factors
As a supplement, a BLR analysis was carried out to find out the roles of the statistically significant factors in our study. As shown in , the Hosmer–Lemeshow test result suggested that the generated BLR prediction model possessed good calibration capability after combining PPGPW-based parameters with statistically significant factors. Moreover, the p-value of the BLR analysis showed the advantages of PPGPW-based parameters in PE distinguishing over SBP, DBP, and BMI. If this conjecture could be confirmed by results based on a larger dataset, the method proposed in this study would be worthy of further research.
Limitations
There were also some limitations throughout this research. The first issue was the insufficiency of data size for the patient records. A larger number of PPGPW records could lead to a more precise and convincing finding. The second question was about the definition and extraction of PPGPW parameters. The models’ evaluation performance could be enhanced if better parameters were designed and set as the input. Last but not least, the research results were based on a single parameter each time. Making full use of the parameter combinations would be the logical emphasis in the next step.
Acknowledgments
The authors wish to express their gratitude and appreciation for the medical staff in the Women’s Hospital School of Medicine Zhejiang University for the PPGPW data acquisition and John K-J. Li, the Distinguished Professor of Biomedical Engineering at Rutgers University (NJ, USA) for the language help.
Disclosure statement
No potential conflict of interest was reported by the author(s).
Additional information
Funding
References
- Poon LC, Shenan A, Hyett JA, et al. The International Federation of Gynecology and Obstetrics (FIGO) initiative on pre-eclampsia: a pragmatic guide for first-trimester screening and prevention. Int J Gynecol Obst. 2019;145(S1):1–10. DOI:10.1002/ijgo.12802
- Jameil NA, Khan FA, Khan MF, et al. A brief overview of Preeclampsia. J Clin Med Res. 2014;6(1):1–7. DOI:10.4021/jocmr1682w
- Koopmans CM, Bijlenga D, Groen H, et al. Induction of labour versus expectant monitoring for gestational hypertension or mild pre-eclampsia after 36 weeks’ gestation (HYPITAT): a multicentre, open-label randomised controlled trial. Lancet. 2009;374(9694):979–988. DOI:10.1016/S0140-6736(09)60736-4
- Yi TM, Argyro S, Poon LC, et al. Multicenter screening for pre-eclampsia by maternal factors and biomarkers at 11–13 weeks’ gestation: comparison with NICE guidelines and ACOG recommendations. Ultrasound Obstet Gynecol. 2017;49(6):756–760. DOI:10.1002/uog.17455
- Duckitt K, Harrington D. Risk factors for pre-eclampsia at antenatal booking: systematic review of controlled studies. BMJ. 2005;330(7491):565–567. doi:10.1136/bmj.38380.674340.E0.
- Rana S, Powe CE, Salahuddin S, et al. Angiogenic factors and the risk of adverse outcomes in women with suspected preeclampsia. Circulation. 2012;125(7):911–919. DOI:10.1161/CIRCULATIONAHA.111.054361
- Wallenburg HCS. Prevention of pre-eclampsia: status and perspectives 2000. EJOG. 2001;94(1):13–22. doi:10.1016/S0301-2115(00)00303-1.
- Zeisler H, Llurba E, Chantranine F, et al. Predictive value of the sFlt-1: pIGF ratio in women with suspected preeclampsia. NEJM. 2016;374(1):13–22. DOI:10.1056/NEJMoa1414838
- Zhu XL, Wang J, Jiang RZ, et al. Pulsatility index in combination with biomarkers or mean arterial pressure for the prediction of pre-eclampsia: systematic literature review and meta-analysis. Ann Med. 2015;47(5):414–422. DOI:10.3109/07853890.2015.1059483
- Poon LC, Maiz N, Valencia C, et al. First-trimester maternal serum pregnancy-associated plasma protein-A and pre-eclampsia. UOG. 2009;33(1):23–33. DOI:10.1002/uog.6280
- Duhig KE, Myers J, Seed PT, et al. Placental growth factor testing to assess women with suspected pre-eclampsia: a multicentre, pragmatic, stepped-wedge cluster-randomised controlled trial. Lancet. 2019;393(10183):1807–1818. DOI:10.1016/S0140-6736(18)33212-4
- Nevalainen J, Korpimaki T, Kouru H, et al. Performance of first trimester biochemical markers and mean arterial pressure in prediction of early-onset pre-eclampsia. Metabolism. 2017;75:6–15. DOI:10.1016/j.metabol.2017.07.004
- Su F, Li Z, Sun X, et al. The pulse wave analysis of normal pregnancy: investigating the gestational effects on photoplethysmographic signals. BIO-Med mater Eng. 2014;24(1):209–219. DOI:10.3233/BME-130801
- Thadhani R, Ecker JL, Kettyle E, et al. Pulse pressure and risk of preeclampsia: a prospective study. Obstet Gynecol. 2001;97(4):515–520. DOI:10.1097/00006250-200104000-00007
- Fava C, Nesta E, Amen G, et al. Vascular function in Preeclampsia. Analysis of digital volume pulse by photoplethysmography. Artery Res. 2010;4(4):183–183. DOI:10.1016/j.artres.2010.10.132
- Feng Y, Drzymalski D, Zhao B, et al. Measurement of area difference ratio of photoplethysmographic pulse wave in patients with pre-eclampsia. BMC Pregnancy Childb. 2018;18(1):1–5. DOI:10.1186/s12884-018-1914-y
- Chen H, Jiang F, Drzymalski D, et al. A novel parameter derived from photoplethysmographic pulse wave to distinguish preeclampsia from non-preeclampsia. Pregnancy Hypertens. 2019;15:166–170. DOI:10.1016/j.preghy.2019.01.005
- Franz MB, Burmann M, Neubauser A, et al. Augmentation index and pulse wave velocity in normotensive and pre-eclamptic pregnancies. AOGS. 2013;92(8):960–966. DOI:10.1111/aogs.12145
- Euliano TY, Michalopoulos K, Singh S, et al. Photoplethysmography and heart rate variability for the diagnosis of preeclampsia. Anesth Analg. 2018;126(3):913–919. DOI:10.1213/ANE.0000000000002532
- Carty DM, Neisius U, Rooney LK, et al. Pulse wave analysis for the prediction of preeclampsia. J Hum Hypertens. 2014;28(2):98–104. DOI:10.1038/jhh.2013.64
- Katsipi I, Stylianou K, Petrakis I, et al. The use of pulse wave velocity in predicting pre-eclampsia in high-risk women. Hypertens Res. 2014;37(8):733–740. DOI:10.1038/hr.2014.62
- Sun XR, Su FG, Chen XL, et al. Doppler ultrasound and photoplethysmographic assessment for identifying pregnancy‑induced hypertension. Exp Ther Med. 2020;19:1955–1960. DOI:10.3892/etm.2019.8405
- Tomsin K, Mesens T, Molenberghs G, et al. Venous pulse transit time in normal pregnancy and preeclampsia. Reprod Sci. 2012;19(4):431–436. DOI:10.1177/1933719111424440
- Alian AA, Shelley KH. Photoplethysmography. Best Pract Res Clin Anaesthesiol. 2014;28(4):395–406. doi:10.1016/j.bpa.2014.08.006.
- Mabie WC, DiSessa TG, Crocker LG, et al. A longitudinal study of cardiac output in normal human pregnancy. AJOG. 1994;170(3):849–856. DOI:10.1016/S0002-9378(94)70297-7
- Duvekot JJ, Cheriex EC, Pieters FAA, et al. Early pregnancy changes in hemodynamics and volume homeostasis are consecutive adjustments triggered by a primary fall in systemic vascular tone. AJOG. 1993;169(6):1382–1392. DOI:10.1016/0002-9378(93)90405-8
- Ghodratigohar M, Ghanadian H, Osman HA. A remote respiration rate measurement method for non-stationary subjects using ceemdan and machine learning. IEEE Sens J. 2020;20(3):1400–1410. doi:10.1109/JSEN.2019.2946132.
- Darcy AM, Louie AK, Roberts LW. Machine learning and the profession of medicine. JAMA. 2016;315(6):551–552. doi:10.1001/jama.2015.18421.
- Obermeyer Z, Emanuel EJ. Predicting the future-big data, machine learning, and clinical medicine. N Engl J Med. 2016;375(13):1216–1219. doi:10.1056/NEJMp1606181.
- Bottaci L, Drew PJ, Hartley JE, et al. Artificial neural networks applied to outcome prediction for colorectal cancer patients in separate institutions. Lancet. 1997;350(9076):469–472. DOI:10.1016/S0140-6736(96)11196-X
- Frizzell JD, Liang L, Schulte PJ, et al. Prediction of 30-day all-cause readmissions in patients hospitalized for heart failure: comparison of machine learning and other statistical approaches. JAMA Cardiol. 2017;2(2):204–209. DOI:10.1001/jamacardio.2016.3956
- Jhee JH, Lee SH, Park Y, et al. Prediction model development of late-onset preeclampsia using machine learning-based methods. PLoS One. 2019;14(8):e0221202. DOI:10.1371/journal.pone.0221202
- Kenny LC, Duun WB, Eills DI, et al. Novel biomarkers for pre-eclampsia detected using metabolomics and machine learning. Metabolomics. 2005;1(3):227–234. DOI:10.1007/s11306-005-0003-1
- Martínez-Velasco A, Martínez-Villaseñor L, Miralles-Pechuán L. Machine learning approach for pre-eclampsia risk factors association. Goodtechs’18: International Conference on Smart Objects and Technologies for Social Good;2018 Nov 28-30; Bologna, Italy.
- Aljameel SS, Alzahrani M, Almusharraf R, et al. Prediction of preeclampsia using machine learning and deep learning models: a review. NDPI. 2023;7(1):1–18. DOI:10.3390/bdcc7010032
- Wang H, Zhang ZY, Li HC, et al. A cost-effective machine learning-based method for preeclampsia risk assessment and driver genes discovery. Cell Biosci. 2023;13(1):1–12. DOI:10.1186/s13578-023-00991-y
- Ansbacher-Feldman Z, Syngelaki A, Meirim H, et al. Machine-learning-based prediction of pre-eclampsia using first-trimester maternal characteristics and biomarkers. Ultrasound Obstet Gynecol. 2022;60(6):739–745. DOI:10.1002/uog.26105
- Simbolon O, Widyawati MN, Kurnianingsih K, et al. Predicting the risk of preeclampsia using soft voting-based ensemble and its recommendation. 2020 International Symposium on Community-Centric Systems; 2020 Sep 23-26; Tokyo, Japan.
- Jiang M, Wang Y, Fu Q, et al. Preeclampsia risk prediction model for Chinese pregnant patients with systemic Lupus Erythematosus. Arthritis Care Res. 2020;72(11):1602–1610. DOI:10.1002/acr.24265
- Yoffe L, Gilam A, Yaron O, et al. Early detection of preeclampsia using circulating small non-coding RNA. Sci Rep. 2018;8(1):1–12. DOI:10.1038/s41598-018-21604-6
- Awodeyi AE, Alty SR, Ghavami M. On the filtering of photoplethysmography signals. IEEE 14th International Conference on Bioinformatics and Bioengineering. 2014 Nov 10-12, Boca Raton, FL, USA.
- Wei C, Sheng L, Hua GL, et al. Study on conditioning and feature extraction algorithm of photoplethysmography signal for physiological parameters detection. 4th International Congress on Image and Signal Processing; 2014 Oct 15-17; China, Shanghai.
- Pedregosa F, Varoquaux G, Gramfort A, et al. Scikit-learn: machine learning in python. JMLR. 2011;12(85):2825–2830.
- Altman NS. An introduction to kernel and nearest-neighbor nonparametric regression. Am Stat. 1992;46(3):175–185. DOI:10.1080/00031305.1992.10475879.
- Utgoff PE. Incremental induction of decision trees. Mach Learn. 1989;4(2):161–186. doi:10.1023/A:1022699900025.
- Ho TK. Random decision forests. Proceedings of the 3rd International Conference on Document Analysis and Recognition; 1995 Aug 14-16, Montreal, Canada.