
ABSTRACT
Background
Preeclampsia (PE) mainly occurs in pregnant women and is hereditary. Several genome-wide association studies (GWAS) on Caucasian samples have reported some gene loci that are associated with preeclampsia. However, these studies have not reached consistent conclusions. No previous GWAS has examined preeclampsia in the Chinese Han population.
Method
This study aimed to identify common genetic variations associated with preeclampsia in the Chinese Han population through two-stage case‒control studies. The discovery cohort included 92 patients with severe preeclampsia and 187 healthy controls. The validation cohort included 52 patients with preeclampsia and 104 controls. A genome-wide association study was performed to identify putative preeclampsia genes in the discovery cohort, with validation in the validation cohort.
Results
In the discovery cohort, GWAS demonstrated that 19 single-nucleotide polymorphisms (SNPs) were associated with preeclampsia (P < 10−5). The pathway analysis revealed that these 19 SNP representative genes were mainly enriched in the adenylyl cyclase-inhibiting G-protein coupled receptor signaling pathway. After validation in the validation cohort, rs13176432 and rs13210237 remained closely related to preeclampsia (P<0.05). In the combined data set, the frequency of the G allele in rs13176432 was significantly higher in cases with preeclampsia than in controls (P = 5 × 10⁻⁶). The frequency of the A allele in rs13210237 was higher in the preeclampsia group (P = 8 × 10⁻⁶). The rs13210237 representative genes include HSF2 and GJA1, while the rs13176432 representative gene is TRIM36. There were no differences in genotype distribution between the early-onset and late-onset preeclampsia groups (P > 0.05). Furthermore, rs13210237 and rs13176432 were related to preeclampsia in the adjusted regression model (P < 0.000).
Conclusion
In this study of two independent cohorts, we found that rs13210237 and rs13176432 might be novel preeclampsia-susceptible genetic factors in the Han population in China. However, there was no association between the onset of preeclampsia and these genotypes.
Graphical abstract
Preeclampsia is a devastating disease for pregnant women, with an incidence rate of approximately 5% (Citation1). This disease severely impacts maternal health and could cause renal failure, liver injury, intracranial hemorrhage, pulmonary edema and even death. For perinatal infants, preeclampsia may also cause premature delivery or intrauterine growth restriction.
To date, the pathogenesis of preeclampsia remains unclear. Previous studies have shown that preeclampsia has a characteristic of familial aggregation (Citation2,Citation3), indicating that genetic factors may play an important role in preeclampsia. Numerous genome-wide association studies (GWAS) in preeclampsia have found some candidate risk genes, such as STOX1 (Citation4) and ACVR2A (Citation5). However, GWAS results are not replicable due to the distinction of study design and ethnic background (Citation6,Citation7). More importantly, no GWAS data are available for Chinese patients with preeclampsia. Several studies have verified specific preeclampsia loci in Western populations in Chinese populations, but very few susceptible sites have been verified (Citation8,Citation9), suggesting that Chinese preeclampsia patients may have their own genetic features.
In this project, we enrolled patients with preeclampsia from a large-scale community-based Chinese Han population and performed two-stage case‒control studies to identify novel genetic risk loci for preeclampsia.
Subject and method
Study subjects
All participants were recruited from 19 community hospitals in Tianjin, a city in northern China. From 1 November 2016, to 30 May 2018, we enrolled 5809 pregnant women with pregnancy outcomes and identified 147 preeclampsia patients. These preeclampsia patients were divided into “discovery” and “validation” cohorts. Specifically, the discovery cohort included 95 severe preeclampsia patients and 190 normal pregnant women, case‒control matching was performed by age, height and weight at a ratio of 1:2. The validation cohort included 52 preeclampsia patients and 104 normal pregnant women same as before. Each of the participants signed an informed consent form, and this study was approved by the Ethics Committee of Armed Police Logistics College.
All pregnant women were recruited during the 11 ~ 13 weeks after pregnancy, and simultaneously collecting venous blood.The subjects were excluded if they refused to sign the informed consent, planned to terminate the pregnancy, had primary hypertension or communication difficulty or neurological disorder, or had congenital heart disease or connective tissue disease. preeclampsia is determined by increased blood pressure (gestational blood pressure elevation) accompanied by proteinuria after 20 weeks of gestation. High gestational blood pressure was defined as a blood pressure ≥140 mmHg systolic or ≥90 mmHg diastolic in a woman who was normotensive before 20 weeks of gestation. Severe preeclampsia was diagnosed based on the following criteria: blood pressure ≥160 mmHg systolic or ≥110 mmHg diastolic; proteinuria of ≥3.0 g in 24 hours (2+ or 3+ on qualitative examination), which should occur for the first time during pregnancy and regress after delivery; increased serum creatinine levels (>1.2 mg/dL unless known to be previously elevated); platelet count < 100,000 cells/mm3; evidence of microangiopathic hemolytic anemia (with increased lactic acid dehydrogenase concentration); elevated hepatic enzyme levels (either alanine aminotransferase, aspartate aminotransferase, or both); patient reports of persistent headache or other cerebral or visual disturbances; and patient reports of persistent epigastric pain.
GWAS for exploring genotypes of preeclampsia
Collection and extraction of samples and DNA preparation
A total of 5 mL peripheral venous blood was drawn from each participant, placed in a pro-coagulation tube, centrifuged for 10 min at 2500 rpm and stored in a −80°C refrigerator until use. The procedure was completed within one hour.
DNA extraction
Genomic DNA was extracted using an OMEGA Blood DNA Kit (Cat# D3392–02, OMEGA) following the manufacturer’s instructions. Potential RNA contamination was removed by RNaseA (Cat#19101, QIAGEN, GmBH, Germany). We used a Nano Drop (Cat#ND-2000, Thermo Fisher, Waltham, MA, US) and performed 1% agarose gel electrophoresis to check the quantity and quality of purified DNA.
DNA amplification, fragmentation and precipitation, drying, resuspension and QC
Total genomic DNA (200 ng) was amplified and randomly fragmented into 25 to 125 base pair (bp) fragments. These fragments are purified, resuspended, and hybridized to Axiom Array Plates. Quantitation and fragmentation QC checks were performed by NanoDrop-2000 and E-Gels.
Chip hybridization
Hybridization buffers were prepared, and array hybridization was performed according to the Affymetrix Axiom 2.0 Assay Manual Workflow (Cat# 901758, Affymetrix, Santa Clara, CA, US). Manual Preparation of Ligation, Staining, and Stabilization Reagent Trays for the GeneTitan MC Instrument. The instrument will automatically complete the array hybridization and washing steps.
Data acquisition
The CEL file is added to the Axiom™ Analysis Suite software after processing the DNA chips. The Summary window tab displays a summary snapshot of the analysis, including detailed threshold values and tables based on the analysis.
Data quality control
Before analysis, the following quality control and filtration options were available: (1) removal of sites with a successful typing rate of less than 90% (the call rate of sites < 90%), the removal of sites with a minimal gene frequency of less than 0.001, the removal of sites inconsistent with Hardy-Weinberg equilibrium (1 × 10⁻⁶), or the removal of SNPs on X, Y and linear chromosomes; (2) Plink 1.07 software was used to calculate the identity by state (IBS) between two sites; and (3) Plink 1.07 software was used for principal component analysis (PCA) to ensure good case‒control matching without any population stratification.
Validation method
Multiplex PCR and sequencing
A panel that contains 19 target SNP sites was designed. Library preparation was performed by two-step PCR. The first round of PCR was set up as follows: DNA (10 ng/μl) 2 μl; amplicon PCR forwards primer mix (10 μM) 1 μl; amplicon PCR reverse primer mix (10 μM) 1 μl; 2×PCR Ready Mix 15 μl (total 25 μl) (Kapa HiFi Ready Mix). The plate was sealed, and PCR was performed in a thermal instrument (Bio-Rad, T100TM) using the following program: 1 cycle of denaturing at 98°C for 5 min; the first 8 cycles of denaturing at 98°C for 30 s, annealing at 50°C for 30 s, and elongation at 72°C for 30 s; then, 25 cycles of denaturing at 98°C for 30 s, annealing at 66°C for 30 s, and elongation at 72°C for 30 s; and a final extension at 72°C for 5 min. Finally, the PCR products were checked using electrophoresis in 1% (w/v) agarose gels in TBE buffer (Tris, boric acid, EDTA) stained with ethidium bromide (EB) and visualized under UV light. Then, we used AMPure XP beads to purify the amplicon product. Afterwards, the second round of PCR was performed. PCR was set up as follows: DNA (10 ng/μl) 2 μl; universal P7 primer with barcode (10 μM) 1 μl; universal P5 primer (10 μM) 1 μl; 2× PCR Ready Mix 15 μl (total 30 μl) (Kapa HiFi Ready Mix). The plate was sealed, and PCR was performed in a thermal instrument (Bio-Rad, T100TM) using the following program: 1 cycle of denaturing at 98°C for 3 min, then 5 cycles of denaturing at 94°C for 30 s, annealing at 55°C for 20 s, elongation at 72°C for 30 s, and a final extension at 72°C for 5 min. Then, we used AMPure XP beads to purify the amplicon product. The libraries were then quantified and pooled. Paired-end sequencing of the library was performed on HiSeq XTen sequencers (Illumina, San Diego, CA).
Data QC and SNP calling
Raw reads were filtered according to two steps: 1) adaptor sequences were removed if reads were contained by cutadapt (v 1.2.1); 2) low-quality bases were removed from reads 3’ to 5’ (Q < 20) by PRINSEQ-lite (v 0.20.3); and the remaining clean data were mapped to the reference genome by BWA (version 0.7.13-r1126) with default parameters. Samtools (Version: 0.1.18) was used to calculate each genotype of the target site. ANNOVAR (16 April 2018) was used to detect genetic variants.
Statistical analysis
GWAS statistical analysis and data drawing: SNP numbers, chromosome numbers, physical locations and P values in the genome-wide Cochran-Armitage test for trend were entered in R software (version 4.1.0, https://www.R-project.org) to generate chromosome maps and quantile‒quantile plots for genome-wide association analysis; the chi-square test results for trend of SNPs in all regions generated chromosome maps for corresponding regions; a statistical analysis was made for test data by SPSS (version 26.00, Armonk, NY: IBM Corp), and the R x C contingency table chi-square test was conducted to compare the genotype and allele frequency, which was expressed by odds ratio (OR) and 95% confidence interval (CI). The obtained data were checked to determine whether they conformed to the Hardy-Weinberg genetic equilibrium law. The analysis revealed that these data were all significantly different, with P values less than 0.05. The GO analysis was completed using Kobas software.
Results
Entry process and clinical characteristics
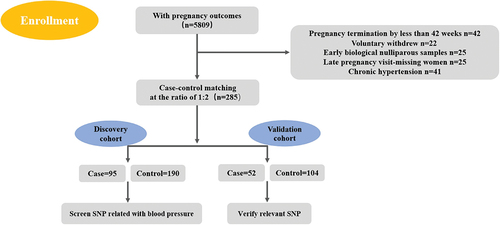
shows the entry process of all cases and controls for this project. We enrolled 5809 pregnant women with pregnancy outcomes from the community population, of whom 42 women terminated the pregnancy at less than 20 weeks and 22 women voluntarily withdrew. Twenty-five early biological nulliparous samples were available, and 25 late-pregnancy women missed the follow-ups. For the discovery cohort, cases and controls were matched by age, height and weight at a ratio of 1:2 (95 cases and 190 controls). During the subsequent GWAS analysis, there were three patients and three controls with a call ratio less than 90%. After removal of these six samples, 92 patients and 187 controls were finally included in the discovery cohort. Case‒control matching was performed by age, height and weight at a ratio of 1:2, and 52 cases were included in the case group and 104 controls in the control group.
Figure 1. Flow chart of the study subject recruitment process.
In the discovery cohort, there were no obvious differences between the case group and control group regarding age, height or weight. The initial red blood cell count, total protein, albumin, fasting blood glucose and systolic blood pressure on the 42nd day after delivery in the case group were all higher than those in the control group, while creatinine, gestational weeks before delivery, newborn weight and newborn length were lower than those in the control group ().
Table 1. Summary of patient characteristics in discovery cohort.
In the validation cohort, there were no obvious differences between the case group and the control group regarding age, height or weight. The gravidity, parity, gestational weeks before delivery, and newborn weight in the case group were lower than those in the control group, while the initial systolic blood pressure, initial diastolic blood pressure, systolic blood pressure and diastolic blood pressure on the 42nd day after delivery were higher than those in the control group ().
Table 2. Summary of patient characteristics in validation cohort.
GWAS results
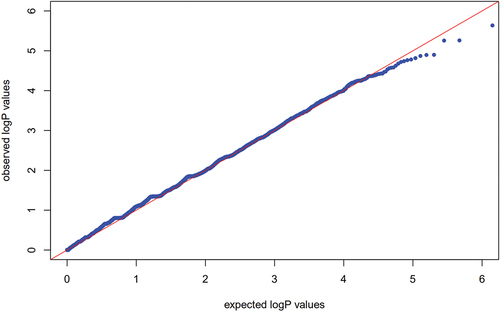
The 95 preeclampsia patients and 190 controls in the discovery cohort were genotyped by an Affymetrix Axiom 2.0 Assay chip. After quality control, the call rate of three patients and three controls was less than 90%. After removing these six samples, GWAS was performed for the remaining 92 patients and 187 controls. PCA showed that there was no population stratification between the case group and the control group (Fig. S1). Q‒Q plot analysis indicated that the observed distribution of p values for genotyped SNPs exhibited minimal deviation from the expected distribution (). In total, the frequencies of 19 SNPs were significantly different between the cases and controls (P < 10−5 and ). GO enrichment analysis indicated that preeclampsia-related genes were mainly enriched in the adenylate cyclase-inhibiting G-protein coupled receptor signaling pathway ().
Figure 2. Q‒Q plots with P values under the expected zero distribution relative to theoretical P values.
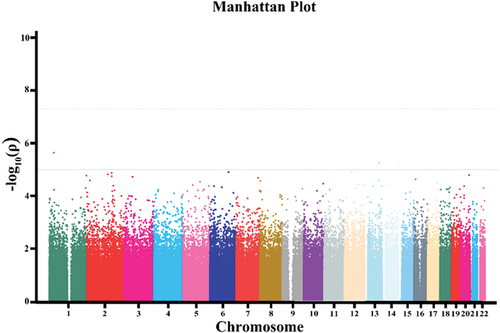
Figure 3. Manhattan chart at the preliminary GWAS discovery stage of severe preeclampsia.
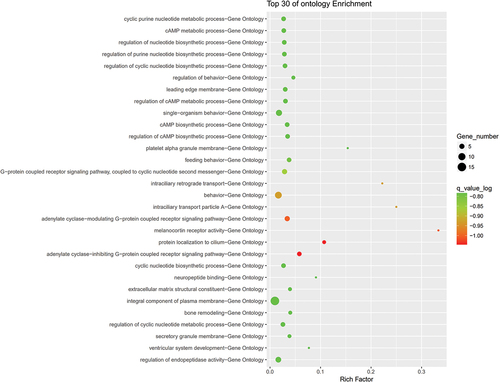
Figure 4. GO bubble analysis regarding preeclampsia-related pathways.
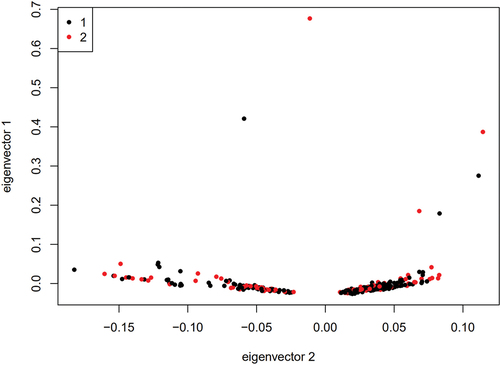
Table 3. The initial GWAS result in the discovery stage.
Validation cohort
To verify the initial screening result of genome-wide genotyping, 19 SNPs discovered in the discovery cohort were verified in the independent validation cohort. The minor allele frequency of rs886043316 was 0 in both the case group and the control group, so this SNP was removed. The verified results of the remaining 18 SNPs are shown in . We found that two SNPs (rs13176432 and rs13210237) were still associated with preeclampsia at the validation stage (P < 0.05). We combined the results of the discovery cohort and validation cohort, and two SNP sites were more significantly different in the combined cohort, namely, rs13176432 (P = 5 × 10⁻⁶) and rs13210237 (P = 8 × 10⁻⁶). Therefore, these two sites are newly discovered genetic susceptibility sites associated with the morbidity of preeclampsia in the Chinese Han population.
Table 4. SNP screened from validation cohort.
After two-stage verification, rs13176432 and rs13210237 were significantly associated with preeclampsia in the Chinese Han population. The mutation site of rs13176432 is G, and the morbidity risk of preeclampsia with the G allele is 2.054 times that of the control group (95% CI: 1.315–3.209). The mutation site of rs13210237 is A, and the morbidity risk of preeclampsia with the A allele is 1.431 times that of the control group (95% CI: 1.179–1.736) ().
Table 5. Consolidation calculation of two stages.
Genotype distribution with preeclampsia onset
Preeclampsia was defined as early or late onset based on the onset time; onset before 34 weeks was defined as early-onset preeclampsia (n = 33), and onset after 34 weeks was defined as late-onset preeclampsia (n = 111). Comparing genotypes between early-onset and late-onset preeclampsia, there was no difference between the early-onset and late-onset preeclampsia genotypes. ()
Table 6. Comparison of genotypes between early-onset and late-onset preeclampsia.
The role of rs13210237 and rs13176432 in preeclampsia
According to multivariate logistic regression including the demographic and clinical characteristics (), rs13210237 (dominant mode) and rs13176432 (dominant mode) were related to preeclampsia (), with ORs of 3.138 (95% CI 1.873–5.256) and 5.867 (95% CI 2.662–12.932), respectively.
Table 7. The demographic and clinical characteristics of PE patients and controls.
Table 8. Multiple logistic regression analysis.
Discussion
By GWAS technology, genetic mutation sites highly associated with the morbidity of preeclampsia were screened from preeclampsia women among the Han population of China (refer to for details). On this basis, enrichment analysis was conducted for the genes at the above conformed preeclampsia-associated SNP sites to elucidate the mechanism of action of the genes at SNP sites during the morbidity of preeclampsia. Multiple RCR technologies were adopted to verify the positive SNP sites from the population during GWAS (rs13176432, rs13210237) to obtain statistically significant preeclampsia-associated SNP sites; after enrichment analysis, adenylate cyclase-inhibiting G-protein coupled receptor protein signaling pathways could possibly participate in preeclampsia pathogenesis (Citation10).
Based on this study, we found two SNPs associated with preeclampsia in the Han population in China. rs13176432 is located in area 1 and zone 3 of the No. 5 short chromosome arm and belongs to an intron. The associated gene is a ubiquitin ligase gene (tripartite motif-containing 36, TRIM36), which plays an important role in trophoblast autophagy (Citation11). During autophagy extension and closure, for example, Atg8 (autophagy proteins, Atg8 protein family in mammals: LC3A, LC3B, LC3C, etc.) is required for the extension of phagosomes and the closure of autophagic phagosomes. The terminal C of LC3 (microtubule-associated protein 1 light chain 3 family protein) is combined with the Atg12-Atg5-Atg16L complex, which participates in the formation of autophagosomes (Atg12 is first activated by ubiquitin ligase and then forms a complex with Atg5; subsequently, Atg5-Atg12 is combined with Atg16 containing the coiled-coil domain protein to form a multisubunit protein complex) (Citation12). Atg8 protein participates in the extension and closure of the phagosome membrane and finally forms a double-membrane autophagic phagosome (Citation12). Therefore, ubiquitin ligase abnormalities resulting from genetic factors will directly affect autophagy inhibition or excessive autophagy in cells. These two factors have been reported to induce the occurrence of preeclampsia. For example, when cell autophagy occurs, the infiltration capacity of extravillous trophoblasts cells (EVTs) decreases, resulting in the shallow implantation of the placenta and then inducing preeclampsia (Citation13). It has been reported that preeclampsia can also occur when the placental microenvironment, such as oxidative stress, induces excessive autophagy of trophoblast cells or endothelial cells (Citation14).
rs13210237 is located in area 1 and zone 2 of the No. 6 short chromosome arm, and the corresponding gene is heat shock transcription factor 2 (HSF2). Placental trophoblast cells produce a series of stress proteins under oxidative stress, of which heat shock protein (HSP), as a molecular chaperone, is synthesized by biological cells after the destructive stimuli of pathogens and physical and chemical factors (Citation15). In a previous report, the expression of several HSPs was too high or low in the preeclampsia patient’s placental or maternal blood (Citation16). For example, HSP70 shows a high expression status in preeclampsia patients’ maternal blood, while HSP90 shows low expression. These abnormal expressions are possibly caused by the abnormity of heat shock transcription factors (Citation16).
Another gene associated with the rs13210237 site is gap junction protein alpha 1 (GJA1), which corresponds to the gap junction protein. The cell gap junction, also called the gap junction, is the only pathway among adjacent cells and makes the cytoplasm couple adjacent cells to regulate the differentiation and development of cells (Citation17). In recent years, studies have shown that the gap junction plays an important role in cell apoptosis and survival (Citation18). The balance of placental cell proliferation and apoptosis is the basis for the placenta, while the disorder of cell apoptosis will lead to pathological pregnancy, such as hypertension during pregnancy (Citation19). Studies have shown that the quantity of apoptotic placental trophoblasts, syncytiotrophoblast cells and decidual cells is higher than that in the normal pregnancy group (Citation20). Thus, the gas junction protein abnormity resulting from genetic factors may participate in the formation of preeclampsia by impacting the apoptosis of placental cells (Citation20).
Based on the enrichment analysis, furthermore, the adenylate cyclase-inhibiting G-protein coupled receptor signaling pathway possibly participates in the pathogenesis of preeclampsia. Some reports show that the genes GPR124 and MRGPRF, which are related to the G-protein coupled receptor signaling pathway, are reduced in early-onset preeclampsia, showing the relationship between this pathway and the morbidity of preeclampsia (Citation10).
Our studies about susceptibility genes for preeclampsia are restrictive. First, an important limitation of this manuscript is the limited number of participants for this kind of study and the lack of power calculation. Second, even though there are new findings during this study, our GWAS case‒control study results have not been proven in other population samples. Because of the significant ethnic differences and population heterogeneity of preeclampsia patients worldwide, our study may not be representative.
Conclusions
In summary, herein, we performed the first GWAS on preeclampsia patients in the Tianjin Han population, China. This study included a moderate sample size, and we reported several preeclampsia-related genetic variations and gene regions. These new findings will be beneficial to further research on relevant biological functions to prevent preeclampsia. At present, it remains unclear how the underlying mechanism of preeclampsia and these genetic variations interact with other factors to affect the incidence of this condition. It is necessary to replicate our findings in other independent samples in China and in other Asian countries.
Disclosure statement
No potential conflict of interest was reported by the author(s).
Additional information
Funding
References
- Souza JP, Gülmezoglu AM, Vogel J, et al. Moving beyond essential interventions for reduction of maternal mortality (the WHO multicountry survey on maternal and newborn health): a cross-sectional study. Lancet. 2013;381(9879):1747–11. doi: 10.1016/S0140-6736(13)60686-8
- Dawson LM, Parfrey PS, Hefferton D, et al. Familial risk of preeclampsia in Newfoundland: a population-based study. J Am Soc Nephrol. 2002;13(7):1901–1906. doi: 10.1097/01.asn.0000017224.24670.82
- Hirschhorn JN, Daly MJ. Genome-wide association studies for common diseases and complex traits. Nat Rev Genet. 2005;6(2):95–108. doi: 10.1038/nrg1521
- van Dijk M, Mulders J, Poutsma A, et al. Maternal segregation of the Dutch preeclampsia locus at 10q22 with a new member of the winged helix gene family. Nat Genet. 2005;37(5):514–519. doi: 10.1038/ng1541
- Ferreira LC, Gomes CE, Araújo AC, et al. Association between ACVR2A and early-onset preeclampsia: replication study in a Northeastern Brazilian population. Placenta. 2015;36(2):186–190. doi: 10.1016/j.placenta.2014.11.007
- Zhao L, Triche EW, Walsh KM, et al. Genome-wide association study identifies a maternal copy-number deletion in PSG11 enriched among preeclampsia patients. BMC Pregnancy Childbirth. 2012;12(1):61. doi: 10.1186/1471-2393-12-61
- Melton PE, Johnson MP, Gokhale-Agashe D, et al. Whole-exome sequencing in multiplex preeclampsia families identifies novel candidate susceptibility genes. J Hypertens. 2019;37(5):997–1011. doi: 10.1097/HJH.0000000000002023
- Guo LF, Wang ZH, Wang YF. Common variant rs7579169 is associated with preeclampsia in Han Chinese women. Genet Mol Res. 2016;15(2). doi: 10.4238/gmr.15028114
- Wang Q, Wang G, Guo C, et al. Single nucleotide polymorphisms near the inhibin beta B gene on 2q14 are associated with pre-eclampsia in Han Chinese women. Eur J Obstet Gynecol Reprod Biol. 2015;193:127–131. doi: 10.1016/j.ejogrb.2015.04.001
- Liang M, Niu J, Zhang L, et al. Gene expression profiling reveals different molecular patterns in G-protein coupled receptor signaling pathways between early- and late-onset preeclampsia. Placenta. 2016;40:52–59. doi: 10.1016/j.placenta.2016.02.015
- Singh N, Kumble Bhat V, Tiwari A, et al. A homozygous mutation in TRIM36 causes autosomal recessive anencephaly in an Indian family. Hum Mol Genet. 2017;26(6):1104–1114. doi: 10.1093/hmg/ddx020
- He C, Baba M, Cao Y, et al. Self-interaction is critical for Atg9 transport and function at the phagophore assembly site during autophagy. Mol Biol Cell. 2008;19(12):5506–5516. doi: 10.1091/mbc.e08-05-0544
- Yamanaka-Tatematsu M, Nakashima A, Fujita N, et al. Autophagy induced by HIF1α overexpression supports trophoblast invasion by supplying cellular energy. PLoS One. 2013;8(10):e76605. doi: 10.1371/journal.pone.0076605
- Gao L, Qi HB, Kamana KC, et al. Excessive autophagy induces the failure of trophoblast invasion and vasculature: possible relevance to the pathogenesis of preeclampsia. J Hypertens. 2015;33(1):106–117. doi: 10.1097/HJH.0000000000000366
- Gomez-Pastor R, Burchfiel ET, Thiele DJ. Regulation of heat shock transcription factors and their roles in physiology and disease. Nat Rev Mol Cell Biol. 2018;19(1):4–19. doi: 10.1038/nrm.2017.73
- Molvarec A, Prohászka Z, Nagy B, et al. Association of elevated serum heat-shock protein 70 concentration with transient hypertension of pregnancy, preeclampsia and superimposed preeclampsia: a case-control study. J Hum Hypertens. 2006;20(10):780–786. doi: 10.1038/sj.jhh.1002060
- Lampe PD, Lau AF. The effects of connexin phosphorylation on gap junctional communication. Int J Biochem Cell Biol. 2004;36(7):1171–1186. doi: 10.1016/S1357-2725(03)00264-4
- Zhang BX, Ma X, Shu Z, et al. Differential regulation of intracellular calcium oscillations by mitochondria and gap junctions. Cell Biochem Biophys. 2006;44(2):187–203. doi: 10.1385/CBB:44:2:187
- Aoki A, Nakashima A, Kusabiraki T, et al. Trophoblast-specific conditional Atg7 knockout mice develop gestational hypertension. Am J Pathol. 2018;188(11):2474–2486. doi: 10.1016/j.ajpath.2018.07.021
- DiFederico E, Genbacev O, Fisher SJ. Preeclampsia is associated with widespread apoptosis of placental cytotrophoblasts within the uterine wall. Am J Pathol. 1999;155(1):293–301. doi: 10.1016/S0002-9440(10)65123-1