
ABSTRACT
Aim
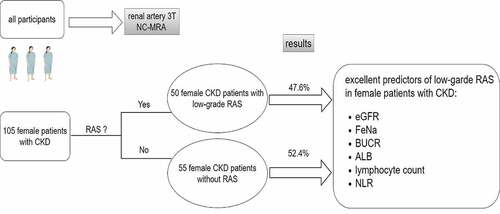
Renal artery stenosis (RAS) is an important cause of chronic kidney disease (CKD). The main purpose of this study was to explore the clinical characteristics and predictors of low-grade RAS in female patients with CKD.
Methods
One hundred and five female CKD patients from Huadong Hospital affiliated with Fudan University who underwent 3 T non-contrast renal artery magnetic resonance angiography (MRA) were analyzed. Basic statistics methods were used in the study, such as independent-sample t test,non-parametric test, binary logistic regression analysis and ROC analysis.
Results
In this cross-sectional study, there were 50 patients with RAS and 55 without RAS (47.6% versus 52.4%). Binary logistic regression analysis demonstrated that low-level ALB and lymphocyte count, high-level SP, BUN and NLR were independent risk factors for low-grade RAS in female patients with CKD. ROC analysis indicated that eGFR, FeNa and UBCR, ALB, lymphocyte count and NLR had the best predictive value for low-grade RAS, especially eGFR with a sensitivity of 65.50% and specificity of 72.00% and FeNa with a sensitivity of 71.10% and specificity of 72.20% and BUCR with a sensitivity of 71.10% and specificity of 68.10%.
Conclusion
In female patients with CKD, FeNa, eGFR, ALB, UBCR, lymphocyte count and NLR may be good predictors of low-grade RAS, especially eGFR, FeNa and BUCR.
Graphical abstract
Introduction
Renal artery stenosis (RAS) is a cause of chronic kidney disease (CKD), especially severe RAS, which can seriously affect renal blood flow and the glomerular filtration rate (GFR) and lead to renal parenchymal damage (Citation1). Based on the stenotic degree of renal artery luminal diameter, RAS is divided into low-grade (lumen reduced by <60%) and high-grade RAS(lumen reduced by ≥60%) (Citation2). In fact, the current paradigm regarding the treatment of RAS stresses on high-grade stenosis rather than low-grade stenosis. For a long time, whether the low-grade RAS needs timely treatment has not attracted much attention. However, in recent years, studies have reported that regardless of the degree of RAS, even low-grade stenosis, compared with patients without stenosis, it can also cause renal hypertension, kidney damage and increase the risk of cardiovascular events in patients (Citation3–5). Therefore, for patients with CKD, the presence of low-grade RAS may accelerate the progress of CKD and screening for RAS, even low-grade RAS, in CKD patients is the first step to initiating proper treatment. In addition, many studies have reported that CKD and RAS are both associated with high levels of inflammatory markers (Citation6,Citation7). Many inflammatory cytokines and markers have been correlated with chronic kidney conditions such as uric acid, lymphocyte/monocyte ratio (LMR), neuregulin and CRP/albumin ratio (Citation8–11). Therefore, it is logical studying association between CKD and RAS.
Although female gender does not seem to have a high correlation with atherosclerosis, many studies from around the world have shown that in addition to renal function and other common risk factors, female gender seem to be an independent risk factor for RAS (Citation12–16). It has been confirmed that women are more prone to fibromuscular dysplasia than men (Citation17). For such patients with fibromuscular dysplasia, the proximal segments of renal arteries are prone to atherosclerosis (Citation18). Therefore, it can be speculated that fibromuscular renal vascular dysplasia can accelerate coexisting atherosclerosis as the increase of women’s age. In addition, ethnic differences are also an important reason for female gender to become a risk factor for RAS. Domestic studies in China also show that elderly women and renal insufficiency are independent risk factors for RAS (Citation16). However, up to now, there are no literatures describing the clinical characteristics and predictors of low-grade RAS in female patients with CKD.
There are a variety of imaging modalities available for the diagnosis of RAS, such as renal Doppler ultrasound (RDU), computed tomographic angiography (CTA), renal angiography and magnetic resonance angiography (MRA), but some limitations, such as low sensitivity, radiation and contrast exposure, may limit the use of the above methods (Citation19). Recently, studies have found that high field strength (3 T) non-contrast magnetic resonance angiography (MRA) is a good alternative for evaluating the degree of renal artery stenosis with high resolution and accuracy without the risk of nephrogenic systemic fibrosis caused by contrast (Citation19,Citation20). Therefore, in this study, we chose 3 T NC-MRA as the diagnostic tool for RAS.
In this cross-sectional study, we mainly described the characteristics of female CKD patients with low-grade RAS. Moreover, we hope to identify some clinical indicators that could predict the occurrence of low-grade RAS in female CKD patients. These indicators may be used as good adjunctive indicators for assessing the presence or absence of RAS in the future.
Materials and methods
Study participants
In this cross-sectional study, we enrolled female patients with CKD who were hospitalized in our department (Nephrology, Huadong Hospital Affiliated with Fudan University, Shanghai, China) between June 2019 and November 2021. These patients all underwent non-contrast renal MRA during their hospitalization. The inclusion criteria were female CKD patients who had undergone non-contrast renal MRA and had low-grade RAS. CKD was defined as abnormalities of kidney structure or function, present for >3 months, with implications for health, including the emergence of markers of kidney damage (one or more), such as albuminuria (albumin excretion rate [AER]≥30 mg/24 hours; albumin/creatinine ratio [ACR]≥30 mg/g [≥3 mg/mmol]), urine sediment abnormalities, electrolyte and other abnormalities due to tubular disorders, abnormalities detected by histology, abnormalities detected by imaging or history of kidney transplantation, or a glomerular filtration rate (GFR)<60 ml/min/1.73 m2 (GFR categories G3a-G5) (Citation21).
The exclusion criteria were severe RAS, infectious diseases, cachexia, severe cardiopulmonary insufficiency and malignant tumor. Low-grade RAS was defined as the extent of any RAS no more than 60%. Ultimately, 105 female patients with CKD were included, of whom 50 patients were in the low-grade RAS group and the remaining 55 were in the no RAS control group.
Informed consent was obtained from all patients. The study protocol was approved by the Ethics Committee of Huadong Hospital Affiliated with Fudan University, Shanghai.
Clinical data collection and laboratory tests
Baseline characteristics, including demographics (name, sex, age, occupation, educational background, etc.), laboratory and imaging indicators and previous history, medication history, family history, and history of smoking and alcohol consumption were collected by trained nurses. Hypertension was defined as systolic blood pressure ≥ 140 mmHg and/or diastolic blood pressure ≥ 90 mmHg or use of antihypertension therapy. Diabetes mellitus was diagnosed in those who had a previous history of diabetes or were taking insulin or oral hypoglycemic medication; subjects with fasting glucose levels over 7 mmol/L were also included. The estimated GFR (eGFR) (milliliters per minute per 1.73 m2), an indicator of renal function, was calculated using the chronic kidney disease-EPI formula (Citation22). The eGFR, urinary sodium excretion fraction [FeNa (%)] and creatinine clearance rate (Ccr) were calculated by the following formulas.
1. eGFR (ml/min/1.73 m2) = a x(SCr/b)cx(0.993)age,
where a = 144 (female), 141 (male); b = 0.7 (female), 0.9 (male); when SCr≤0.7 mg/dl, c = −0.329 (female), −0.411 (male); when SCr≥0.7 mg/dl, c = −1.209 (female or male)
2. FeNa (%) = (UNa x SCr)/(UCr x SNa) x100%
Routine laboratory biochemical parameters were collected at same time and included BNP, pro-BNP, urea nitrogen (BUN), serum creatinine (SCr), Fasting plasma glucose (FPG), blood phosphorus (SP), albumin (ALB), total cholesterol (TC), triglycerides (TGs), low-density lipoprotein (LDL), high-density lipoprotein (HDL), serum sodium (SNa), serum calcium (SCa), serum potassium (SK), serum uric acid (SUA), serum chlorine (SCl), parathyroid hormone (PTH), triiodothyronine (T3), thyroxine (T4), thyroid-stimulating hormone (TSH), free triiodothyronine (FT3), free thyroxine (FT4), urine beta-microglobulin (U-β2 MG), urine alpha1-microglobulin-to-creatinine ratio (U-α1 MG), urine creatinine (UCr), and urine sodium (UNa). In addition, patients were classified into three groups according to the tertiles of ALB:ALB-I (ALB≤37.03 g/l),ALB-II (37.03 g/l < ALB≤41.00 g/l), ALB III (ALB>41.00 g/l); Patients were stratified into three groups according to the tertiles of lymphocyte count: lymphocyte count -I (lymphocyte count≤21.50%), lymphocyte count -II (21.50%< lymphocyte count≤31.10%), lymphocyte count-III (lymphocyte count>31.10%); Patients were divided into three groups according to the tertiles of fibrinogen: fibrinogen-I (fibrinogen≤2.88 g/l), fibrinogen-II (2.88 g/l< fibrinogen≤3.86 g/l), fibrinogen-III (fibrinogen>3.86 g/l); Patients were divided into three groups according to the tertiles of SP:SP-I (SP≤1.19 mmol/l), SP-II (1.19 mmol/l < SP≤1.38 mmol/l), SP-III (SP>1.38 mmol/l); Patients were stratified into three groups according to the tertiles of BUN: BUN-I (BUN≤6.50 mmol/l), BUN-II (6.50 mmol/l< BUN≤11.06 mmol/l), BUN-III (BUN>11.06 mmol/l); Patients were stratified into three groups according to the tertiles of neutrophil-to-lymphocyte ratio (NLR):NLR-I (NLR≤1.97), NLR-II (1.97< NLR≤3.24), NLR-III (NLR >3.24).
To ensure the accuracy and uniformity of the results, all of the laboratory measurements were completed at Huadong Hospital Affiliated with Fudan University, Shanghai, China.
Assessment of low-grade renal artery stenosis
Non-contrast MRA was performed on a 3-Tesla Siemens Magnetom Prisma SCanner using a 32-channel head coil at the Imaging Department of Huadong Hospital Affiliated with Fudan University. Three-dimensional time-of-flight MRA images (3D TOF MRA) were acquired with a repetition time of 21 ms, echo time of 3.42 ms, flip angle of 18, 220*176 mm field of view, 218 × 256 acquisition matrix, slice thickness of 0.60 mm, distance factor−25%, and an acquisition time of 4 min and 54s. The outcome of 3.0-T MRA detection for RAS was identified by two professional radiologists. Based on the stenotic degree of luminal diameter, low-grade RAS was regarded as a reduction in the lumen of <60%.
Statistical analysis
All continuous variables were assessed for a Gaussian distribution in the RAS and non-RAS groups by the Kolmogorov Smirnov test. For normally distributed variables, we use the mean ± standard deviation, and the descriptive statistics of data with a skewed distribution are presented as the median with the interquartile range. Categorical variables are expressed as percentages. Next, normally distributed variables were further tested for homogeneity of variance. Independent-samples T tests were applied to compare normally distributed variables with homogeneity of variance between the two groups, while the Wilcoxon test was used for variables with nonnormal distributions or nonhomogeneity of variance. The chi-square test was used to compare the constituent ratio of categorical variables between the two groups. Next, binary logistic regression analysis was used to explore independent risk factors. Finally, the corresponding ROC curve was plotted, and the best threshold was calculated. All statistical tests were two-tailed, and the results were considered significant at P < .05. SPSS 26 was used for statistical analysis.
Results
Comparison of the clinical characteristics of the two groups
In this cross-sectional descriptive study, we enrolled 105 female patients with CKD. The average patient age was 63.71 ± 12.99 years, and the eGFR was 42.53 ± 28.58 ml/min/1.73 m2. As shown in , we divided the female patients with CKD into two groups according to the presence of RAS. The number of patients with RAS was 50 (47.6%) versus 55 (52.4%) without RAS. In univariate analysis, female CKD patients with RAS had significantly higher levels of fibrinogen, BUN, Scr, SP, FeNa,UBCR and NLR. They were significantly older (68.00 ± 12.40 vs. 59.89 ± 12.40, P < .05). The chi-square test showed that the proportion of DM in the RAS group was significantly higher than that in the no RAS group (χ2 = 6.760, P = .010). On the other hand, the eGFR of CKD patients in the RAS group was significantly lower than that of CKD patients without RAS. In addition, their lymphocyte count and ALB were significantly lower. However, there was no significant difference in BMI, hypertension, monocyte count, neutrophil count, TC, TG, LDL, SUA, SCa, SK, SNa, SCl, PTH, 25-OHD3, or HbA1C between the two groups (all P > .05).
Table 1. Baseline characteristics of subjects included according to with or without RAS.
The association of ALB, lymphocyte count, fibrinogen, SP, BUN and NLR with low-grade RAS in female patients with CKD
Next, we examined whether the above indicators were independent risk factors or protective factors for low-grade RAS in female patients with CKD. The outcomes of the association of ALB, lymphocyte count, fibrinogen, SP, BUN and NLR with low-grade RAS by multivariate regression analysis are shown in . We found that ALB (OR = 0.880, 95%CI:0.792–0.979) and lymphocyte count (OR = 0.928,95%CI:0.879–0.979) were still protective factors for low-grade RAS in female patients with CKD, while SP (OR = 7.518, 95%CI:1.359–41.597) and BUN (OR = 1.111,95%CI: 1.024–1.205),were still risk factors for low-grade RAS in female patients with CKD after adjusted for age, hypertension, diabetes mellitus, TC, TG, FPG, LDL, HDL.
Table 2. The association of ALB, lymphocyte count, fibrinogen, SP, BUN and NLR with low-grade RAS in female patients with CKD.
The proportion of low-grade RAS in ALB, lymphocyte count, fibrinogen, SP,BUN and NLR tertiles
We divided the value of ALB, lymphocyte count, fibrinogen, SP, BUN, and NLR into three groups according to their tertiles. AS shown in ,chi-square test indicated that the proportion of low-grade RAS in ALB tertiles was not same (χ2 = 12.077, P = .002), and the proportion of low-grade RAS in the first and second ALB tertiles were statistically significantly higher than in the third (Bonferroni correction, p = .001; p = .006,respectively,). Moreover, the proportion of low-grade RAS in lymphocyte count tertiles was not same (χ2 = 6.780,p = .034), and the proportion of low-grade RAS in the first lymphocyte count tertile was significantly higher than in the third (Bonferroni correction, p = .013,). furthermore, the proportion of low-grade RAS in fibrinogen tertiles was not same (χ2 = 10.564, p = .005), and the proportion of low-grade RAS in the third fibrinogen tertile was statistically significantly higher than in the first (Bonferroni correction, p = .001, ). What is more, the proportion of low-grade RAS in SP tertiles escalated, but the difference was not significant(χ2 = 4.455, p = .108, ). Additionally, the proportion of low-grade RAS in BUN tertiles was not same (χ2 = 6.739, p = .034), and the proportion of low-grade RAS in the third tertile was significantly higher than in the first (Bonferroni correction, p = .013, ). Lastly, the proportion of low-grade RAS in NLR tertiles was not same (χ2 = 7.972, p = .019), and the proportion of low-grade RAS in the third NLR tertile was statistically significantly higher than in the first (Bonferroni correction, p = .008, ).
Figure 1. The proportion of low-grade RAS in ALB, lymphocyte count, fibrinogen, SP,BUN and NLR tertiles.(A) The proportion of low-grade RAS in ALB tertiles. (B) The proportion of low-grade RAS in lymphocyte count tertiles. (C) The proportion of low-grade RAS in fibrinogen tertiles. (D) The proportion of low-grade RAS in SP tertiles. (E) The proportion of low-grade RAS in BUN tertiles. (F) The proportion of low-grade RAS in NLR tertiles.

The association of ALB, lymphocyte count, fibrinogen, SP, BUN and NLR tertiles with low-grade RAS by logistic regression analysis
The covariates-adjusted results for low-grade RAS according to ALB, lymphocyte count, fibrinogen, SP, BUN and NLR tertiles are shown in . Binary logistic regression analysis revealed that the risk for low-grade RAS was decreased from ALB I to ALB III (OR = 0.18, 95% CI: 0.05–0.64, P = .008; ) after correction for potential confounders such as age, hypertension, diabetes mellitus, TC, TG, FPG, LDL, HDL. In addition, the risk for low-grade RAS was also decreased from lymphocyte count I to lymphocyte III (OR = 0.21, 95% CI 0.06–0.74, P = .015; ). In addition to lymphocyte count, the NLR is a frequently used index to indicate inflammation or infection in clinical practice. Thus, we next explored multinomial-adjusted ORs and 95% CIs for low-grade RAS according to NLR tertiles. The outcome is shown in . Compared with the first tertile, the second (OR = 4.53, 95% CI 1.33–15.41,P = .016), third (OR = 5.56, 95%CI 1.49–20.80,P = .011) tertiles were independent risk predictors for RAS (P < .05).Furthermore, the risk for low-grade RAS was also increased from SP I to SP III(OR = 5.10, 95% CI 1.26–20.62, P = .022; ).Additionally, the risk for low-grade RAS was also increased from BUN I to BUN III(OR = 4.48, 95% CI 1.28–15.73, P = .019; ). However, after correction for above confounders, compared with the first tertile, the second (OR = 1.42, 95% CI 0.46–4.39, P = .547) and third (OR = 2.26, 95% CI 0.70–7.29, P = .172) fibrinogen tertiles were no longer associated with low-grade RAS () .
Figure 2. Logistic regression estimation of the effect of ALB, lymphocyte count, fibrinogen, SP, BUN and NLR on low-grade renal artery stenosis. (A) Multinomial-adjusted ORs for low-grade RAS according to ALB tertiles; the first tertile was used as a reference. (B) Multinomial-adjusted ORs for low-grade RAS according to lymphocyte tertiles; the first tertile was used as a reference. (C) Multinomial-adjusted ORs for low-grade RAS according to fibrinogen tertiles; the first tertile was used as a reference. (D) Multinomial-adjusted ORs for low-grade RAS according to SP tertiles; the first tertile was used as a reference. (E) Multinomial-adjusted ORs for low-grade RAS according to BUN tertiles; the first tertile was used as a reference.(F) Multinomial-adjusted ORs for low-grade RAS according to NLR tertiles; the first tertile was used as a reference.

The diagnostic value of the above indicators for low-grade RAS in female CKD patients
ROC analysis was further applied to explore the predictive value of the above indicators. After analysis, we found that eGFR, FeNa, UBCR, ALB, lymphocyte count and NLR had high diagnostic value, especially eGFR, FeNa and BUCR. The outcomes of ROC analysis are shown in and . As the outcomes displayed, the AUC of eGFR was 0.698. According to the Jordan index, the optimal critical point of the eGFR was calculated to be 40.74 ml/min/1.73 m2, with a corresponding sensitivity of 65.5% and specificity of 72.0% (). Moreover, the AUC of FeNa was 0.714. According to the Jordan index, the optimal critical point of the FeNa was calculated to be 1.11%, with a corresponding sensitivity of 71.70% and specificity of 72.20% (). In addition, the AUC of UBCR was 0.739. A cutoff point of 4684.26ug/g for UBCR predicted low-grade RAS with a sensitivity of 71.10% and specificity of 68.10% (). Furthermore, the AUC of ALB was 0.681. A cutoff value of 38.75 g/l for ALB predicted low-grade RAS with a corresponding sensitivity of 65.50% and specificity of 66.00% (). The AUC of the lymphocyte count was 0.667. The cutoff value of the lymphocyte count was calculated to be 25.60%, with a sensitivity of 65.40% and specificity of 61.20% (). Finally, the cutoff point of NLR was 2.35, with a sensitivity of 67.30%, specificity of 63.50% and AUC of 0.657 (). Compared with a single lymphocyte count, the ability of the NLR to predict low-grade RAS was better.
Figure 3. ROC curve of the diagnostic accuracy of lymphocyte count, NLR, ALB, eGFR, UBCR, and FeNa in low-grade renal artery stenosis.

Table 3. The outcome of ROC of the following variables predicting low-grade renal artery stenosis.
Discussion
Here, in this cross-sectional study, we reported that serum ALB, lymphocyte count, SP, BUN and NLR were independent risk factors for low-grade RAS in female CKD patients. In addition, eGFR, UBCR, FeNa, ALB, lymphocyte count and NLR had the best predictive value for the occurrence of low-grade RAS in female CKD patients, especially eGFR and FeNa. The outcome of the study was shown in graphic abstract.
Renal artery stenosis can cause eGFR deterioration by affecting renal blood flow, regardless of the degree of RAS (Citation19,Citation23). In the present study, the eGFR was lower in female CKD patients with low-grade RAS, which may indicate that low-grade RAS can further disturb the blood flow of affected kidneys in female CKD patients. Indeed, in some studies, the authors found that even in patients with low-grade RAS, RAS can cause further eGFR decline during the follow-up course compared with the no RAS group (Citation3). However, more surprisingly, a 734-person cross-sectional, single-center study showed that small renal arteries, regardless of the presence or degree of RAS, were more likely to be associated with low eGFR. Thus, larger and well-designed clinical trials should be performed in the future.
In recent years, RAS has been believed to cause renal injury not only by affecting renal blood flow and oxygen supply but also through intrarenal injury, such as renal tubule injury, interstitial fibrosis and microvascular rarefaction, which may be more important, as the kidney tubules are impaired by reactive oxygen species (ROS) and cytokines excreted by inflammatory cells (Citation23). We know that UBCR is a marker of kidney tubule injury (Citation24,Citation25). Therefore, a higher UBCR in female CKD patients with low-grade RAS may suggest that low-grade RAS further damages the function of renal tubules. In addition, UBCR was recently found to be an independent predictor of hypertension and deterioration of renal function and was linked to a high risk of cardiovascular events in patients with chronic heart failure (CHF) (Citation26–29). However, UBCR can be affected by many factors, such as infection and the pH value of the urine (Citation30,Citation31). Therefore, the final outcome needs to be evaluated according to the individual patient’s status. Furthermore, a higher FeNa, similar to a higher UBCR, reflects the impairment of the tubular reabsorption capacity of the functioning nephrons (Citation32). Given this evidence, a lower eGFR may have a synergistic effect with a higher UBCR and FeNa in female CKD patients with low-grade RAS, which may imply that low-grade RAS not only disturbs the hemodynamics of the glomerulus but also impairs the function or structure of the renal tubule. However, more well-designed prospective clinical studies are needed to determine this causal relationship.
In many diseases, a low serum albumin level is usually recognized as an indicator of poor prognosis and is correlated with the chronic nature of the disease (Citation33–35). Moreover, a low albumin level signifies the inflammatory condition of patients (Citation36,Citation37). Recently, many clinical studies have shown that hypoalbuminemia can predict the severity of carotid artery stenosis and peripheral arterial disease, especially when combined with C-reactive protein (CRP) (Citation38–40). The explanation proposed in these studies was that reduced serum albumin levels were associated with increased blood viscosity, impaired endothelial function, platelet activation, and increased production of platelet-derived vasospastic substances (Citation41–44). Perhaps these latent mechanisms may also explain the relationship between serum albumin and low-grade RAS because in our study, the serum albumin level was significantly lower in the low-grade RAS group.
It is well known that many immune cells, such as neutrophils, monocytes, platelets and lymphocytes, are involved in the process of atherosclerosis (Citation45). Additionally, atherosclerosis accounts for more than ninety percent of cases of RAS, and thus, atherosclerotic renal artery stenosis (ARAS) is also an inflammatory disease (Citation1). A relationship has been established between neutrophils and arterial stenosis, such as coronary artery stenosis and intracranial artery stenosis (Citation46,Citation47). Neutrophils can trigger inflammatory reactions by releasing inflammatory mediators, such as proinflammatory cytokines and oxyradicals, and may lead to endothelial dysfunction and atherogenesis (Citation48). Many studies have also found that higher monocyte counts and platelet counts are also related to artery stenosis and atherosclerosis (Citation45); Furthermore, monocytes can undergo phenotypic transformation during atherosclerosis and subsequently secrete proinflammatory factors, while platelets can directly interact with leukocytes and increase leukocyte activity via chemokines (Citation49,Citation50). In contrast to neutrophils, monocytes and platelets, the lymphocyte count has been found to negatively correlate with atherosclerosis because lymphocytes can secrete anti-inflammatory cytokines such as interleukin-10 and interleukin-4, inhibit the expression of metalloproteinase-1 and modulate the mononuclear cell phenotype (Citation48). Many pathological factors, such as inflammation, can increase lymphocyte apoptosis, resulting in artery stenosis progression (Citation51). To date, a multitude of studies have found that the neutrophil-to-lymphocyte ratio (NLR), platelet-to-lymphocyte ratio (PLR), and lymphocyte-to-monocyte ratio (LMR) may have more clinical value than the neutrophil, lymphocyte or platelet count alone (Citation52–54). In the current study, we found that a lower lymphocyte count and higher NLR in female CKD patients with low-grade RAS, compared with patients with no RAS, were both independent risk factors for low-grade RAS. Moreover, the ability of the NLR to predict low-grade RAS appeared greater than that of the lymphocyte count alone. This consequence may further verify the beneficial role of lymphocytes in the inhibition of atherosclerosis and the superior clinical value of the NLR in predicting low-grade RAS in female CKD patients.
In this study, we found that hypertension does not seem to be a risk factor for low-grade RAS. However, in many other studies on RAS, the history of hypertension and the duration of hypertension are independent risk factors for high-grade RAS (Citation3,Citation55,Citation56). The reason for this phenomenon may be that our study enrolled a group of patients with CKD, who have a high probability of hypertension. In addition, age and renal function seem to be the common independent risk factors for both low-grade RAS and high-grade RAS (some results are not shown in this study) (Citation15,Citation55). After adjusting for confounding factors, diabetes does not seem to be associated with RAS, regardless of in low-or high-grade RAS (Citation13,Citation57). By consulting relevant literatures, it is not difficult to find that almost all the studies on the risk factors of RAS focus on such common factors as hypertension, diabetes, age, coronary artery disease, peripheral vascular disease, etc. Few studies have been conducted on the implication of blood biochemical indicators on RAS. This study found the significance of many blood biochemical indicators in low-grade RAS. Therefore, we hope that in the future, we can collect more clinical data of patients with high-grade RAS for analysis, and find more meaningful indicators from blood biochemical and other aspects.
Study limitations
There are still several limitations of this study. Firstly, this was a cross-sectional study; thus, it could not provide a causal link among FeNa, eGFR, UBCR, lymphocytes, NLR and low-grade RAS. Secondly, this was a single-center study, and the results may not be well extrapolated. Thirdly, the sample size of our study was small. Fourthly, there is lack of data on high-grade RAS. In the future, larger samples and multicenter studies and prospective cohort studies should be conducted to verify these conclusions and investigate the effects of low-grade RAS on patients with CKD.
Conclusions
To the best of our knowledge, this is the first study to describe the clinical characteristics of low-grade RAS in female CKD patients. We found that FeNa, eGFR, ALB, UBCR, lymphocyte count and NLR may provide great predictive value in identifying low-grade RAS in female CKD patients, especially FeNa, eGFR and BUCR. These parameters are extensively available to clinical practitioners and may be of use to discern low-grade RAS in female CKD patients.
Author contributions
JX and WZ designed this study. DPW, HGL, DXZ and ZBY collected the data. DPW and JLN analyzed the data and prepared the paper. JX and WZ revised and approved the final version. DPW takes responsibility for the integrity of the data analysis. All authors have read the paper and agreed to publication.
Data Statement
The data was original and not shared with others.
Ethical Statement
The authors are accountable for all aspects of the work in ensuring that questions related to the accuracy or integrity of any part of the work are appropriately investigated and resolved.
Supplemental Material
Download Zip (159.8 KB)Acknowledgments
We are grateful to all patients for their commitment to this study and Xiantao Academy website for its drawing function and BioRender for its graphs.
Disclosure statement
No potential conflict of interest was reported by the author(s).
Supplementary material
Supplemental data for this article can be accessed online at https://doi.org/10.1080/10641963.2023.2175849
Additional information
Funding
References
- Kwon SH, Lerman LO.Atherosclerotic renal artery stenosis: current status. Adv Chronic Kidney Dis. 2015;22(3):224–10.doi:10.1053/j.ackd.2014.10.004.
- Ren J-H, Ma N, Wang S-Y, Sun Y-J, Zhang Y-W, Guo F-J, Li Y-J, Li T-H, Ai H, Zhang W-D, et al. Rationale and study design for one-stop assessment of renal artery stenosis and renal microvascular perfusion with contrast-enhanced ultrasound for patients with suspected renovascular hypertension. Chin Med J (Engl). 2019;132(1):63–68.doi:10.1097/CM9.0000000000000002.
- Dechering DG, Kruis, H. M. E., Adiyaman, A., Thien, T., & Postma, C. T. Clinical significance of low-grade renal artery stenosis. J Intern Med. 2010;267(3):305–15.doi:10.1111/j.1365-2796.2009.02144.x.
- de Leeuw PW, Postma CT, Spiering W, Kroon AA, et al. Atherosclerotic renal artery stenosis: should we intervene earlier? Curr Hypertens Rep. 2018;20(4):35.doi:10.1007/s11906-018-0829-3.
- Woittiez AJJ, de Vogel MC, de Leeuw PW.Can low-grade renal artery stenosis be considered as cause for renovascular hypertension? J Hum Hypertens. 2022;36(4):420–22.doi:10.1038/s41371-021-00628-y.
- Kocak MZ, Aktas G, Erkus E, T Duman T, M Atak B, Savli H, et al. Mean platelet volume to lymphocyte ratio as a novel marker for diabetic nephropathy. J Coll Physicians Surg Pak. 2018;28(11):844–47.doi:10.29271/jcpsp.2018.11.844.
- Jiang Y, Hong S, Zhu X, Zhang L, Tang H, Jordan KL, Saadiq IM, Huang W, Lerman A, Eirin A, et al. IL-10 partly mediates the ability of MSC-derived extracellular vesicles to attenuate myocardial damage in experimental metabolic renovascular hypertension. Front Immunol. 2022;13:940093.doi:10.3389/fimmu.2022.940093.
- Kocak MZ, Aktas G, Duman TT, Atak BM, Savli H, et al. Is uric acid elevation a random finding or a causative agent of diabetic nephropathy? Rev Assoc Med Bras (1992). 2019;65(9):1155–60.doi:10.1590/1806-9282.65.9.1156.
- Kocak MZ, Aktas G, Duman TT, Atak BM, Kurtkulagi O, Tekce H, Bilgin S, Alaca B, et al. Monocyte lymphocyte ratio as a predictor of diabetic kidney injury in type 2 diabetes mellitus; The MADKID Study. J Diabetes Metab Disord. 2020;19(2):997–1002.doi:10.1007/s40200-020-00595-0.
- Kocak MZ, Aktas G, Atak BM, Duman TT, Yis OM, Erkus E, Savli H, et al. Is Neuregulin-4 a predictive marker of microvascular complications in type 2 diabetes mellitus? Eur J Clin Invest. 2020;50(3):e13206.doi:10.1111/eci.13206.
- Bilgin S, Kurtkulagi O, Atak Tel BM, Duman TT, Kahveci G, Khalid A, Aktas G, et al. Does C-reactive protein to serum albumin ratio correlate with diabEtic nephropathy in patients with type 2 dIabetes MEllitus? The CARE TIME study. Prim Care Diabetes. 2021;15(6):1071–74.doi:10.1016/j.pcd.2021.08.015.
- Harding MB, Smith LR, Himmelstein SI, Harrison K, Phillips HR, Schwab SJ, Hermiller JB, Davidson CJ, Bashore TM, et al. Renal artery stenosis: prevalence and associated risk factors in patients undergoing routine cardiac catheterization. J Am Soc Nephrol. 1992;2(11):1608–16.doi:10.1681/ASN.V2111608.
- Khatami MR, Edalati-Fard M, Sadeghian S, Salari-Far M, Bs M, et al. Renal artery stenosis in patients with established coronary artery disease: prevalence and predicting factors. Saudi J Kidney Dis Transpl. 2014;25(5):986–91.doi:10.4103/1319-2442.139880.
- Khatami MR, Jalali A, Zare E, Sadeghian S, et al. Development of a simple risk score model to predict renal artery stenosis. Nephron. 2018;140(4):257–64.doi:10.1159/000492732.
- Cohen MG, Andrés Pascua J, Garcia-Ben M, Rojas-Matas CA, Gabay JM, Berrocal DH, Tan WA, Stouffer GA, Montoya M, Fernandez AD, et al. A simple prediction rule for significant renal artery stenosis in patients undergoing cardiac catheterization. Am Heart J. 2005;150(6):1204–11.doi:10.1016/j.ahj.2005.02.019.
- Yan J-H, Sun L-X, Zhao X-Y, Lian H, Ruan Y-P, Zhu Y-L, Zhang S-Y, Fang Q, Fan Z-J, et al. [Prevalence and risk factors of atherosclerotic renal artery stenosis]. Zhonghua Yi Xue Za Zhi 2013;93:827–31.
- Lorenz EC, Vrtiska TJ, Lieske JC, Dillon JJ, Stegall MD, Li X, Bergstralh EJ, Rule AD, et al. Prevalence of renal artery and kidney abnormalities by computed tomography among healthy adults. Clin J Am Soc Nephrol. 2010;5(3):431–38.doi:10.2215/CJN.07641009.
- Horvath JS, Waugh RC, Tiller DJ, Duggin GG, et al. The detection of renovascular hypertension: a study of 490 patients by renal angiography. Q J Med 1982;51:139–46.
- Hicks CW, Clark TWI, Cooper CJ, de Bhailís ÁM, De Carlo M, Green D, Małyszko J, Miglinas M, Textor SC, Herzog CA, et al. Atherosclerotic renovascular disease: a KDIGO (Kidney disease: improving global outcomes) controversies conference. Am J Kidney Dis. 2022;79(2):289–301.doi:10.1053/j.ajkd.2021.06.025.
- Guo X, Gong Y, Wu Z, Yan F, Ding X, Xu X, et al. Renal artery assessment with non-enhanced MR angiography versus digital subtraction angiography: comparison between 1.5 and 3.0 T. Eur Radiol. 2020;30(3):1747–54.doi:10.1007/s00330-019-06440-0.
- Levin A, Stevens PJKI.Summary of KDIGO 2012 CKD Guideline: behind the scenes, need for guidance, and a framework for moving forward. Kidney Int. 2014;85(1):49–61.doi:10.1038/ki.2013.444.
- Ke G, Xie Z, Xiao J, Zhang Y, Hu Y, Li B, Jiang N, Chen X, Liu S, Shi W, et al. Comparison of 6 equations for estimating glomerular filtration rate in a Chinese benign hypertensive nephrosclerosis population. Medicine (Baltimore). 2021;100(51):e28318.doi:10.1097/MD.0000000000028318.
- Lerman LO.Cell-based regenerative medicine for renovascular disease. Trends Mol Med. 2021;27(9):882–94.doi:10.1016/j.molmed.2021.06.004.
- van den Brand JA, Hofstra JM, Wetzels JF.Low-molecular-weight proteins as prognostic markers in idiopathic membranous nephropathy. Clin J Am Soc Nephrol. 2011;6(12):2846–53.doi:10.2215/CJN.04020411.
- Zhou X, Hong W, Chen W, Feng X, Zhang Z, Zhang X, Fu C, Xiao J, Ye Z, et al. The urinary β(2) microglobulin-creatinine ratio is inversely associated with lumbar spine bone mineral density in the elderly Chinese males. Arch Osteoporos. 2020;15(1):90.doi:10.1007/s11657-020-00764-x.
- Kudo K, Konta T, Mashima Y, Ichikawa K, Takasaki S, Ikeda A, Hoshikawa M, Suzuki K, Shibata Y, Watanabe T, et al. The association between renal tubular damage and rapid renal deterioration in the Japanese population: the Takahata study. Clin Exp Nephrol. 2011;15(2):235–41.doi:10.1007/s10157-010-0392-y.
- Otaki Y, Watanabe, T., Shishido, T., Takahashi, H., Funayama, A., Narumi, T., & Kubota, I. The impact of renal tubular damage, as assessed by urinary β2-microglobulin-creatinine ratio on Cardiac Prognosis in Patients with Chronic Heart Failure. Circ Heart Fail. 2013;6(4):662–68.doi:10.1161/CIRCHEARTFAILURE.112.000089.
- Mashima Y, Konta T, Kudo K, Takasaki S, Ichikawa K, Suzuki K, Shibata Y, Watanabe T, Kato T, Kawata S, et al. Increases in urinary albumin and beta2-microglobulin are independently associated with blood pressure in the Japanese general population: the Takahata study. Hypertens Res. 2011;34(7):831–35.doi:10.1038/hr.2011.42.
- Ikeda A, Konta T, Takasaki S, Hao Z, Suzuki K, Sato H, Shibata Y, Takeishi Y, Kato T, Kawata S, et al. In a non-diabetic Japanese population, the combination of macroalbuminuria and increased urine beta 2-microglobulin predicts a decline of renal function: the Takahata study. Nephrol Dial Transplant. 2008;24(3):841–47.doi:10.1093/ndt/gfn591.
- Penders J, Delanghe JR.Alpha 1-microglobulin: clinical laboratory aspects and applications. Clin Chim Acta. 2004;346(2):107–18.doi:10.1016/j.cccn.2004.03.037.
- Kang J, Liu, J., Ding, H., Li, X., Wang, Q., Guo, X. & Shang, H. Urine alpha1-microglobulin is a better marker for early tubular dysfunction than beta2-microglobulin among tenofovir-exposed human immunodeficiency virus-infected men who have sex with men. Braz J Infect Dis. 2015;19(4):410–16.doi:10.1016/j.bjid.2015.05.004.
- Marzuillo P, Iafusco D, Zanfardino A, Guarino S, Piscopo A, Casaburo F, Capalbo D, Ventre M, Arienzo MR, Cirillo G, et al. Acute kidney injury and renal tubular damage in children with type 1 diabetes mellitus onset. J Clin Endocrinol Metab. 2021;106(7):e2720–e2737. e2720-e2737. doi:10.1210/clinem/dgab090.
- Hsieh WC, Aboud, A., chael Henry, B. M., Omara, M., Lindner, J., & Pirk, J. Serum albumin in patients undergoing transcatheter aortic valve replacement: a meta-analysis. Rev Cardiovasc Med. 2019;20(3):161–69.doi:10.31083/j.rcm.2019.03.524.
- Yamagata A, Ito A, Nakanishi Y, Ishida T, et al. Prognostic factors in nursing and healthcare-associated pneumonia. J Infect Chemother. 2020;26(6):563–69.doi:10.1016/j.jiac.2020.01.009.
- Alves FC, Sun J, Qureshi AR, Dai L, Snaedal S, Bárány P, Heimbürger O, Lindholm B, Stenvinkel P, et al. The higher mortality associated with low serum albumin is dependent on systemic inflammation in end-stage kidney disease. PLoS One. 2018;13(1):e0190410.doi:10.1371/journal.pone.0190410.
- Arques S. Human serum albumin in cardiovascular diseases. Eur J Intern Med. 2018;52:8–12.doi:10.1016/j.ejim.2018.04.014.
- Don BR, Kaysen G.POOR NUTRITIONAL STATUS AND INFLAMMATION: serum albumin: relationship to inflammation and nutrition. Semin Dial. 2004;17(6):432–37.doi:10.1111/j.0894-0959.2004.17603.x.
- Yildirim T, Kiris T, Avci E, Yildirim SE, Argan O, Safak Ö, Aktas Z, Toklu O, Esin FK, et al. Increased serum CRP-Albumin ratio is independently associated with severity of carotid artery stenosis. Angiology. 2020;71(8):740–46.doi:10.1177/0003319720926761.
- Süleymanoğlu M, Burak C, Gümüşdağ A, Yesin M, Rencüzoğulları İ, Karabağ Y, Çağdaş M, Çap M, et al. Assessment of the relation between C-reactive protein to albumin ratio and the severity and complexity of peripheral arterial disease. Vascular. 2020;28(6):731–38.doi:10.1177/1708538120925952.
- Yayla C, Gayretli Yayla K.C-Reactive protein to albumin ratio in patients with saphenous vein graft disease. Angiology. 2021;72(8):770–75.doi:10.1177/0003319721998863.
- Joles JA, Willekes-Koolschijn N, Koomans HA.Hypoalbuminemia causes high blood viscosity by increasing red cell lysophosphatidylcholine. Kidney Int. 1997;52(3):761–70.doi:10.1038/ki.1997.393.
- Zhang WJ, Frei B.Albumin selectively inhibits TNF alpha-induced expression of vascular cell adhesion molecule-1 in human aortic endothelial cells. Cardiovasc Res. 2002;55(4):820–29.doi:10.1016/S0008-6363(02)00492-3.
- Gresele P, Deckmyn H, Huybrechts E, Vermylen J, et al. Serum albumin enhances the impairment of platelet aggregation with thromboxane synthase inhibition by increasing the formation of prostaglandin D2. Biochem Pharmacol. 1984;33(13):2083–88.doi:10.1016/0006-2952(84)90577-X.
- Mikhailidis DP, Ganotakis ES.Plasma albumin and platelet function: relevance to atherogenesis and thrombosis. Platelets. 1996;7(3):125–37.doi:10.3109/09537109609023571.
- Altinbaş Ö, Demiryürek Ş, Işık M, Tanyeli Ö, Dereli Y, Görmüş N, et al. Predictive value of neutrophil-to-lymphocyte, aspartate-to-alanine aminotransferase, lymphocyte-to-monocyte and platelet-to-lymphocyte ratios in severity and side of carotid artery stenosis: are those significant? Heart Surg Forum. 2021;24(1):E072–E078. E072-e078. doi:10.1532/hsf.3431.
- Güven R, Akyol KC, Bayar N, Güngör F, Akça AH, Çelik A, et al. Neutrophil count as a predictor of critical coronary artery stenosis in young patients. Iran J Public Health. 2018;47(5):765–67.
- Zhu B, Liu H, Pan Y, Jing J, Li H, Zhao X, Liu L, Wang D, Johnston SC, Wang Z, et al. Elevated neutrophil and presence of intracranial artery stenosis increase the risk of recurrent stroke. Stroke. 2018;49(10):2294–300.doi:10.1161/STROKEAHA.118.022126.
- Huang L-Y, Sun F-R, Yin -J-J, Ma Y-H, Li H-Q, Zhong X-L, Yu J-T, Song J-H, Tan L, et al. Associations of the neutrophil to lymphocyte ratio with intracranial artery stenosis and ischemic stroke. BMC Neurol. 2021;21(1):56.doi:10.1186/s12883-021-02073-3.
- Ji H, Li Y, Fan Z, Zuo B, Jian X, Li L, Liu T, et al. Monocyte/lymphocyte ratio predicts the severity of coronary artery disease: a syntax score assessment. BMC Cardiovasc Disord. 2017;17(1):90.doi:10.1186/s12872-017-0507-4.
- İdil Soylu A, Arıkan Cortcu S, Uzunkaya F, Atalay YO, Bekçi T, Güngör L, Belet Ü, et al. The correlation of the platelet-to-lymphocyte ratio with the severity of stenosis and stroke in patients with carotid arterial disease. Vascular. 2017;25(3):299–306.doi:10.1177/1708538116673770.
- Gong S, Gao X, Xu F, Shang Z, Li S, Chen W, Yang J, Li J, et al. Association of lymphocyte to monocyte ratio with severity of coronary artery disease. Medicine (Baltimore). 2018;97(43):e12813.doi:10.1097/MD.0000000000012813.
- Gasparyan AY, Ayvazyan L, Mukanova U, Yessirkepov M, Kitas GD, et al. The platelet-to-Lymphocyte ratio as an inflammatory marker in rheumatic diseases. Ann Lab Med. 2019;39(4):345–57.doi:10.3343/alm.2019.39.4.345.
- Zhang WB, et al. A high neutrophil-to-lymphocyte ratio predicts hemorrhagic transformation of large atherosclerotic infarction in patients with acute ischemic stroke. Aging (Albany NY). 2020;12(3):2428–39.doi:10.18632/aging.102752.
- Yayla Ç, et al. A novel marker of inflammation in patients with slow coronary flow: lymphocyte-to-monocyte ratio. Biomark Med. 2016;10(5):485–93.doi:10.2217/bmm-2016-0022.
- Yorgun H, Kabakçı G, Canpolat U, Aytemir K, Fatihoğlu G, Karakulak UN, Kaya EB, Şahiner L, Tokgözoğlu L, Oto A, et al. Frequency and predictors of renal artery stenosis in hypertensive patients undergoing coronary angiography. Angiology. 2013;64(5):385–90.doi:10.1177/0003319712451900.
- Shukla AN, Madan TH, Jayaram AA, Kute VB, Rawal JR, Manjunath AP, Udhreja S, et al. Prevalence and predictors of renal artery stenosis in patients undergoing peripheral and coronary angiography. Int Urol Nephrol. 2013;45(6):1629–35.doi:10.1007/s11255-013-0435-x.
- Lee Y, Shin J-H, Park H-C, Kim SG, Choi S-I, et al. A prediction model for renal artery stenosis using carotid ultrasonography measurements in patients undergoing coronary angiography. BMC Nephrol. 2014;15(1):60.doi:10.1186/1471-2369-15-60.