
Abstract
Background
The dynamic and uncontrolled nature of paramedic work frequently exposes these workers to physical and psychological injury. Often paramedic injury rates are estimated based on national injury surveillance data or compensation databases. These data sources tend to only capture cases of a more serious nature and overlook the broader factors that contribute to injury. This limits our understanding of the true burden of paramedic injury and the characteristics associated with increased injury severity.
Objectives
To describe the incidence and proportions of paramedic occupational injury in Victoria, Australia, and to determine the injury-related characteristics associated with lost time from work.
Methods
A retrospective analysis of paramedic injury report data from the single state-wide ambulance service in Victoria, Australia – Ambulance Victoria. Injuries reported between 1 January 2015 and 30 June 2020 were included. Chi-square tests of independence were used to explore shift and injury characteristic variables that may be associated with time lost from work.
Results
Over the study period, 7,591 paramedic injuries were reported that met the inclusion criteria, of which 2,124 (28%) resulted in lost time from work. The cumulative incidence of paramedic injury was 333.8 injuries per 1,000 FTE workers per year, and the rate of lost time injury was 93.0 per 1,000 FTE workers per year. Musculoskeletal injuries were the most frequently reported injury type irrespective of lost time status. Manual handling followed by psychological stressors were the two leading mechanisms of injury based on incidence. Psychological injury was associated with lost time from work (X2= 384.2, p < 0.001). Conversely, injury to the head and neck (X2= 7.5, p = 0.006), and upper limb injuries (X2= 104.5, p < 0.001), were more strongly associated with no lost time from work.
Conclusions
Paramedics working in Victoria have a higher rate of work-related injury than other Australian workers. Injury-related factors that are often overlooked, such as time, shift type, location, and injury characteristics, all contribute to an increased risk of lost time injury. An understanding of the factors that contribute to an increase in injury severity may facilitate the development and targeting of appropriate interventions.
Introduction
Paramedics and other emergency medical service (EMS) workers attend, assess, and manage medical, trauma, and psychosocial events outside of the hospital environment (Citation1–5). Unique to this health care profession, the assessment and management of these events occurs in highly variable and uncontrolled work environments, such as peoples’ homes, poorly illuminated locations, unstable or uneven terrain, during adverse weather conditions, and on public roads during operational response driving. Furthermore, the nature of paramedic work also sees workers encounter other high-risk factors for physical and psychological injury, such as exposure to violent and aggressive patients or bystanders, and frequent exposure to trauma, social disadvantage, death, and dying (Citation6). The regular exposure to these factors can increase the risk of paramedics becoming injured at work (Citation6, Citation7).
While evidence indicates that paramedics are at increased risk of work-related injury, there are significant challenges that limit our understanding of the true size and burden of injury among these workers. In a recent systematic review (Citation8), the incidence of paramedic occupational injury among the included studies varied considerably among studies using data obtained from national injury surveillance systems or compensation databases compared with EMS organization-level data, with injury rates ranging from 29.7 to 345.6 injuries per 1,000 workers per year. This variability is largely due to the differing data collection methods and case inclusion criteria used by various injury surveillance systems.
To date, much of the paramedic injury research exploring the magnitude of injury is based on data obtained from national injury surveillance systems and compensation databases (Citation1–4, Citation7, Citation9–14). Although these sources typically provide high-quality data and capture most cases of severe injury, they often do not capture cases spanning the whole injury spectrum (Citation15). This limits our understanding of the true burden of injury among this cohort.
There is further complexity when trying to directly compare injury rates from state-based or national injury surveillance systems and organizational-level injury reporting systems, given the inherent differences in the way the data are collected. This includes variability in case definitions and measurement of injury severity. Severity of injury is often quantified by metrics such as lost workdays, total compensation paid (Citation16, Citation17), or lost time from work. Again, however, the definition of “lost time,” is highly variable. For example, the National Data Set for Compensation-Based Statistics compiled by Safe Work Australia measures lost time in working weeks and comprises the period for which compensation is paid (Citation17). Conversely, the United States Bureau of Labor Statistics, classifies lost time as at least 1 day away from work with or without days of job transfer or restriction (Citation18). Despite these variations in definitions, time lost from work can remain a valuable metric of injury severity.
However, by only including cases that meet the threshold for compensation or full shift absence, the number of time lost injuries is likely to be significantly underestimated. When trying to estimate the true magnitude of injury and understand the burden, broader definitions of lost time may be used. For example, classifying cases that result in any period of lost time from work, irrespective of duration, could be categorized as time lost cases. This will facilitate the capture and accurate classification of minor time lost injury cases that may have occurred in the late stages of a shift, or just prior to rostered days off.
While time lost from work is a useful metric for injury severity, it is only one aspect of understanding the true nature of paramedic work-related injury. Other factors such as the relationship between injury severity and various shift and injury-related characteristics are rarely explored, despite many injury surveillance systems routinely collecting the required information.
These limitations can potentially be offset by using organizational-level data directly from EMS workplace injury datasets. The broader case definitions and case inclusion criteria mean that these datasets have the potential to capture a greater number of injury cases, providing improved accuracy of injury rates. Furthermore, greater detail on the events associated with injury can be obtained by such datasets – including, for example, shift and call-out characteristics.
This study uses workplace injury data from a state-based EMS organization in Australia to describe the incidence and proportions of paramedic occupational injury in Victoria, Australia, and determine the injury-related characteristics associated with lost time from work.
Methods
Study Design
This study involved a retrospective analysis of paramedic injury and incident report data captured within the Ambulance Victoria (AV) centralized hazard, incident, and injury reporting database – the Health, Safety and Claims System (HSCS). All paramedic incident and injury reports that occurred between 1 January 2015 and 30 June 2020 that resulted in physical or psychological injuries were included in the study.
Setting
The Australian state of Victoria is the second most populous state with an estimated population of 6.68 million, of whom 77% live within the state capital of Melbourne (Citation19). In the state of Victoria, all prehospital emergency care is provided by a single EMS agency. In the 2019–2020 financial year, AV responded to over 633,000 emergency cases across the state, using road, helicopter, and fixed-wing vehicles (Citation20). As of the 2019–2020 financial year, AV’s operational workforce comprised 4,336.6 full-time equivalent (FTE) clinical staff, including intensive care paramedics, advanced life support paramedics, and other employed and volunteer on-road clinical staff (Citation20).
Data Source
All AV hazard, incident, and injury reports are completed and managed online via the HSCS, an internally managed, centralized database established to capture all reported employee health and safety related incidents. The software is based on an adapted form of the RiskCloud.net health and safety architecture, developed by PAN Software. The system comprises more than 60 data elements and provides a systematic way of full lifecycle incident management control, from the initial reporting phase to investigation and control development.
Following an incident or injury, staff log onto the HSCS to complete an online report. Staff are required to report injuries within 48 hours of their occurrence, or as soon as they are available. The staffs completing the report are prompted to answer a series of questions relevant to the incident or injury. These questions focus on several elements, such as time, date, and location of the incident, demographic details, shift characteristics, and post-injury care. Injury specific characteristics, for example, the mechanism and agency of injury are also collected throughout the questionnaire and classified based on the Australian Type of Occurrence Classification System (Citation21). Injuries of all severities are eligible to be reported into the HSCS, and the reporting of very minor injuries is strongly encouraged within the organization. Once submitted, the report is shared with relevant managers and organizational occupational health and safety staff for incident investigation, review, and control implementation. Responsible managers are required to conduct their investigations within 10 days of submission. Members of the health and safety team review submitted injury reports to ensure they are complete and accurate. There is the opportunity for user follow-up if clarification or further details are required. Injury reports relating to organizational priority areas (currently manual handling and violence-related cases) are reviewed monthly by specialist review groups to ensure completeness of the data.
Data Analysis
Prior to analysis, data were screened, and duplicate cases removed. Injuries affecting university student paramedics on clinical placement were excluded. Occupational injury was defined as any physical or psychological injury that occurred in the workplace, or as a result of work. Psychological injuries included any report of cognitive, emotional, or behavioral symptoms attributed to work, and supported with documentation from mental health care workers or other clinicians. Incident reports that were a result of exposure to potentially infectious agents were removed due to the focus of this article being on injury occurrence rather than hazard exposure. Further, due to incubation periods delaying symptom onset, and the potential for infectious disease exposures to occur outside of the workplace, it is difficult to definitively classify reports of illness as being of workplace origin. Therefore, in this article, cases of infectious disease exposure were only included if the incidents involved sharps, resulted in psychological injuries, or where exposure was attributed to occupational violence. In these circumstances, the cases were recoded to reflect the new classifications.
The primary outcome measure was lost time from work. Lost time was defined as any period lost from work where the individual was no longer able to undertake his or her rostered duties. This included any rostered time remaining in the individual’s current shift at time of injury, provided that the shift was not completed.
Paramedic injury rates were based on working estimates of 40 hours per week over 48 weeks per year. Hours worked per week and annual leave estimates were obtained from the standard AV paramedic full-time employee contract and the Ambulance Victoria Enterprise Agreement 2020. It must be noted that the estimated 40 work hours per week is conservative, as most full-time paramedics working in Victoria operate on a four-day-on, four-day-off cycle, and regularly undertake incidental overtime. Annual denominator data were obtained from publicly available AV annual reports. Injury rates were calculated by multiplying the total number of injuries each year by the total hours worked by 1,000 workers per year, divided by the total hours worked by the entire workforce. This provided an injury rate based on 1,000 FTE workers per year.
Time of injury (Time Occurred) was categorized into six, 4-hour epochs to differentiate between key shift time periods. The specific time periods were chosen to reflect the relationships between time of day and risk of shift worker injury observed in previous studies (Citation22).
Descriptive statistics including frequencies and percentages were used to describe the characteristics of the sample. Chi-square tests of independence were used to explore shift and injury characteristic variables that may be associated with time lost from work. The strength of association was measured using Phi (Φ) for 2 × 2 variable contingency and Cramer’s V (Φc) for greater than 2 × 2 variable contingency. In the event of a statistically significant chi-square omnibus test finding, adjusted residuals were calculated to identify the specific variables contributing to the magnitude of the chi-square result within each category. Chi-square values and p-values were re-calculated. Given the number of variables included in the analyses, a Bonferroni correction was applied to reduce the risk of a Type 1 statistical error (Citation23). The threshold for statistical significance was conservatively set to p < 0.01.
All statistical analyses were conducted using SPSS version 27 (IBM Corp., 2020).
Ethics
This study was approved by the Ambulance Victoria Research Governance Committee and the Monash University Human Research Ethics Committee.
Results
A total of 8,867 injury reports were submitted over the 5.5 year study period. Of these 7,591 paramedic injuries met the inclusion criteria for this study, of which 2,124 (28%) resulted in lost time from work.
Incidence of Injury
The cumulative incidence of paramedic injury over the entire study period was 333.8 injuries per 1,000 FTE workers per year (). The rate of lost time injury (LTI) over the study period was more than two-and-a-half times lower than the rate of injuries resulting in no lost time from work (93.0 vs. 240.8 injuries per 1,000 FTE workers per year).
Table 1. Incidence of injury.
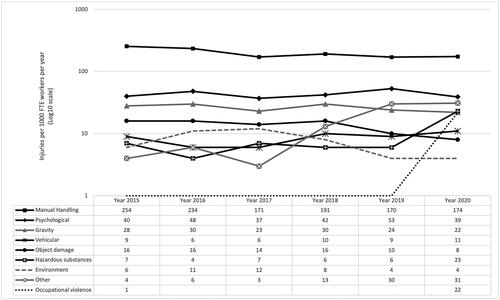
The mean rates of injury based on injury type and mechanism are summarized in and , respectively. Musculoskeletal injuries had the highest mean injury rate (212.0 per 1,000 FTE per year) of all injury types (). For mechanisms of injury, manual handling (198.4 per 1,000 FTE per year), followed by psychological stressors (43.6 per 1,000 FTE per year), were the two leading mechanisms based on rate of occurrence ().
Table 2. Mean rate of injury based on injury type.
Table 3. Mean rate of injury based on mechanism.
When expanding this to examine trends in the rates of injury based on these injury characteristics, all injury types, with the exception of fractures, neurological, and musculoskeletal injuries, experienced overall increases between 2015 and 2020 (). Similarly, hazardous substances, occupational violence, vehicle-related factors, and mechanisms classified as “other” also experienced overall increases in the rate of injury over the study period ().
Figure 1. Injury rate trends based on injury type. Abbreviations: FTE, full-time equivalent.
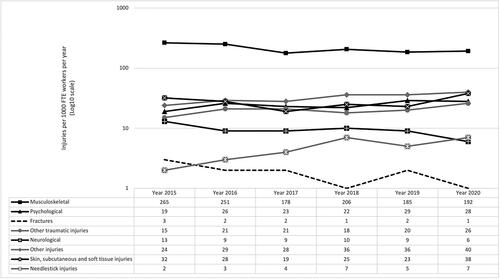
Figure 2. Injury rate trends based on the mechanism of injury. Abbreviations: FTE, full-time equivalent.
Factors Associated with Lost Time Injury
The shift and injury-related characteristics associated with paramedic LTI are summarized in and outlined below. Post hoc analyses with adjusted residuals for shift and injury-related characteristics associated with LTI are presented in Appendix A.
Table 4. Proportions and significance of shift and injury-related characteristics on lost time injury.
Shift Characteristics
Time and Date
There was no significant difference between the LTI and no lost time injuries (NLTI) groups based on year of injury occurrence (X2 8.97, df = 5, p = 0.110) or calendar month (X2 = 10.51, df = 11, p = 0.486). The greatest proportion of all injuries occurred between the hours of 08:01 and 20:00 (64%), when 66% of LTI and 63% of NLTI occurred. There was a statistically significant difference between the two groups for time of injury occurrence (X2 = 39.25, df = 5, p < 0.001. Φc = 0.073). Pairwise comparisons with adjusted p-values showed that a significantly greater proportion of the LTI group had injuries that occurred between 12:01 and 16:00 compared to the NLTI group (X2 = 14.75, p < 0.001).
Shift Completion
Percentage of shift completion was a measure of the proportion of the shift that the worker had completed at the time of his or her injury. There was a statistically significant difference between the percentage of the shift completed and the two groups (X2 = 59.75, df = 5, p < 0.001. Φc = 0.089). The first quarter of the shift accounted for 26% of all injuries. Overall, 47% of all injuries occurred in the first half of the shift and 41% in the last half. Injuries occurring during overtime accounted for 4% of all injuries.
LTIs were more frequently reported in the last quarter of the shift (X2 = 13.03, p < 0.001). Injuries resulting in lost time from work were more representative of cases where the proportion of shift completion was classified as “other” (X2 = 30.36, p < 0.001). These cases may include injuries that did not occur on a specific shift.
Shift Type
There was a significant association between shift type and lost time (X2 = 85.08, df = 6, p < 0.001. Φc = 0.108). Almost half (46%) of all injuries were reported to have occurred during afternoon shifts or nightshifts, whilst 37% occurred on either of the two dayshifts. The first dayshift and the first nightshift each accounted for the greatest singular proportion of LTI (21%) and NLTI (21%), respectively. Injuries occurring during afternoon shifts (X2 = 8.64, p = 0.003) and shift types classified as “other” (X2 = 33.76, p < 0.001) more commonly resulted in lost time from work.
Shift and Scene Location
More than one quarter of all injuries were categorized as occurring “on scene.” When expanding this classification to include public areas and the residential setting, this location accounted for 53% of all LTI and 56% of NLTI. Overall, there was a statistically significant variation between the two groups and location of injury (X2 = 49.32, df = 8, p < 0.001. Φc = 0.081). A greater proportion of injuries classified as “other” (X2 = 15,52, p < 0.001) or those that occurred at an ambulance branch (X2 = 4.54, p < 0.001), resulted in LTI, while more hospital-related injuries resulted in NLTI (X2 = 8.29, p = 0.004). Comprising of almost two-thirds of the workforce, the metropolitan region accounted for the largest proportion (64%) of all injuries. There was no statistically significant variation in proportion of injuries based on region (X2 = 5.20, df = 5, p = 0.392. Φc = 0.026).
Injury Characteristics
Agency of Injury
Humans, either the injured individuals themselves due to fatigue or preexisting disability or illness (Citation21), or other individuals, were identified as the single largest agency of injury (AOI) (38%), followed by injuries attributed to equipment (28%). There was a statistically significant difference in the proportions of AOI between the two groups (X2 = 118.79, df = 5, p < 0.001. Φc = 0.125). AOI categorized as “other” accounted for a significantly larger proportion of LTI compared to NLTI.
Location of Injury
There was a significant association between bodily location of injury and injury classification (X2 = 445.28, df = 6, p < 0.001. Φc = 0.242). Injuries to the trunk were the single most reported bodily location of injury for both injury classifications (40%). Psychological injuries were associated with LTI (X2 = 384.16, p < 0.001), with the proportion of injury being more than five times greater than that of NLTI (16% versus 3%).
Injury Type
Musculoskeletal injures accounted for the greatest proportion (64%) of all injury types. Injuries classified as “other” (10%) and injuries to the skin, subcutaneous, and soft tissue (8%) were the next most prevalent. Psychological injuries were the resulting injury type in 7% of all injury cases. There was a significant difference in proportion of injury types between the two groups (X2 = 525.86, df = 7, p < 0.001. Φc = 0.263). Significantly greater proportions of psychological injuries (X2 = 386.91, p < 0.001), fractures (X2 = 41.60, p < 0.001), and neurological injuries (X2 = 8.41, p < 0.001) resulted in LTI in comparison to those resulting in NLTI.
Mechanism of Injury
Manual handling was identified as the primary mechanism of injury for all injuries (62%), followed by psychological impacts (14%). There was a statistically significant variation in proportions of mechanism of injury between the two groups (X2 = 189.52, df = 8, p < 0.001. Φc = 0.160). A significantly greater proportion of psychological injuries (20% vs. 11%) (X2 = 114.70, p < 0.001) and vehicle-related injuries (X2 = 6.97, p = 0.008) were seen in the LTI group.
Post Injury Care
Two-thirds of all injuries did not receive first aid treatment. First aid was provided to 34% of all NLTI and 32% of all LTI. There was no statistically significant variation in the provision of first aid between the two groups (X2 = 4.58, df = 1, p = 0.032. Φ = −0.025). Medical treatment was provided to 29% of all injuries. The majority (57%) of LTI received medical treatment compared to 19% of all NLTI (X2 = 1114.31, df = 1, p < 0.001. Φ = 0.383).
Discussion
To our knowledge, this is the first study to use EMS agency level injury data to examine the incidence of paramedic injury in Victoria, Australia and determine the factors associated with lost time from work. Shift time, type, and location were associated with lost time from work following injury. Agencies classified as other; fractures, psychological, and neurological injuries; and psychological or vehicle related mechanisms were all associated with lost time from work.
Incidence of Injury
Over the 5.5 year study period, the mean rate of paramedic injury was 333.8 injuries per 1,000 FTE workers per year. This rate is consistent with mid to high injury rate estimates in other EMS injury studies (Citation5, Citation24, Citation25), and considerably higher than estimates based on national injury surveillance system and compensation data (Citation3, Citation4, Citation9, Citation11–13). However, when focusing on cases resulting in lost time, the mean LTI incidence of 93.0 injuries per 1,000 FTE workers per year in this study is consistent with paramedic injury rates based on hospital emergency department presentations (Citation4, Citation13). When making comparisons to other emergency services, the mean LTI rate observed in this study is comparable to compensation rates seen in Australian police (91 per 1,000 FTE workers per year) and fire services (101 per 1,000 FTE workers per year) between 2004 and 2012 (Citation9). Although these professions have their own unique challenges, they share many similar attributes with EMS, for example, lights and sirens driving, working in unfamiliar and uncontrolled environments, shift work, and repeat exposure to traumatic incidents.
In this study, musculoskeletal injuries had the highest rate of injury, with a mean of 212.0 injuries per 1,000 FTE workers per year over the study period. This rate is higher than those seen in previous EMS agency-level studies (Citation5, Citation12, Citation24), but consistent with musculoskeletal injury rates of ambulance services after powerlift stretcher implementation (Citation25). The incidence of musculoskeletal injuries in this study declined drastically in 2017, before remaining relatively stable for the remainder of the study. This reduction in 2017 coincides with AV’s gradual replacement of all manual lift stretchers to a powerlift model, which began in late 2016. As manual handling is the primary contributing factor to the occurrence of musculoskeletal injuries (Citation3–5, Citation9, Citation11–13, Citation24), the significant reduction in the incidence of manual handling injuries from 2017 may be partially reflective of this engineering solution, but also other organization-wide programs and initiatives. For example, in 2016 all AV paramedics undertook mandatory in-person training focused on worker safety, such as how to conduct a dynamic risk assessment, the principles of risk management, and safety culture within the organization. The module focusing on organizational safety culture sought to provide clarity and direction of the safety-related behaviors, actions, and attitudes that are expected within the organization to drive behavioral change. Irrespective of the primary mitigating factor, the findings of this study may highlight the benefit of engineering solutions, safety awareness training, and changes in organizational safety culture on injury risk reduction in the workplace.
The rates of psychological injury, and injury attributed to psychological stressor exposure in this study, were between one-and-a-half to three times greater than the rate of mental health claims among Australian paramedics and ambulance officers between 2006 and 2015 (Citation9, Citation14). Despite the paramedic rate of psychological injury seen in this study being greater than existing research, it is likely that these figures are still an underrepresentation of the true effects of psychological injury among these workers. In a large Australian survey focused on the mental health of emergency services personnel (Citation26), stigma was identified as a significant barrier to psychological injury reporting. While Australian paramedics tend not to hold stigmatizing mental health attitudes to their colleagues, self-stigma is common, with 58% of surveyed paramedics stating that they would avoid telling others about their mental health issues, primarily due to embarrassment and thoughts of being able to self-manage (Citation26). Consequently, stigma and self-stigma may be factors driving the underreporting of psychological injuries, diminishing the psychological injury rates presented in this article.
Another explanation for the higher rates of all types of injury seen in this study compared to other EMS injury studies, and a strength of agency-level data, is greater case capture due to lower thresholds for injury reporting and case inclusion (Citation8). However, often agency-level data, including those used in this study, are limited by the measure used for injury severity. As with this study, lost time is often used in industry as a metric for severity, as it is reflective of lost productivity and easily measured (Citation16). Though, one of the challenges with this approach is the inability of a binary classification system to be able to differentiate between the extent or complexity of an injury, as injuries that meet the threshold for lost time classification may vary considerably in terms of severity (Citation16). Despite the injury rate of LTI being consistent with previous studies based on hospital emergency department presentations, measures such as lost workdays or compensation payments may be more representative of the severity of injury as they provide a clear indication of the burden and consequences of injury on the individual, and the organization (Citation16). Although there are significant limitations to using lost time as a metric for injury severity, it does still have some merit. While lost time as a binary measure is unable to differentiate between other LTI cases based on severity, when comparing to injury cases that resulted in no lost time, it can still serve as a high-level measure of effect on agencies, albeit without a clearly defined consequence, where no other more appropriate metrics are available.
Factors Associated with Lost Time Injury
In this study, there was a relationship between various case characteristics and LTI. Time of injury, location, shift type, and proportion of shift completion, were all associated with lost time from work.
A significantly greater proportion of LTIs occurred between the hours of peak operational workload for the organization (12:01–16:00).Previous studies have highlighted a strong link between high call volume, infrequent or absent rest breaks, and long shift duration with paramedic physical and psychological injury (Citation5, Citation27–33). One of the key risk factors associated with paramedic injury during high demand periods, and with shift work in general, is fatigue. High rates of fatigue are commonly reported among EMS workers. In one study, 56% of respondents reported experiencing fatigue while at work (Citation34). Fatigue is a strong risk factor for paramedics sustaining physical and psychological injuries (Citation28, Citation35–39) as it impedes cognition leading to reduced alertness, increased risk taking behaviors, and poor decision-making and judgment (Citation37).
Agencies of injury that were classified as “other” were associated with lost time from work. These cases may be representative of an agency that is not clearly identifiable or definable, for example musculoskeletal injury due to repetitive stress on tissues over an extended period, or psychological injury due to cumulative exposure to traumatic events. Of all injury types and mechanisms examined in this study, psychological injuries and injuries attributed to psychological stressors had the strongest association with lost time from work. Psychological distress and injury are pervasive in the EMS sector (Citation40, Citation41), and have profound effects on the individuals, their families, professional and social networks, and the organizations in which they are employed (Citation42, Citation43). While there is some understanding of the factors and circumstances that contribute to paramedic work-related psychological injury, for example sleep disturbances (Citation34, Citation36, Citation44) and exposure to traumatic incidents (Citation45, Citation46), there is little understanding of the broader, more indirect factors, such as case and dispatch characteristics, that may increase the risk of sustaining a psychological injury at work. Further exploration of these broader factors and how they influence the occurrence of psychological injuries among paramedics is required to understand how to target risk reduction measures and interventions, appropriately, and effectively, in a timely and considered manner.
Limitations
This study has several limitations. Due to data only being captured for half of the year of 2020, the incidence of injury and proportions presented in this study for that year may not be representative of the actual rates that occurred. Furthermore, despite the broad definition of lost time for work used in this study being advantageous in capturing more injury cases then other national injury surveillance definitions, the broad definition means it cannot be reliably used a metric of injury severity. Consequently, lost time may not be the most appropriate metric to be used in this study – this was a limitation of the dataset used. Another limitation of the dataset used in this study was its restriction to include data used for administrative purposes only. This meant that the provided dataset did not include demographic data and was limited in its scope to capture shift and injury-related characteristics. As this study sought to describe and define the factors associated with paramedic injury, by only focusing on basic shift and injury-related characteristics, this study is unable to provide a robust and holistic understanding of the influence of broader factors related to paramedic injury.
Conclusion
Using data obtained for a single state-wide ambulance service in Victoria, Australia, the findings of this study further reinforce the increased risk of injury paramedics encounter at work, with an incidence of injury considerably higher than that of the Australian general population. Key findings to inform risk prevention strategies included the role that shift time and duration have on the severity of injury, musculoskeletal injuries accounting for the greatest proportion of LTI, and psychological injuries be strongly associated with absence from work. Despite this study describing several factors associated with paramedic injury, further research is required to explore additional broader factors that may contribute to the occurrence of injury at work, so that risk reduction strategies and interventions can be targeted appropriately. This will entail linkage with additional organizational data sources and fields such as patient, case, dispatch, practitioner, and organizational factors, and link these with compensation data to better understand the broader factors contributing to paramedic injury and the overall burden.
Disclosure Statement
The authors report there are no competing interests to declare.
References
- Maguire BJ. Violence against ambulance personnel: a retrospective cohort study of national data from Safe Work Australia. Public Health Res Pr. 2018;28(1):e28011805. doi:10.17061/phrp28011805.
- Maguire BJ, O'Neill BJ. Emergency medical service personnel’s risk from violence while serving the community. Am J Public Health. 2017;107(11):1770–5. doi:10.2105/AJPH.2017.303989.
- Reichard AA, Jackson LL. Occupational injuries among emergency responders. Am J Ind Med. 2010;53(1):1–11. doi:10.1002/ajim.20772.
- Reichard AA, Marsh SM, Tonozzi TR, Konda S, Gormley MA. Occupational injuries and exposures among emergency medical services workers. Prehosp Emerg Care. 2017;21(4):420–31. doi:10.1080/10903127.2016.1274350.
- Weaver MD, Patterson PD, Fabio A, Moore CG, Freiberg MS, Songer TJ. An observational study of shift length, crew familiarity, and occupational injury and illness in emergency medical services workers. Occup Environ Med. 2015;72(11):798–804. doi:10.1136/oemed-2015-102966.
- Sterud T, Ekeberg O, Hem E. Health status in the ambulance services: a systematic review. BMC Health Serv Res. 2006;6(1):82.
- Roberts MH, Sim MR, Black O, Smith P. Occupational injury risk among ambulance officers and paramedics compared with other healthcare workers in Victoria, Australia: analysis of workers’ compensation claims from 2003 to 2012. Occup Environ Med. 2015;72(7):489–95. doi:10.1136/oemed-2014-102574.
- Kearney J, Muir C, Smith K. Occupational injury among paramedics: a systematic review. Inj Prev. 2022;28(2):175–84. doi:10.1136/injuryprev-2021-044405.
- Gray SE, Collie A. The nature and burden of occupational injury among first responder occupations: a retrospective cohort study in Australian workers. Injury. 2017;48(11):2470–7. doi:10.1016/j.injury.2017.09.019.
- Maguire BJ. Transportation-related injuries and fatalities among emergency medical technicians and paramedics. Prehosp Disaster Med. 2011;26(5):346–52. doi:10.1017/S1049023X11006601.
- Maguire BJ, Smith S. Injuries and fatalities among emergency medical technicians and paramedics in the United States. Prehosp Disaster Med. 2013;28(4):376–82. doi:10.1017/S1049023X13003555.
- Miller A. Emergency medical service personnel injury and fatality in the United States. JER. 2018;4(2):9–18. doi:10.5430/jer.v4n2p9.
- Reichard AA, Marsh SM, Moore PH. Fatal and nonfatal injuries among emergency medical technicians and paramedics. Prehosp Emerg Care. 2011;15(4):511–7. doi:10.3109/10903127.2011.598610.
- Xia T, Collie A. Work-related injury and illness in the Victorian healthcare sector: a retrospective analysis of workers’ compensation claim records. Aust Health Review. 2020;44(1):24–30. doi:10.1071/AH18017.
- Rosenman KD, Kalush A, Reilly MJ, Gardiner JC, Reeves M, Luo Z. How much work-related injury and illness is missed by the current national surveillance system? J Occup Environ Med. 2006;48(4):357–65. doi:10.1097/01.jom.0000205864.81970.63.
- O’Neill S, Martinov-Bennie N, Cheung A, Wolfe K. Issues in the measurement and reporting of work health and safety performance: a review. Safe Work Australia, Safety Institute of Australia and CPA Australia; 2013.
- Safe Work Australia. National dataset for compensation-based statistics. 3rd ed. (Revison 1). Canberra: ACT; 2020.
- United States Bureau of Labor Statistics. Nonfatal occupational injuries and illnesses; 2021. Available from: https://www.bls.gov/iif/soii-overview.htm.
- Australian Bureau of Statistics. Population – Victoria; 2021. Available from https://www.abs.gov.au/statistics/people/population/national-state-and-territory-population/sep-2020.
- Ambulance Victoria. 2019–2020 annual report. Melbourne, Australia: Ambulance Victoria; 2020.
- Australian Safety and Compensation Council. Type of occurrence classification system. 3rd ed. Canberra: ACT 2008.
- Mustard CA, Chambers A, McLeod C, Bielecky A, Smith PM. Work injury risk by time of day in two population-based data sources. Occup Environ Med. 2013;70(1):49–56. doi:10.1136/oemed-2012-100920.
- Field AP. Discovering statistics using IBM SPSS statistics. 5th edition, North American Edition. Thousand Oaks, California: Sage Publications Inc.; 2018.
- Maguire BJ, Hunting KL, Guidotti TL, Smith GS. Occupational Injuries among emergency medical services personnel. Prehosp Emerg Care. 2005;9(4):405–11. doi:10.1080/10903120500255065.
- Studnek JR, Crawford JM, Fernandez AR. Evaluation of occupational injuries in an urban emergency medical services system before and after implementation of electrically powered stretchers. Appl Ergon. 2012;43(1):198–202. doi:10.1016/j.apergo.2011.05.001.
- Beyond Blue. Answering the Call national survey, National Mental Health and Wellbeing Study of Police and Emergency Services. Melbourne, Australia; 2018.
- Gentzler M, Stader S. Posture stress on firefighters and emergency medical technicians (EMTs) associated with repetitive reaching, bending, lifting, and pulling tasks. Work. 2010;37(3):227–39.
- Studnek JR, Ferketich A, Crawford JM. On the job illness and injury resulting in lost work time among a national cohort of emergency medical services professionals. Am J Ind Med. 2007;50(12):921–31. doi:10.1002/ajim.20516.
- Hamling K. Wellbeing across occupations and in the emergency services: A mixed methods study: Auckland University of Technology 2018.
- Mahony K. Restructuring and the production of occupational stressors in a corporatised ambulance service. Heal sociol Rev. 2005;14(1):84–96. doi:10.5172/hesr.14.1.84.
- Berger W, Figueira I, Maurat AM, Bucassio ÉP, Vieira I, Jardim SR, Coutinho ESF, Mari JJ, Mendlowicz MV. Partial and full PTSD in Brazilian ambulance workers: prevalence and impact on health and on quality of life. J Traum Stress. 2007;20(4):637–42. doi:10.1002/jts.20242.
- Regehr C, Millar D. Situation critical: high demand, low control, and low support in paramedic organizations. Traumatology. 2007;13(1):49–58. doi:10.1177/1534765607299912.
- Koritsas S, Boyle M, Coles J. Factors associated with workplace violence in paramedics. Prehosp Disaster Med. 2009;24(5):417–21. doi:10.1017/s1049023x0000724x.
- Pyper Z, Paterson JL. Fatigue and mental health in Australian rural and regional ambulance personnel. Emerg Med Australas. 2016;28(1):62–6. doi:10.1111/1742-6723.12520.
- Courtney J, Francis A, Paxton S. Caring for the country: fatigue, sleep and mental health in Australian rural paramedic shiftworkers. J Community Health. 2013;38(1):178–86. doi:10.1007/s10900-012-9599-z.
- Khan WAA, Conduit R, Kennedy GA, Jackson ML. The relationship between shift-work, sleep, and mental health among paramedics in Australia. Sleep Health. 2020;6(3):330–7. doi:10.1016/j.sleh.2019.12.002.
- Ramey S, MacQuarrie A, Cochrane A, McCann I, Johnston CW, Batt AM. Drowsy and dangerous? Fatigue in paramedics: an overview. Ir J of Paramedicine. 2019;4(1):1–9. doi:10.32378/ijp.v4i1.175.
- Tam GYT, Yeung SS. Perceived effort and low back pain in non-emergency ambulance workers: implications for rehabilitation. J Occup Rehabil. 2006;16(2):225–34. doi:10.1007/s10926-006-9019-2.
- van der Ploeg E, Kleber RJ. Acute and chronic job stressors among ambulance personnel: predictors of health symptoms. Occup Environ Med. 2003;60(>90001):40i–46. doi:10.1136/oem.60.suppl_1.i40.
- Jones S. Describing the mental health profile of first responders: a systematic review. J Am Psychiatr Nurses Assoc. 2017;23(3):200–14.
- Petrie K, Milligan-Saville J, Gayed A, Deady M, Phelps A, Dell L, et al. Prevalence of PTSD and common mental disorders amongst ambulance personnel: a systematic review and meta-analysis. Int J Res Social Gene Epidem Mental Health Ser. 2018;53(9):897–909.
- Bernaldo-De-Quirós M, Piccini AT, Gómez MM, Cerdeira JC. Psychological consequences of aggression in pre-hospital emergency care: cross sectional survey. Int J Nurs Stud. 2015;52(1):260–70. doi:10.1016/j.ijnurstu.2014.05.011.
- Thyer L, Simpson P, Van Nugteren B. Burnout in Australian paramedics. Int Param Prac. 2018;8(3):48–55. doi:10.12968/ippr.2018.8.3.48.
- Courtney JA, Francis AP, Paxton SJ. Caring for the carers: fatigue, sleep, and mental health in Australian Paramedic Shiftworkers. Australian and New Zealand J Organis Psychol. 2010;3(1):32–41. doi:10.1375/ajop.3.1.32.
- Fjeldheim CB, Nöthling J, Pretorius K, Basson M, Ganasen K, Heneke R, Cloete KJ, Seedat S. Trauma exposure, posttraumatic stress disorder and the effect of explanatory variables in paramedic trainees. BMC Emerg Med. 2014;14(1):11.
- Michael T, Streb M, Häller P. PTSD in paramedics: direct versus indirect threats, posttraumatic cognitions, and dealing with intrusions. Int J Cog Ther. 2016;9(1):57–72. doi:10.1521/ijct.2016.9.1.57.