
Abstract
The purpose of the article is to analyse the illegal marijuana market in Slovenia. We present an analysis of marijuana consumption patterns and point out which socio-economic and demographic groups are most inclined to marijuana use. We provide an empirical analysis of marijuana demand by calculating odds ratios and marginal effects based on logit and probit discrete choice models. We evaluate the likely size of the industry by estimating the level of consumption and retail expenditure by using data on the prevalence of marijuana use and its retail prices. Our findings provide insights to the marijuana consumption, offer support to government decision-making and evaluation of alternative policy approaches, and give estimates of the likely revenue that the government could raise by subjecting marijuana to taxation in a manner similar to fine-cut tobacco.
1. Introduction
Similarly to all other parts of the world (UNODC, Citation2015), marijuana is also the most widely used illicit drug in Slovenia. It is estimated that 15.8% of the Slovenian population aged 15 to 64 years had used marijuana at least once in their lifetime (NIJZ, Citation2012). Around 45% of people aged 16 years claim that marijuana is very easy to access (Stergar, Citation2011). Relatively mild criminal sanctions against possession, well adopted use and distribution of hydroponic equipment, and relaxing attitudes towards marijuana use help the underground economy to thrive. In the past few years, Slovenia has become an important producer of marijuana (Slovenska policija, Citation2009–2015), which coincides with the findings of growing availability of domestically produced cannabis in Europe (EMCDDA, Citation2015). The number of eradicated cultivation sites in Slovenia was higher by 88% in 2014 compared to 2010 (Slovenska policija, Citation2009–2015).
From the standpoint of both health and economics, marijuana is an important but still very insufficiently explored substance. In 2014, Colorado, Washington state and Uruguay (Room, Citation2014), and in 2015 Alaska and Oregon states (Toor, Citation2014) started an experiment by allowing cultyivation, possession, distribution and use of marijuana that only added pressure to the rest of the world for better acknowledgement of its domestic marijuana markets. In the mid- to long-term, it will be essential to thoroughly monitor the outcomes of those legalisation ‘experiments’, to assess how different theories passed stress testing built on conventional microeconomic analysis, and to calibrate further health and economic analysis of marijuana.
Proponents of alternative policy approaches to drug prohibition (e.g., Becker et al., Citation2006; Miron and Egan, Citation2005) increasingly raised global demand for research in the field. There are at least three different demand-side approaches used to evaluate marijuana consumption. The most complex of the three evaluates the demand for marijuana simultaneously with the demand for alcohol and tobacco (Clements et al., Citation2005; Citation2010); the second approach is based on individual self-reported expenditure on marijuana (Wilkins & Sweetsur, Citation2007), whereas the third approach uses prevalence estimates from one source and then combines them with estimates about quantity consumed and prices paid from another source (van Laar et al., Citation2013).
The purpose of this article is to analyse the marijuana market in Slovenia using data from the national survey on the prevalence of marijuana (NIJZ, Citation2012) and an online survey among Slovenian marijuana users, conducted specifically for this research. The goals of our research work are three-fold. First, we present a descriptive analysis of marijuana consumption patterns and point out which socio-economic and demographic groups are most inclined to marijuana use. Secondly, we providean empirical analysis of marijuana demand by calculating odds ratios and marginal effects based on discrete choice models. Thirdly, we evaluate the likely size of the industry by estimating the level of consumption and retail expenditure by using data on the prevalence of marijuana use and its retail prices.
We believe that the information from this article is essential for understanding the nature of marijuana consumers in Slovenia and similar transition countries, for improving government decision-making and evaluating alternative policy approaches, and to estimate the possible amount of revenue that the government could raise by subjecting it to taxation in a manner similar to fine-cut tobacco.
This article is structured as follows. Section 2 provides a review of available empirical and theoretical literature on the demand for marijuana and its economic consequences. In Section 3, the data and descriptive statistics are presented from a nationally representative household survey about Slovenian marijuana users. In Section 4, the applied methodology and the analysis of marijuana use in Slovenia are presented. In Section 5, we assess the monetary value of the current marijuana market in Slovenia. In Section 6, we consider the most evident risk factors associated with legalisation of marijuana, and estimate the plausible tax revenue. The article concludes with a summary of the main findings and some limitations of the research.
2. Literature review
There is a wide range of literature that investigates marijuana consumption. Information regarding the number of marijuana users and quantities they consume can be convenient for estimating the size of the black market, putting data on seizure and eradication into context, and providing decision makers with the data necessary for making regulatory decisions.
Most studies use general population surveys for estimating the scale of marijuana use, but there have been arguments that studies based on this data underestimate the true scale of the market, focusing on the surveys’ inability to reach the marijuana using population and users’ unwillingness to report their true conditions due to the fear of being stigmatised (Harrison et al., Citation2007; Johnson & Fendrich, Citation2005). Other researchers advocate that information collected from the household population is more relevant for understanding marijuana markets than it is for markets of harder drugs (Caulkins and Pacula, Citation2006).
Nevertheless, studies about conventional price elasticity of demand for marijuana reach as far back as to the year 1972 (Nisbet & Vakil, Citation1972), following some important advances in the understanding of consumer behaviour in relation to addictive goods consumption (Becker & Murphy, Citation1988). Econometric studies based on micro-level data have found significant correlation between observable socio-economic and demographic characteristics and marijuana use.
Inadequacy of reliable price data for marijuana also obstructs empirical estimation of price responsiveness. Where price data are available, economists have tried to estimate its price elasticity, but because available prices are often not individual-specific, estimated price effects vary widely across studies. Due to the absence of data on quantities consumed, price elasticities are generally reported in terms of participation probability (Cameron & Williams, Citation2001; Chaloupka et al., Citation1999a; DeSimone & Farrelly, Citation2003; Farrelly et al., Citation2001; Pacula et al., Citation2001; Ramful & Zhao, Citation2009; Saffer & Chaloupka, Citation1999; van Ours & Williams, Citation2007; Zhao & Harris, Citation2004).
Zhao and Harris (Citation2004) considered income as an indicator (social class proxy) of marijuana consumption and suggested that people from higher social classes are more aware of the health consequences of using marijuana, and therefore a higher income among the population leads the lower rates of marijuana use. A survey conducted on the basis of Australian household data revealed that a 10% increase in household income reduces the probability of using marijuana by 0.10 percentage point. For those who are already users, a 10% increase in income implies a 0.58 percentage point decrease in the probability that the user will fall into the category of more frequent users. Rhodes et al. (Citation2000) reported similar results based on data for the United States.
On the other hand, higher income might increase marijuana use among low income individuals, whereas existing users become even more frequent users. Ramful and Zhao (Citation2009), who applied a multivariate probit model that analysed correlations between marijuana, heroin and cocaine, reported that a 10% increase in income increases the probability of using marijuana by 0.06 percentage points.
Based on the above findings, we thus propose the following research hypothesis:
H1. Use of marijuana is related to socio-economic factors, such as education and household income.
Zhao and Harris (Citation2004) also considered age, gender, marital status and (un)employment status as indicators of marijuana consumption, and found statistically significant effects. They established that age had a negative relationship with marijuana consumption, men were more likely to consume marijuana, married persons were less likely to consume marijuana, and the unemployed were more likely to consume marijuana. Moreover, Clements and Zhao (Citation2005) investigated the effects of gender, marital status, type of household and employment status on marijuana consumption. They also established statistically significant effects: men were more likely to consume marijuana, married persons were less likely to consume marijuana, single parents with dependent child/children were more likely to consume marijuana, and the unemployed were more likely to consume marijuana.
Based on the above findings and available data, we therefore examine the following two research hypotheses:
H2. Prevalence of marijuana decreases with age.
H3. Use of marijuana is also related to other demographic factors, such as gender and marital status.
In addition, studies have been carried out analysing the relationships between the use of marijuana, tobacco, alcohol, and other drugs. The relationship between marijuana and alcohol was analysed in Chaloupka and Laixuthai (Citation1997), Pacula (Citation1998), Williams and Mahmoudi (Citation2004), Williams et al. (Citation2004), and Lucas et al. (Citation2013). DiNardo and Lemieux (Citation2001), for example, confirmed alcohol and marijuana to be substitute goods using data from the U.S. high school population for the period from 1980 to 1989. Based on nationally representative data for Australia for 1988, 1991, 1993 and 1995, Cameron and Williams (Citation2001) established that an increase in the real price of alcohol has a statistically significant impact on the likelihood of prevalence of marijuana use, also suggesting that they are substitutes.
Zhao and Harris (Citation2004) found a statistically significant connection between the price of tobacco and the use of marijuana in Australia. Namely, they established that a 10% increase in tobacco prices leads to a 1.6 percentage point reduction in the likelihood of using marijuana. Other studies about marijuana and tobacco were implemented by Chaloupka et al. (Citation1999b), Farrelly et al. (Citation2001), and Badiani et al. (Citation2015). Saffer and Chaloupka (Citation1999) found, based on pooled, nationally representative data for the United States for 1988, 1990 and 1991, that marijuana use corresponds to alcohol, heroin and cocaine use as a complementary good, evidenced by the significant negative impact of drug prices.
Using data for two age groups of adolescents, Farrelly et al. (Citation1999) found an interconnection between the use of alcohol, tobacco and marijuana in the context of intensified police supervision or increase in the penalties for possession of marijuana. A cross-price elasticity of –0.486 in the younger group indicated complementarity between the price of tobacco and the use of marijuana in the context of tightened police supervision. Cross-price elasticity for tobacco of –0.80 and for beer of –1.10 were found when taking into account the effect of higher penalties for possession of marijuana. In addition, correlation between marijuana and cocaine was researched (Chaloupka et al., Citation1999a; DeSimone and Farrelly, Citation2003), and between marijuana and both cocaine and heroin (Ramful and Zhao, Citation2009).
Others have used the topic to exploit interdependencies in the consumption of marijuana, tobacco and alcohol by introducing a simulation procedure to formally account for the inherent uncertainty in marijuana-related data and parameters (Clements et al., Citation2005; Citation2010). There are also studies that focused on the relationship between marijuana and other legal as well as illegal drugs consumption in the context of gateway theory (Morral et al., Citation2002; Pacula, Citation1998; Pudney, Citation2003; Sen et al., Citation2002; van Ours, Citation2003). Moreover, economists have tried to estimate the effects of decriminalisation, penalties, and police enforcement on marijuana consumption (Bretteville-Jensen and Williams, Citation2011; Johnston, Citation1981; Model, Citation1993; Pacula et al., Citation2003; Thies and Register, Citation1993).
Based on the above findings, we propose the following research hypothesis:
H4. Use of marijuana is related to existing consumption of marijuana, alcohol and tobacco.
3. Prevalence of marijuana
For the estimation of prevalence of marijuana, we used data from the national survey. Namely, in the years 2011 and 2012, the National Institute of Public Health (NIJZ, Citation2012) conducted its first nationally representative Survey on the use of tobacco, alcohol and other drugs in Slovenia, which also included questions about respondents’ opinions or attitudes towards drug users, and the risks associated with drug use. The survey was conducted using a mixed-mode methodology that included online survey, telephone survey follow-up and face-to-face follow up, and was conducted in two parts. The gross sample employed in 2011 comprised 7200 individuals, whereas the gross sample employed in 2012 comprised 8000 individuals, aged between 15 and 64 years and living in private households. The samples were two-stage stratified. Seven thousand five hundred and sixteen individuals answered survey questions, resulting in the overall survey response rate of 49.45%.
All respondents were asked if they ever tried marijuana, and if they did, they were further questioned whether they had used it in the past year and in the past month: 15.8% of people reported (once in) lifetime use, 4.4% reported past-year use, and 2.3% pe reported past-month use of marijuana or hashish. Reported average age, at first use of marijuana or hashish, was 18 years. When asked about marijuana legalisation, 64.4% of respondents were against it.
presents past-year marijuana participation rates by socio-economic groups. Altogether, 328 individuals (4.4%) from the sample of 7516respondents used marijuana in the past year. As can be observed, 5.9% of males and 2.8% of females used marijuana. Single individuals (9.1%) are significantly more likely to have used marijuana than married or de facto partnered (0.7%). Respondents from single-parent families had a 7.4% chance of being a past-year marijuana user, compared to a 4.15% chance of the respondents from families with both parents. In terms of the main activity, the group comprising those who were retired had a significantly lower participation rate (0.0%) than those who worked, were self-employed or were farmers (2.4%), were unemployed (6.9%), or were students (16.0%).
Table 1. Socio-economic characteristics of marijuana users in Slovenia (percentage of various socio-economic characteristics in the sample that were past-year marijuana users), n = 328.
The prevalence rates for different education levels show that those with or without completed primary school had a higher chance of using marijuana (5.7%) than those with completed secondary education (4.5%) or those with university or other higher education (3.4%). There was a connection between household income and past-year marijuana use, though the dispersion of prevalence rates was not entirely straightforward (see ).
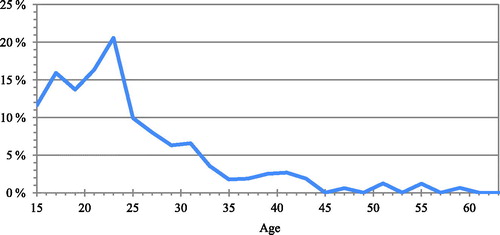
As illustrated in , young Slovenians between the ages of 16 to 24 years were most likely to use marijuana, with 23-year-olds having the highest participation rate of more than 20%. The past-year prevalence rate declines beyond the age of 25 years. These findings provide initial support for our hypothesis H1, i.e., that the prevalence of marijuana decreases with age. Additional testing will be described within the econometric model in the Section 4.
Figure 1. Percentage of past-year marijuana users in the general population by age, n = 328.
Source: NIJZ (Citation2012); own calculations.
4. Empirical analysis of the demand for marijuana
The goal of this section is to estimate two univariate discrete choice models that relate the probability of marijuana participation to individual socio-economic characteristics using the micro-unit data from the national survey. The dependent variable used in our analysis is an indicator for use of marijuana in the past year (1 = yes, 0 = no). Three thousand, five hundred and twenty-nine individuals from the sample answered the corresponding question. Included as potential determinants of drug use are the following individual-specific variables: age (between 15 and 64 years), gender (1 = male, 0 = female), type of household (1 = both parents, 0 = single parent), marital status (1 = married, 0 = not married), student status (1 = student, 0 = not a student), employment status (1 = not employed, 0 = employed), household income (in 1000 euros), cigarette smoker (1 = yes, 0 = no), recent use of alcohol (1 = yes, 0 = no), and acquaintance of someone who uses marijuana (1 = yes, 0 = no).
We first applied a logit model to evaluate the probability of a particular person being a marijuana user given his or her set of scores on the predictor variables. A ten-predictor logistic model was fitted to the data to test the research hypotheses on the relationships between the probability that an individual is a past-year marijuana user and his or her socio-economic characteristics. In addition, the corresponding odds ratios were calculated. A test of the null hypothesis that adding socio-economic predictors to the model does not increase our ability to predict the person’s decision to use marijuana was rejected, meaning that the model with such predictors is an improvement over the baseline model (χ2 = 878.0, p < 0.000). The Hosmer-Lemeshow test as the inferential goodness-of-fit test yielded a χ2 statistic of 9663 and was statistically insignificant (p > 0.05), suggesting that the null hypothesis of a good model fit to data was tenable.
As can be seen from , the 0.960 odds ratio of the person’s additional year of age means that as the person gets older the odds of him or her being a marijuana user decrease by a factor of 0.960. The odds of a male being a marijuana user were 1.720 times greater than the odds for a female. For the married or de facto partnered, the odds were 0.334 smaller than the odds of a single person. A person still in education has odds 2.13 times greater, and an unemployed person has odds 1.954 times greater, respectively, than the odds of an employed person being a marijuana user. Every additional 1000 euros of a person’s household income increases his or her odds of being a marijuana user by a factor of 1.655. The odds for cigarette smokers are 3.611 times greater than the odds for a non-smoker. The odds for recent alcohol users are 2.197 times greater than the odds for a non-drinker. The odds of a person who knows someone who is a marijuana user are as much as 54.380 times greater than the odds for the non-acquainted. All interpreted odds ratios are based on statistically significant regression coefficients (see ), and are valid on average and under the ceteris paribus assumption.
Table 2. Estimated logit model for the probability of marijuana use in the past year.
Furthermore, we also estimated a probit model to evaluate the probability of a particular person being a marijuana user given the same explanatory variables as in the logit model. We calculated the marginal effects of individual explanatory variables, as these shed important insights on the socio-economic factors of participation decision for marijuana. Marginal effects from a probit model can be considered as complementary statistics to odds ratios from a logit model. presents the probit estimates of the probability of marijuana use in the past year.
Table 3. Estimated probit model for the probability of marijuana use in the past year.
Examining the marginal effects in , we find that with each additional year of age the probability of a person being a marijuana user decreases by 0.17 percentage points. Males are 2.9 percentage points more likely to use marijuana than females. Compared to single individuals, married or de facto partnered individuals are 2.9 percentage points less likely to use marijuana. With respect to individuals’ main occupation, those who study are 4.5 percentage points more likely to use marijuana and those who are unemployed are 3.8 percentage points more likely to use marijuana, respectively, than those who work. Participation probability for marijuana increases by 2.7 percentage points if household income increases by 1000 euros. Cigarette smokers are 9.8 percentage points more likely to use marijuana than non-smokers, recent alcohol users are 4.8 percentage points more likely to use marijuana than non-users, and individuals who know someone who uses marijuana are as much as 67.1 percentage points more likely to be marijuana users than the non-acquainted. All interpreted marginal effects are based on statistically significant regression coefficients (see ), and are valid on average, at the average values of all other explanatory variables and under the ceteris paribus assumption.
The negative and statistically significant regression coefficient on age provides additional support for our hypothesis H1, i.e., that the prevalence of marijuana decreases with age. This is qualitatively in accordance with the findings of Cameron and Williams (Citation2001) and Zhao and Harris (Citation2004), whereas Ramful and Zhao (Citation2009) found a non-linear (inverse U-shaped) effect. The negative and statistically significant regression coefficient on marital status and the positive and statistically significant regression coefficients on gender, student status, employment status and household income provide support for our hypothesis H3, i.e., that the use of marijuana is related to socio-economic factors. Qualitatively similar findings were obtained by Rhodes et al. (Citation2000), Cameron and Williams (Citation2001), DiNardo and Lemieux (Citation2001), Sen et al. (Citation2002), Zhao and Harris (Citation2004), Clements and Zhao (Citation2005) and Ramful and Zhao (Citation2009).
Moreover, the positive and statistically significant regression coefficients on cigarette smoking, recent alcohol use and acquaintance of marijuana users provide support for our hypothesis H4, i.e., the use of marijuana is related to existing consumption of marijuana, alcohol and tobacco. Qualitatively similar findings were obtained by Farrelly et al. (Citation1999), Saffer and Chaloupka (Citation1999), Sen et al. (Citation2002), Williams et al. (Citation2004) and Badiani et al. (Citation2015).
5. Assessment of the marijuana market
In order to obtain a range of much needed information concerning marijuana consumption habits and prices at the individual consumer level, we implemented an online survey among Slovenian marijuana users, conducted specifically for this research. The survey was carried out between January and April 2015, through the open source surveying application 1KA (www.1ka.si), where a questionnaire was created. An online domain (www.marihuana.si) with the survey URL was registered specifically for this purpose, and advertised on various web sites and social networking services. Prior to entering the main part of the questionnaire, potential respondents were addressed with a motivation letter, including a paragraph on the protection of personal data and contact information in case of ambiguities. There were a total of 1484 clicks on the link to the poll, of which 730 were valid observations (individuals). We assumed that those 730 individuals represent the general population of past-year marijuana users, which is estimated at 61,459 individuals (NIJZ, Citation2012).
Individuals answered the online survey questions about the type of marijuana used, quantity used at each session, number of sessions per use day, number of use days in past year, quantity purchased, number of purchases, and price paid for marijuana. Using data from our online survey, we were thus able to estimate sizes of four groups of past-year marijuana users based on categorisation used by van Laar et al. (Citation2013), where the numbers in parentheses represent the number of users in the general population: 1) infrequent users (29,471), 2) regular users 20,626), 3) intensive users (6,637), and 4) problematic or heavy users (4725).
Users who reported quantity of marijuana in a joint (or pipe, bong, and vaporiser) to be more than one gram were discarded from the analysis, and those reporting quantities in a joint between 0.4 and one gram were limited to 0.4 gram. Based on the online survey results, we find that infrequent users use 0.52 grams, regular users use 0.39 grams, intensive users use 0.66 grams, and heavy users use 1.10 grams of marijuana per typical use day. On a yearly basis, this numbers translate into 2.2 grams, 12.3 grams, 114.3 grams, and 386.9 grams, respectively.
In terms of obtaining marijuana, 80.2% of all users stated that they bought at least some quantity of marijuana in the past year. The smallest share of marijuana purchased was reported among infrequent users (54.8%), followed by regular users (63.9%), intensive users (83.5%), and heavy users among which the reported share of at least some marijuana purchased was 89.2%. Because marijuana has a reputation of being a social drug (Osborne & Fogel, Citation2008), the online survey also collected answers about quantities of marijuana obtained free of charge. Sixty-nine percent of past-year users stated that they obtained at least some marijuana free of charge, of which 14.7% obtained marijuana exclusively in this way. Considering home cultivation, 28.9% of users stated they have grown at least some marijuana they consumed, whereas 6.2% of users were self-sufficient.
Past-year marijuana users who bought any of their cannabis were asked about weights and frequency of marijuana purchased. Questions regarding purchases were constructed in a way that enabled users to answer within a limited set of weights, but were not limited to one type of marijuana. The weights asked about were standard weights offered on the Slovenian marijuana market: 5 grams, 10 grams, 20 grams, 50 grams, 100 grams, 500 grams, and 1000 grams. Types of marijuana that the user reported buying in the past year were: marijuana (less potent), skunk (more potent), hashish, and cannabis oil. Users who reported using more than one type of marijuana and buying at least some of it in the past year were then asked about purchases of all types of marijuana used. Because only 26.7% of users reported using only one type of marijuana, most of those reporting use of more than one type also reported buying more than one type of marijuana in the past year.
The next step taken towards the assessment of the financial turnover was to divide buyers into shares by the reported weights of each type of marijuana bought in the past year. This was the last division made before multiplying the share of the type of marijuana bought with the share identified by the reported weight of each type of marijuana bought and with the average money value spent. The latter was calculated within each of the user groups for different weights and types of marijuana. Obtaining the average money value spent for different types and weights of marijuana within each of the user groups involved multiplying each type and weight the buyer within each group had purchased in the past year with the price that the respondent paid for that weight.
Taking into account all of the above data, we were thus able to estimate the price of one gram of good quality marijuana to be in the range between six and eight euros. Six euros per one gram of good quality marijuana, if bought in a 10 gram bag, is considered a very good price. We can also estimate, taking into account the above data, that some three tonnes of marijuana flower were used in Slovenia in 2014. No correction to adjust for underreporting of marijuana consumption was used herein, thus we believe three tonnes to be a conservative estimate.
6. Issues related to marijuana legalization
While it will probably take around five to ten years for the real repercussions in countries that have legalised marijuana to emerge, one can learn from the available reports from these countries. Ghosh et al. (Citation2015) already show for the State of Colorado that the use of high volume THC (tetrahydrocannabinol) marijuana is on the rise. Improvement of cultivation conditions and horticultural practices has led to an increase in THC levels from about 15% to more than 20% in marijuana flower, and up to 90% of THC in its concentrates. A combination of increased THC levels and availability may have important public health implications (i.e., unintentional poisoning of young children). Based on data from the State of Colorado, it is reasonable to assume that in the case of legalisation, the consumption pattern would change in favour of ever-higher THC levels. Considering the situation of a growing number of high frequency users who would gradually adapt to ever-higher volumes of THC in marijuana and itsproducts is alarming, and the practice should not to be undertaken without deep consideration when contemplating alternatives to prohibition.
Besides rising THC levels as a consequence of marijuana legalisation, the issue of advertising marijuana and its products is also of great concern. Researchers have propounded that any kind of promotion of marijuana should be prohibited (Pacula et al., Citation2014), as its promotion would result in escalating consumption, as has been proven to be the case with alcohol and tobacco (Anderson et al., Citation2009; Bryden et al., Citation2012; Henriksen et al., Citation2008; Sims et al., Citation2014; Sinha et al., Citation2014). Regulators in the United States could not ban its promotion as they did in Uruguay, because of the doctrine of ‘commercial free speech’ (Kilmer et al., Citation2013). In Slovenia any promotion of tobacco is prohibited by law, and promotion of alcoholic beverages is permitted only for those beverages containing less than 15% of alcohol. It is thus reasonable to assume that marijuana would face similar advertising restrictions in the case of its legalisation.
If illicit market equilibrium is now set by price which is made up of compensation for being arrested and incarcerated, and extra costs connected to producers’ inability to fully exploit the improvements of cultivation technologies and growing space, then the legality of marijuana and its products would certainly reduce prices. As marijuana has been proven to be price sensitive, this is yet another concern that must not be circumvented. One way of keeping the marijuana prices artificially high could possibly be achieved by supplying it through state-run monopolies, as has been proven to be the case with alcohol in some countries (Pacula et al., Citation2014), or to tax it in such a manner that prices would be maintained sufficiently high and the effect of price elasticity would not kick in.
Legalisation would also bring some tax revenue for the government. If we wanted to put forward a reliable assumption for the Slovenian policy makers on how marijuana could possibly be taxed in the same manner as alcohol, we would have to obtain some real values of THC contained in marijuana flowers from the Slovenian environment. In the year 2015, researchers from the State of Colorado, together with the high tech company Franwell and their technical solution that provides an end-to-end tracking and tracing of marijuana plants and products, made a study that provides data-driven evidence about THC contained in the marijuana flower, concentrates and infused products, specifically for Colorado's marijuana market (Orens et al., Citation2015). As similar data will probably be non-existent in Slovenia for some time to come, we devoted our efforts to estimating a possible scenario of taxation of marijuana in a similar manner as with fine-cut tobacco.
Based on the above limitations, we propose the following research hypothesis:
H5. Any reasonable taxation of marijuana would provide relatively low tax revenue for the government budget.
In Slovenia, the retail selling price of fine-cut tobacco includes value added tax at a rate of 22% and two excise duties, the specific excise duty of 40 EUR per kilogram and the proportional excise duty at 35% of the retail selling price. Both excise duties together should be at least 88 EUR per kilogram of fine-cut tobacco (Official Gazette 47/16). Retail selling price for a 30 g package of fine-cut tobacco varies between 4.1 EUR and 6.9 EUR, depending on the quality. One of the most popular brands has a retail price of 4.70 EUR per package, of which taxes represent 78.6% (i.e., excise duties and value added tax).
If we assume the same level of taxation (i.e., 78.6% of the retail price), then each gram of marijuana with a retail price of 6 EUR yields 4.72 EUR of taxes. Overall consumption of three tonnes thus represents 14.1 million EUR of taxes at an annual level – a relatively small amount equal to less than 10% of tobacco related tax revenue. This offers support for our hypothesis H5, i.e., that any reasonable taxation of marijuana would provide relatively low tax revenue for the government. From the suppliers’ point of view, the pre-tax price of marijuana, which should cover production costs and trade margins, would thus represent 1.28 EUR per gram.
On the other hand, we need to estimate the producers’ cost (price) of marijuana. For this purpose, we take into account a hypothetical growing space covering approximately 80 square metres (we assume that such area could be relatively easily established for marijuana cultivation by interested ‘small’ suppliers after marijuana legalisation in Slovenia). Using data on costs (Mills, Citation2012), economies of scale (Hawken & Prieger, Citation2013) and yield (Potter & Duncombe, Citation2012; Toonen et al., Citation2006) in order to calculate the total costs of one gram of marijuana, grown explicitly under a controlled environment, we estimate the overall annual yield to be 55 kilograms of dry, trimmed marijuana flower, with the cost price to be somewhere between 1.5 and 2 euros per gram, depending on the expected period of return on the investment. Comparing this result with the estimated pre-tax price of marijuana (1.28 EUR), brings us to a conclusion that a ‘small’ supplier with such production costs and anticipated level of taxation would hardly make any profit.
In the case of marijuana legalisation, we can thus expect that ‘small’ producers would not be motivated to produce marijuana legally. In order to make a profit, plantation-based production using economies of scale would be required. Due to economies of scale and imports, we can also expect a decline of marijuana prices, resulting in a reduction of taxes, unless its consumption should increase substantially.
7. Concluding remarks
Marijuana’s illicit status means that its whole consumption escapes the tax net and it fuels the underground economy. If marijuana were to be taxed in a way similar to fine-cut tobacco, then the revenue from its production, sale and elimination of costs from police enforcement would probably increase. As attitudes toward marijuana as a whole are relaxing and its production is a relatively easy and cheap procedure, individuals and organised groups would be able to collect the money in a relatively non-hazardous way. For a comprehensive cost-benefit analysis, accurate cost estimates are needed related to marijuana prohibition and emergency-room cases inherent in its consumption.
We have found substantial evidence for the hypotheses of our research. The use of marijuana in Slovenia is related to socio-economic and demographic factors. Marijuana is most popular among the younger population until the age of 23 years, after which its prevalence among the older population steadily declines. Our discrete choice analysis additionally demonstrates that males, those who are still in the process of education, single persons, persons from a household with higher income, the unemployed, cigarette smokers, recent alcohol users and those who know someone who is a marijuana user are the most susceptible to marijuana use.
It is difficult to anticipate what would happen if marijuana becomes legal in Slovenia, but the decision makers have to be persuaded that any move towards tax revenue collection has to be excluded when thinking of potential benefits that could be derived from its legalisation. Our rather conservative estimate is that only 14.1 million EUR of taxes could be expected (given our estimates about marijuana prices, consumption and taxation), which is less than 10% of tobacco related tax revenue. Before any hasty decision is made, a broader consensus has to be reached about the true unknown threats that lie behind the inflated legalisation euphoria. Any escalation in prevalence of marijuana use through data obtained from the national survey must be carefully noted. In the future, the national survey has to be conducted more frequently and extended to cover prices and quantities of purchases and consumption.
Last, but not least, we need to address the limitations of our research. These are mostly related to data. The empirical results are based on two different sources – the national survey and an online survey conducted specifically for this research. While the former is designed so as to represent the overall population, this is not ensured for the latter. In addition, the latter survey is not corrected for underreporting of marijuana consumption, thus the results are probably underestimates of actual consumption. Merging both surveys into a single one and applying the approach used by the NIJZ would therefore improve the quality of the analysis substantially.
Moreover, additional scenarios of marijuana taxation should be analysed, so as to obtain deeper insights into potential benefits from marijuana legalisation. In this context, there should also be conducted an analysis of the complementarity between the use of alcohol, tobacco and marijuana, since these are linked based on existing findings from the literature. In addition, in order to provide a comprehensive cost-benefit analysis, it would be necessary to analyse government expenditure for the prosecution of marijuana users and medical treatment related to marijuana use, which would enable a more accurate assessment of the marijuana market in Slovenia.
Disclosure statement
No potential conflict of interest was reported by the authors.
References
- Anderson, P., de Bruijn, A., Angus, K., Gordon, R., & Hastings, G. (2009). Impact of alcohol advertising and media exposure on adolescent alcohol use: A systematic review of longitudinal studies. Alcohol and Alcoholism, 44(3), 229–243. doi:10.1093/alcalc/agn115
- Badiani, A., Boden, J. M., De Pirro, S., Fergusson, D. M., Horwood, L. J., & Harold, G. T. (2015). Tobacco smoking and cannabis use in a longitudinal birth cohort: Evidence of reciprocal causal relationships. Drug and Alcohol Dependence, 150, 69–76. doi:10.1016/j.drugalcdep.2015.02.015
- Becker, G. S., & Murphy, K. M. (1988). A theory of rational addiction. Journal of Political Economy, 96(4), 675–700. doi:10.1086/261558
- Becker, G. S., Murphy, K. M., & Grossman, M. (2006). The market for illegal goods: The case of drugs. Journal of Political Economy, 114(1), 38–60. doi:10.1086/498918
- Bretteville-Jensen, A. L., & Williams, J. (2011). Decriminalization and initiation into cannabis use. Research paper no. 1130. Melbourne: University of Melbourne, Department of Economics.
- Bryden, A., Roberts, B., McKee, M., & Petticrew, M. (2012). A systematic review of the influence on alcohol use of community level availability and marketing of alcohol. Health & Place, 18(2), 349–357. doi:10.1016/j.healthplace.2011.11.003
- Cameron, L., & Williams, J. (2001). Cannabis, alcohol and cigarettes: Substitutes or complements? Economic Record, 77(236), 19–34. doi:10.1111/1475-4932.00002
- Caulkins, J. P., & Pacula, R. L. (2006). Marijuana markets: Inferences from reports by the household population. Journal of Drug Issues, 36(1), 173–200. doi:10.1177/002204260603600108
- Chaloupka, F. J., & Laixuthai, A. (1997). Do youths substitute alcohol and marijuana? Some econometric evidence. Eastern Economic Journal, 23(3), 253–276.
- Chaloupka, F. J., Grossman, M., & Tauras, J. A. (1999a). The demand for cocaine and marijuana by youth. In: The economic analysis of substance use and abuse: An integration of econometrics and behavioral economic research (pp. 133–156). Chicago: University of Chicago Press.
- Chaloupka, F. J., Pacula, R. L., Farrelly, M. C., Johnston, L. D., & O’Malley, P. M. (1999b). Do higher cigarette prices encourage youth to use marijuana? Working paper no. 6939. Cambridge, MA: National Bureau of Economic Research.
- Clements, K. W., & Zhao, X. (2005). Economic aspects of marijuana. Economics discussion paper no. 05-28. Perth: University of Western Australia, Department of Economics.
- Clements, K. W., Lan, Y., & Zhao, X. (2005). The demand for vice: Inter-commodity interactions with uncertainty. Economics discussion paper no. 05-30. Perth: University of Western Australia, Department of Economics.
- Clements, K. W., Lan, Y., & Zhao, X. (2010). The demand for marijuana, tobacco and alcohol: Inter-commodity interactions with uncertainty. Empirical Economics, 39(1), 203–239. doi:10.1007/s00181-009-0302-x
- DeSimone, J., & Farrelly, M. C. (2003). Price and enforcement effects on cocaine and marijuana demand. Economic Inquiry, 41(1), 98–115. doi:10.1093/ei/41.1.98
- DiNardo, J., & Lemieux, T. (2001). Alcohol, marijuana, and American youth: The unintended consequences of government regulation. Journal of Health Economics, 20(6), 991–1010. doi:10.1016/S0167-6296(01)00102-3
- European Monitoring Centre for Drugs and Drug Addiction (EMCDDA). (2015). European drug report 2015. Lisbon: European Monitoring Centre for Drugs and Drug Addiction.
- Farrelly, M. C., Bray, J. W., Zarkin, G. A., Wendling, B. W., & Pacula, R. L. (1999). The effects of prices and policies on the demand for marijuana: Evidence from the National household surveys on drug abuse. Working paper no. 6940. Cambridge, MA: National Bureau of Economic Research.
- Farrelly, M. C., Bray, J. W., Zarkin, G. A., & Wendling, B. W. (2001). The joint demand for cigarettes and marijuana: Evidence from the national household surveys on drug abuse. Journal of Health Economics, 20(1), 51–68. doi:10.1016/S0167-6296(00)00067-9
- Ghosh, T. S., Van Dyke, M., Maffey, A., Whitley, E., Erpelding, D., & Wolk, L. (2015). Medical marijuana’s public health lessons: Implications for retail marijuana in Colorado. New England Journal of Medicine, 372(11), 991–993. doi:10.1056/NEJMp1500043
- Harrison, L. D., Martin, S. S., Enev, T., & Harrington, D. (2007). Comparing drug testing and self-report of drug use among youths and young adults in the general population. Rockville, MD: Department of Health and Human Services, Substance Abuse and Mental Health Services Administration, Office of Applied Studies.
- Hawken, A., & Prieger, J. (2013). Economies of scale in the production of cannabis. Los Angeles, CA: BOTEC Analysis Corporation.
- Henriksen, L., Feighery, E. C., Schleicher, N. C., & Fortmann, S. P. (2008). Receptivity to alcohol marketing predicts initiation of alcohol use. Journal of Adolescent Health, 42(1), 28–35. doi:10.1016/j.jadohealth.2007.07.005
- Johnson, T., & Fendrich, M. (2005). Modeling sources of self-report bias in a survey of drug use epidemiology. Annals of Epidemiology, 15(5), 381–389.
- Johnston, L. D. (1981). Marijuana decriminalization: The impact on youth 1975–80. Monitoring the Future Occasional paper no. 13. Ann Arbor, MI: University of Michigan, Institute for Social Research.
- Kilmer, B., Caulkins, J. P., Midgette, G., Dahlkemper, L., MacCoun, J. R., & Pacula, R. L. (2013). Before the grand opening: Measuring Washington state’s marijuana market in the last year before legalized commercial sales. Santa Monica, CA: RAND Corporation.
- Lucas, P., Reiman, A., Earleywine, M., McGowan, S. K., Oleson, M., Coward, M. P., & Thomas, B. (2013). Cannabis as a substitute for alcohol and other drugs: A dispensary-based survey of substitution effect in Canadian medical cannabis patients. Addiction Research & Theory, 21(5), 435–442. doi:10.3109/16066359.2012.733465
- Mills, E. (2012). The carbon footprint of indoor cannabis production. Energy Policy, 46, 58–67. doi:10.1016/j.enpol.2012.03.023
- Miron, J. A., & Egan, D. (2005). The budgetary implications of marijuana prohibition. In: M. Earleywine (ed.), Pot politics: Marijuana and the costs of prohibition (pp. 17–34). Oxford: Oxford University Press.
- Model, K. E. (1993). The effect of marijuana decriminalization on hospital emergency room drug episodes: 1975–1978. Journal of the American Statistical Association, 88(423), 737–747. doi:10.1080/01621459.1993.10476334
- Morral, A. R., McCaffrey, D. F., & Paddock, S. M. (2002). Reassessing the marijuana gateway effect. Addiction, 97(12), 1493–1504. doi:10.1046/j.1360-0443.2002.00280.x
- National Institute of Public Health (NIJZ). (2012). Survey on the use of tobacco, alcohol and other drugs in Slovenia, 2011–2012. Ljubljana: National Institute of Public Health.
- Nisbet, C. T., & Vakil, F. (1972). Some estimates of price and expenditure elasticities of demand for marijuana among U.C.L.A. students. Review of Economics & Statistics, 54(4), 473–475. doi:10.2307/1924578
- Orens, A., Light, M., Rowberry, J., Matsen, J., & Lewandowski, B. (2015). Marijuana equivalency in portion and dosage. Colorado: Colorado Department of Revenue.
- Osborne, G. B., & Fogel, C. (2008). Understanding the motivations for recreational marijuana use among adult Canadians. Substance Use Misuse, 43(3-4), 539–572.
- Pacula, R. L. (1998). Adolescent alcohol and marijuana consumption: Is there really a gateway effect? Working paper no. 6348. Cambridge, MA: National Bureau of Economic Research.
- Pacula, R. L., Chriqui, J. F., & King, J. (2003). Decriminalization in the United States: What does it mean? Working paper no. 9690. Cambridge, MA: National Bureau of Economic Research.
- Pacula, R. L., Grossman, M., Chaloupka, F. J., O’Malley, P. M., Johnston, L., & Farrelly, M. C. (2001). Marijuana and youth. Working paper no. 7703. Cambridge, MA: National Bureau of Economic Research.
- Pacula, R. L., Kilmer, B., Wagenaar, A. C., Chaloupka, F. J., & Caulkins, J. P. (2014). Developing public health regulations for marijuana: Lessons from alcohol and tobacco. American Journal of Public Health, 104(6), 1021–1028. doi:10.2105/AJPH.2013.301766
- Potter, D. J., & Duncombe, P. (2012). The effect of electrical lighting power and irradiance on indoor-grown cannabis potency and yield. Journal of Forensic Sciences, 57(3), 618–622. doi:10.1111/j.1556-4029.2011.02024.x
- Pudney, S. (2003). The road to ruin? Sequences of initiation to drugs and crime in Britain. The Economic Journal, 113(486), C182–C198. doi:10.1111/1468-0297.00107
- Ramful, P., & Zhao, X. (2009). Participation in marijuana, cocaine and heroin consumption in Australia: A multivariate probit approach. Applied Economics, 41(4), 481–496. doi:10.1080/00036840701522853
- Rhodes, W., Johnston, P., Han, S., McMullen, Q., & Hozik, L. (2000). Illicit drugs: Price elasticity of demand and supply. Cambridge: ABT Associates.
- Room, R. (2014). Legalizing a market for cannabis for pleasure: Colorado, Washington, Uruguay and beyond. Addiction, 109(3), 345–351. doi:10.1111/add.12355
- Sen, B., Agarwal, R., & Hofler, R. (2002). Teenage indulgence in cigarettes, alcohol and marijuana: Evidence of a “gateway” effect. College of Business working paper no. 02-0103. Urbana, IL: University of Illinois at Urbana-Champaign.
- Sims, M., Salway, R., Langley, T., Lewis, S., McNeill, A., Szatkowski, L., & Gilmore, A. B. (2014). Effectiveness of tobacco control television advertising in changing tobacco use in England: A population-based cross-sectional study. Addiction, 109(6), 986–994. doi:10.1111/add.12501
- Sinha, D. N., Palipudi, K. M., Oswal, K., Gupta, P. C., Andes, L. J., & Asma, S. (2014). Influence of tobacco industry advertisements and promotions on tobacco use in India: Findings from the Global Adult Tobacco Survey. Indian Journal of Cancer, 51(1), 2009–2010. S13–S18.
- Slovenska policija. (2009–2015). Poročilo o delu policije za leto 2008–2014. Ljubljana: Ministrstvo Republike Slovenije za notranje zadeve.
- Stergar, E. (2011). ESPAD. In: Drev, A., Štokelj, R., Krek, M. (eds), Nacionalno poročilo 2012 o stanju na področju prepovedanih drog v Republiki Sloveniji. Ljubljana: National Institute of Public Health.
- Saffer, H., & Chaloupka, F. (1999). The demand for illicit drugs. Economic Inquiry, 37(3), 401–411. doi:10.1111/j.1465-7295.1999.tb01439.x
- Thies, C. F., & Register, C. A. (1993). Decriminalization of marijuana and the demand for alcohol, marijuana and cocaine. Social Science Journal, 30(4), 385–399.
- Toonen, M., Ribot, S., & Thissen, J. (2006). Yield of illicit indoor cannabis cultivation in the Netherlands. Journal of Forensic Sciences, 51(5), 1050–1054. doi:10.1111/j.1556-4029.2006.00228.x
- Toor, A. (2014). New highs: Marijuana now legal in Alaska, Oregon, and Washington, DC. The Verge, retrieved from http://www.theverge.com/2014/11/5/7157993/marijuana-legalization-vote-oregon-washington-dc-alaska-florida.
- United Nations Office on Drugs and Crime (UNODC). (2015). World drug report 2015. Vienna: United Nations Publications.
- Van Ours, J. C. (2003). Is cannabis a stepping-stone for cocaine? Journal of Health Economics, 22(4), 539–554.
- Van Ours, J. C., & Williams, J. (2007). Cannabis prices and dynamics of cannabis use. Journal of Health Economics, 26(3), 578–596.
- Van Laar, M., Frijns, T., Trautmann, F., & Lombi, L. (2013). Cannabis market: User types, availability and consumption estimates. Luxembourg: Publications Office of the European Union.
- Williams, J., & Mahmoudi, P. (2004). Economic relationship between alcohol and cannabis revisited. Economic Record, 80(248), 36–48. doi:10.1111/j.1475-4932.2004.00123.x
- Williams, J., Pacula, L. R., Chaloupka, F. J., & Wechsler, H. (2004). Alcohol and marijuana use among college students: Economic complements or substitutes? Health Economics, 13(9), 825–843.
- Wilkins, C., & Sweetsur, P. (2007). Individual dollar expenditure and earnings from cannabis in the New Zealand population. International Journal of Drug Policy, 18(3), 187–193. doi:10.1016/j.drugpo.2006.11.002
- Zakon o trošarinah [Excise Duty Act] (2016). Official Gazette of the Republic of Slovenia, 47/16.
- Zhao, X., & Harris, M. N. (2004). Demand for marijuana, alcohol and tobacco: Participation, levels of consumption and cross-equation correlations. Economic Record, 80(251), 394–410. doi:10.1111/j.1475-4932.2004.00197.x