 ?Mathematical formulae have been encoded as MathML and are displayed in this HTML version using MathJax in order to improve their display. Uncheck the box to turn MathJax off. This feature requires Javascript. Click on a formula to zoom.
ABSTRACT
One of the bottlenecks in the development of UAV-based crop growth estimation models has been the need for ground-truth data collection through plant sampling. Thus, we investigated the viability of utilizing datasets derived from reduced sampling size for the development of growth estimation models, with the aim of enhancing the efficiency of ground-truth data collection. Koshihikari, a Japonica rice variety, was grown with various fertilizer conditions and transplanting dates. Once a week from transplanting to the heading date, aerial RGB and multispectral images were collected with a UAV. Subsequently, four adjacent hills from each plot were harvested, and above-ground biomass (AGB) and leaf area index (LAI) measurements were taken for each hill. For each hill, the ground-measured data was linked to the UAV-derived features (plant height, vegetation indices, and texture indices). Three datasets were compiled using the values of single hill, the average values of two adjacent hills, and those of four adjacent hills. Models estimating AGB and LAI from UAV-derived features were developed with each dataset using single regression and machine learning (ML) algorithms, and the prediction accuracy was compared among the three datasets. The prediction accuracy of the single regression models was similar across all datasets. In addition, it was demonstrated that the dataset based on single-harvested hills can contribute to improving the prediction accuracy of the ML models. Our results indicated that the dataset based on single-harvested hills was sufficiently reliable for model development and can be utilized, consequently allowing for more efficient ground-truth data collection.
GRAPHICAL ABSTRACT
1. Introduction
Above-ground biomass (AGB) and leaf area index (LAI) are vital growth parameters in rice cultivation. Specifically, AGB can be utilized to predict grain yield and assess plant health and nitrogen content (Adamchuk et al., Citation2010; Ma et al., Citation2022). LAI is a significant indicator of photosynthetic capacity and has been applied in yield estimation (Liu et al., Citation2005; Xiao et al., Citation2011). Timely and accurate evaluation of these two parameters is essential for agricultural trade, policy decisions, breeding experiments, and optimizing agricultural operations. However, manual measurement of these parameters involves time-consuming and labor-intensive field sampling.
Remote sensing techniques have been utilized to obtain data in vast areas at once and applied to agricultural research to improve the efficiency of growth assessment. UAVs have received a lot of attention recently, especially for their ability to collect higher resolution images efficiently anytime, anywhere over a large area (Tsouros et al., Citation2019). Vegetation indices (VIs) are one of the most popular features calculated from spectral information, which can be acquired from UAV aerial photographs. A variety of VIs that can describe growth parameters in various data collection environments have been developed and widely applied to growth monitoring over the past 50 years (Silleos et al., Citation2006). The use of image analysis to calculate textures has also been applied in the estimation of plant growth, as textures contain valuable structural information regarding the surface properties of the object (Lu & Batistella, Citation2005; Wulder et al., Citation1998). Also, UAV photogrammetry facilitated getting 3D information such as plant height and it has shown its potential for AGB and LAI estimation (Peprah et al., Citation2021). By utilizing these UAV-derived features, a regression-based model for growth estimation can be developed. Models based on single regression have been widely applied due to their ability to create models with a reasonable level of accuracy even with a limited number of data points (Bendig et al., Citation2015). Meanwhile, recent advancements in machine learning (ML) have enabled the conduct of more sophisticated regression analysis and have facilitated the use of more complex combinations of explanatory variables for growth estimation to achieve greater accuracy. For example, Li et al. (Citation2019) revealed that combining VIs and textures with ML (support vector regression (SVR) and random forest (RF)) can improve the estimation accuracy of rice LAI; Han et al. (Citation2019) suggested that fusion of the plant height and VIs using ML (multiple linear regression (LR), SVR, artificial neural network, and RF) is a promising way to estimate AGB of maize.
When developing such growth estimation models, it is critical to collect an ample quantity of data to ensure the accuracy of the models. Nevertheless, much time and effort are required to do the collection of actual measurements that is essential to prepare the datasets for model development, and it remained a significant bottleneck. When we quantify the plant growth of a specific plot in a field experiment within the realm of crop science research, multiple hills are harvested within the plot and their average value is employed to obtain a representative value for the plot to account for growth variation occurring among hills within the plot (Dobermann et al., Citation1995). In line with this, studies on growth estimation using UAV aerial imagery have conventionally collected ground measurements in a similar manner, for example, Yue et al. (Citation2023) collected AGB data based on the mean value of 20 randomly selected hills; Xu et al. (Citation2022) obtained AGB data by harvesting four adjacent hills for each data point; Bascon et al. (Citation2022) conducted AGB and LAI measurements by surveying four contiguous hills collectively; Yamaguchi et al. (Citation2020) sampled eight neighboring hills to measure LAI and their average value was used to prepare datasets. However, when we focus on developing a growth estimation model using UAV photogrammetry, we can consider using data based on fewer harvested hills to save labor in ground measurement. In the event that it can be demonstrated that datasets based on fewer harvested hills are feasible, it could alleviate the amount of work required to obtain an equivalent quantity of data. In order to accomplish this, it is necessary to consider the noise present in image-derived features, which is caused by the occlusion of other hills adjacent to the area occupied by the target hill, as well as the noise caused by the misalignment of the region of interest due to the displacement of planting positions. In particular, it is imperative to investigate the degree to which this kind of noise affects model development and prediction accuracy, as this effect could be exacerbated when using datasets based on fewer harvested hills. Nonetheless, this has yet to be clarified.
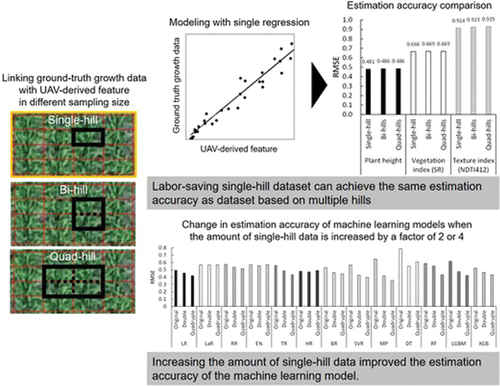
Given the above, in the present study, we aimed to investigate whether datasets based on fewer harvested hills can be used to develop a growth estimation model using UAV aerial photogrammetry (). Specifically, three datasets were prepared based on three different numbers of harvested hills: single-hill (15 × 30 cm) dataset in which the value of extracted UAV-derived features of one hill and corresponding ground-measured AGB or LAI of one hill were linked; bi-hills (30 × 30 cm) dataset in which the average values of two adjacent hills of them were linked; quad-hills (60 × 60 cm) dataset in which the average values of four adjacent hills of them were linked. Then, models for estimating AGB and LAI from UAV-derived features were developed by single regression analysis and ML algorithms with the three datasets, respectively, to demonstrate the practicability of datasets based on fewer harvested hills that can be collected in a labor-saving manner. In addition, we investigated whether adding even a more labor-saving single-hill dataset in training data could improve the estimation accuracy of ML models.
Figure 1. Data collection and analysis overview.

2. Materials and methods
2.1. Experimental design
Collection of plant material, must comply with relevant institutional, national, and international guidelines and legislation. The field experiment was conducted at a paddy field in the Field Museum Honmachi, Tokyo University of Agriculture and Technology, Honmachi, Fuchu-shi, Tokyo (35.41 N and 139.29 E) in 2020. A Japonica rice variety, Koshihikari, was grown with a planting density of 22.2 hills/m2 (15 × 30 cm) with three plants per hill. The experimental plots with two nitrogen fertilization levels including the non-fertilized area (0N) and the fertilized area (+N: 2 g/m2 was applied as a basal and 2 g/m2 was applied as top dressing) and three transplanting dates (May 20th, June 3rd, and June 17th) were set up using the split-plot design with three replications, where the transplanting time was used as the primary effect with no repetitions for the primary effect (Supplementary Figure S1).
2.2. Data collection
Data collection was conducted once a week from the transplanting date to the heading date. A drone (Inspire 2, DJI, China) equipped with a five-band (blue: 475 nm, green: 560 nm, red: 668 nm, rededge: 717 nm, and near-infrared: 840 nm) multispectral camera (Rededge-MX, Micasense, U.S.) and an RGB camera (Zenmuse X4S, DJI, China) flew over the experimental field in which four datum points were set to collect aerial image data. Camera angle, flight height, and overlap rate were set to 90° (horizontal to the ground), 30 m, and 80% respectively. The ground resolution of the multispectral camera and RGB camera was around 22 mm and 9 mm, respectively. Before the image collection with the multispectral camera, the image of the calibration board whose reflectance is known was taken. Just after the image collection, harvesting was conducted by individually sampling four adjacent hills (60 × 60 cm) from each plot. As a result of weekly sampling from transplanting date to heading date in 18 plots (three transplanting dates × two nitrogen treatments × three replications), a total of 576 hills were sampled (). The harvested samples were cut into leaves and stems and the leaf area was measured with a leaf area meter (AAM-9A, Hayashi-Denko, Japan). LAI was calculated by dividing the leaf area of each hill by its respective occupied area. Afterward, the samples were put into an oven and dried at 80°C for 72 hours, and the dry matter weight of each organ was then measured. AGB was calculated by adding the dry matter weights of each organ and dividing by the occupied area of each hill.
Table 1. Basic statistics of the collected data for each transplanting date and nitrogen treatment.
2.3. Image data processing
The coordinates of the datum points located at the four corners of the experimental field were determined by closed traverse surveying in reference to the Japan Geodetic System 2011 Plane Cartesian Coordinate System 9 as the cartographic projection method, and these four datum points were designated as ground control points (GCPs). Multispectral and RGB images were processed using Structure from Motion (SfM) software (Agisoft Metashape Professional 1.8.0, Agisoft, Russia). Specifically, the workflow contained the following processes: Alignment of the aerial photos, georeferencing with GCPs, camera calibration, reflectance calibration with the calibration board, dense cloud building, mesh building, orthoimage generation, and digital surface model (DSM) development. The canopy surface model (CSM) containing the plant height data for each measurement date was calculated by the difference between the DSM of the measurement date and the DSM of the period without any plants.
2.4. UAV-derived feature calculation
Seven types of texture orthoimages (energy, entropy, correlation, homogeneity, contrast, mean, and variance) were created from green, rededge, and near-infrared orthoimages using Orfeo Toolbox 8.0.0 (CNES, France) in QGIS 3.22.5 (GNU, General Public License), resulting in 21 texture orthoimages were obtained. The window size was 3 × 3 pixels and the histogram number of bins was set to 16. Polygons of 15 × 30 cm containing each hill were created, and the average values of each reflectance in five bands from the multispectral orthoimages, the average values of plant height from CSM, and the average values of each of the seven textures from texture orthoimages of each hill were obtained for the area covered by each polygon using a GIS software (ArcMap 10.8.1, ESRI, U.S.). Fourteen vegetation indices (SR, NDVI, MSR, GRVI, GLA, VEG, SAVI, OSAVI, CARI, ARVI, VARI, EVI, TVI, MTVI2) were calculated from the extracted reflectance data (). A total of 441 Normalized difference texture indices (NDTIs), were calculated with all the combinations of 21 textures as follows:
Table 2. Details of vis used in this research.
where T1 and T2 represent two different random texture values. Single regression analysis was performed with the quad-hills dataset detailed in the following section, and the eight NDTIs that regressed AGB and LAI with the highest accuracy were used in each subsequent analysis ().
Table 3. T1 and T2 in eight NDTIs used for development.
2.5. Model development
Three patterns of datasets were prepared to survey the effect of the number of harvested hills on the estimation model: single-hill (15 × 30 cm) dataset (n = 576) in which the value of extracted UAV-derived features of one hill was linked to corresponding ground-measured AGB or LAI of one hill; bi-hills (30 × 30 cm) dataset (n = 288) in which the average value of extracted UAV-derived features of two adjacent hills was linked to the average value of corresponding ground-measured AGB or LAI of two adjacent hills; quad-hills (60 × 60 cm) dataset (n = 144) in which the average value of extracted UAV-derived features of four adjacent hills were linked to the average value of corresponding ground-measured AGB or LAI of four adjacent hills. For the single-hill dataset and the bi-hills dataset, one data point was randomly selected from each plot for each sampling date to align the number of data points included in these datasets to 144.
Using each of the three datasets, single regression models using the least-squares method with one of plant height, VIs, and NDTIs used as an explanatory variable were developed. Also, regression models were developed using 13 ML algorithms (LR, Lasso regression (LaR), Ridge regression (RR), Elastic Net (EN), Theil-sen regression (TR), Huber regression (HR), bayesian ridge regression (BRR), SVR, multilayer perceptron (MP), decision tree (DT), RF, LightGBM (LGBM), and XGBoost (XGB)) with all the UAV-derived features employed as candidates for explanatory variables. LaR, RR, EN, HR, BRR, and SVR are designed to prevent overfitting by using mechanisms involving the use of regularization terms. TR is robust simple linear regression using median of slopes between variable pairs instead of least square to handle outliers well. These algorithms, so-called robust regressions, can perform fitting on bulk of data well while minimizing the effects of outliers such as extreme values or noisy data. MP is a type of feed-forward artificial neural network that is capable of complex nonlinear fitting, but has the disadvantage of being prone to overfitting. DT is algorithm based on a branching structure that repeatedly divides cases by feature thresholds to eventually arrive at predictions, and have the disadvantage of being prone to overfitting. RF, LGBM, and XGB are algorithms that combine multiple DTs using a technique called ensemble to achieve high fitting ability while mitigating overfitting. Thus, algorithms with diverse fitting capabilities and robustness were tested. Since redundant explanatory variables may reduce the accuracy of ML, feature selection based on feature importance was performed using RF, Adaboost, and LR as a preprocessing step. Additionally, the preprocessing involved removing one of the two explanatory variable combinations if their correlation coefficients exceeded 0.95. Hyperparameters were optimized with 10-fold cross-validation so as to minimize root mean squared error (RMSE) in training data. Grid search was conducted for LR, LaR, RR, EN, TR, HR, BR, and SVR and bayesian optimization of 100 iterations was conducted for MP, DT, RF, LGBM, and XGB for optimization of the hyperparameters, respectively. The ML analysis was performed using PyCaret (version = 2.3.6) (https://pycaret.org/about), an open-source library for Python programming language.
The prediction accuracy of the developed estimation models was verified in 3-fold cross-validation where two of the three replications were used as training data (n = 96) and one was used as test data (n = 48). To test whether data collection can be made more labor-saving in a single regression model, we also examined the accuracy when the amount of training data was reduced from 96 to 32 and 16. Of the total of three transplanting periods, only the data with June 3 as the transplanting date was used to obtain 32 data points. In addition, of the two fertilization treatments in the 32 data points, 16 data points were obtained by using only the data from the +N. In the ML model, we investigated the change in accuracy when the number of training data points in the single-hill dataset was doubled (n = 192) or quadrupled (n = 384) in order to see if the improvement in accuracy could be achieved even in the single-hill dataset, which can be collected more labor-efficiently. n = 384 was derived from all data, and n = 192 was derived from the random selection of two data points from each plot on each sampling date. To compare prediction accuracy under the same conditions, we used the quad-hills dataset that was considered to be containing the least noise as the test data. The coefficient of determination (R2) and RMSE were used as indicators for accuracy evaluation. In addition, for accuracy comparisons in ML models, Friedman tests (Demšar, Citation2006) were used to test whether there were significant differences among datasets based on different numbers of hills or among different numbers of training data points in a single hill dataset, and Nemenyi post hoc tests (Nemenyi, Citation1963) were performed on all combinations.
3. Results and discussion
3.1. Comparison of the effect of the number of harvested hills
3.1.1. Single regression analysis
We compared the prediction accuracy of AGB and LAI estimation models developed by single regression using three datasets with different numbers of harvested hills. Results indicated that prediction accuracy did not demonstrate a significant difference in relation to the number of harvested hills, across all objective and explanatory variables (). In contrast, the regression accuracy in training was inferior in the datasets with fewer harvested hills (Table S1). These findings suggest that while datasets with fewer harvested hills can introduce noise that diminishes the regression accuracy in training, the developed models do not exhibit a substantial variation and there is a minimal difference in prediction accuracy.
Figure 2. Prediction accuracy of single regression models developed with datasets based on different numbers of harvested hills with each kind of UAV-derived feature.

However, taking into account the aforementioned, it is possible that a reduction in the number of data points within the training data increases the model’s susceptibility to noise caused by occlusion from neighboring hills and misalignment of polygons due to displacement of planting positions, resulting in a diminishment of prediction accuracy. Consequently, we examined the effects of reducing the quantity of training data from 96 to 32 or 16. The results revealed that even with a decrease in the number of training data, there was no substantial deviation in prediction accuracy among the various numbers of harvested hills (). It should be noted that the inclination for regression accuracy in training to be lower in the datasets with fewer harvested hills were found to be more pronounced when the quantity of training data was reduced (Table S1). Nevertheless, the prediction accuracy remained unchanged. The distribution of data and the maximum and minimum values of the data in the datasets used did not change greatly when the number of data points was reduced (Supplementary Figure S2), and it was thought that if the range and the distribution of data covered the data to be estimated, the accuracy would not drop much even if the number of data points was reduced. Collectively, these results suggest that although a decrease in the number of training data may make the model with fewer harvested hills more susceptible to noise from neighboring hills, this effect is not considerable enough to impact prediction accuracy when enough range of ground-measured values are secured.
Table 4. Prediction accuracy of single regression models for AGB and LAI developed with datasets based on different numbers of harvested hills with each kind of UAV-derived feature with different numbers of training data.
3.1.3. Machine learning algorithms
ML algorithms have demonstrated their ability to augment the estimation accuracy of plant growth by fusing various features such as plant height, VIs, and NDTIs. Therefore, in the present study, the prediction accuracy of growth estimation models, developed with three datasets of varying numbers of harvested hills through thirteen ML algorithms, was evaluated. The prediction accuracy tended to be lower in the datasets based on fewer harvested hills in models developed using ML algorithms that exhibit high fitting capability such as MP, LGBM, and XGB (). Overall, for both AGB and LAI, significant differences in accuracy were observed among datasets based on different numbers of hills in the Friedman test, and significant differences in accuracy were observed between the single-hill and quad-hill datasets in the Nemenyi post hoc test. The current results align with the findings of the single regression analysis, in which fewer harvested hills lead to higher levels of noise in the dataset. There was little difference in the distribution of data among the datasets based on different numbers of harvested hills (Supplementary Figure S2). In the data set based on fewer harvested hills, the residuals between ground-measured values and estimated values tended to increase as the plants grew larger (, Supplementary Figure S3). These facts suggest that the dataset based on fewer harvested hills may have more noise from occlusion from neighboring hills and misalignment of polygons due to displacement of planting positions in the late growth stage when plants are larger. In some cases, prediction accuracy tended to be consistent among the datasets based on different numbers of harvested hills for models developed by robust regression algorithms that were less sensitive to outliers, such as LaR, HR, EN, and SVR in AGB estimation, and LaR and HR in LAI estimation (). This also supported the aforementioned fact that datasets based on fewer hills contain more noise. At the same time, it was also indicated that robust regression algorithms can effectively counteract the negative effects of noise on predictions enabling the utilization of datasets based on fewer harvested hills.
Figure 3. Prediction accuracy of ML models with datasets based on different numbers of harvested hills.

Figure 4. Comparison of prediction accuracy of MP between datasets based on different numbers of hills and between different numbers of training data in single-hill datasets.

To improve the ML models, it is very important to accumulate data as much as possible to input them. Therefore, this study further investigated the potential of the accumulation of the single-hill dataset for ML model improvement. shows the prediction accuracy when the number of training data was doubled (n = 192) or quadrupled (n = 384) from original (n = 96) for ML model development using the single-hill dataset. As a result, the prediction accuracy was improved in most ML algorithms by increasing the training data (). Especially, MP, LGBM, and XGB, which have high fitting capability showed significant improvement (). For both AGB and LAI, significant differences in accuracy were observed among different numbers of training data in the Friedman test. Also, The Nemenyi post-hoc test revealed significant differences in model accuracy between n = 96 and n = 384 in R2 rank, and between n = 96 and n = 192, and n = 96 and n = 384 in RMSE rank for both AGB and LAI. These results indicated that labor-saving single-hill datasets can significantly contribute to enhancing the accuracy of ML models.
Figure 5. Comparison of prediction accuracy of ML models with increasing number of training data on a single hill dataset.

3.2. Potentials and limitations of labor-saving single-hill dataset
shows the basic statistics of collected data for each transplanting date and all. The mean, standard deviation, minimum, and maximum value for the AGB were 2.42, 1.77, 0.03, and 7.63, respectively, and those for LAI were 2.23, 1.77, 0.03, and 8.25, respectively, indicating that the data are enough variable to cover the growth variation of rice in irrigated condition (Yoshida et al., Citation2007). Additionally, various fertilizer conditions and transplanting dates were set in this experiment, so the present research output has great potential for practical use. However, this study was a single-variety trial conducted at a single site in a single year. Therefore, it should be noted that the degree of noise may vary depending on the morphology in different environments and varieties.
Features such as vegetation index and plant height have shown strong relationships with crop growth parameters (Haboudane et al., Citation2004; Tilly et al., Citation2014). Utilizing single regression analysis has proven to be an efficacious method for developing relatively robust models, particularly when the quantity of data points is limited (Bendig et al., Citation2015). However, in practice, the relationship between features and growth parameters tends to fluctuate in accordance with variables such as the environment, plant morphology, and growth period (Peprah et al., Citation2021; Tang et al., Citation2005). Consequently, in order to accurately estimate growth in a particular condition, it is necessary to develop a model that is tailored to that particular condition, which in turn necessitates the collection of ground-truth data in each individual case. The findings of this study suggest that utilizing single-hill datasets can be used to develop a single regression model and that the quantity of data points can be reduced as long as there is sufficient variation in the data for the hills to be estimated (, ), thus contributing to streamlining this consequent process. On the other hand, ML algorithms are adept at developing models utilizing a substantial quantity of data to attain a high degree of accuracy. In recent times, the significance of data quality has become a topic of discussion to improve models (Budach et al., Citation2022; Chen et al., Citation2021). This study has established that even single-hill datasets can significantly contribute to enhancing the accuracy of ML models (), provided the data is of sufficient reliability. This is likely to expedite the collection of data for future high-accuracy ML models. The models developed in this study were validated on quad-hill datasets. In other words, it was indicated that even a models built on single-hill datasets can be used for estimation at the canopy level. Thus, the results of this study can be practically used to areal growth estimation at the field level in farmers’ fields and for growth estimation in screening trials of many lines. In conclusion, previous studies have typically employed multi-hill harvesting to acquire a single point of data when constructing the datasets required for the development of UAV-based growth estimation models (Li et al., Citation2019; Xu et al., Citation2022; Yamaguchi et al., Citation2020; Zheng et al., Citation2019). This study has demonstrated the potential of utilizing single-hill datasets, which is an important finding for the labor-saving collection of ground-truth data in model development.
Author contributions
All authors contributed to the study. K.K. supervised the project. T.Y. and K.K. designed the experiments. T.Y., K.S., and K.K. conducted the experiments. K.S. organized the collected data. T.Y. analyzed the data, visualized the results, and wrote the main manuscript. All authors reviewed and approved the manuscript.
Supplemental Material
Download Zip (1.2 MB)Acknowledgments
We would like to thank Mr. Koji Matsukawa, a technical staff member of the Field Museum Honmachi of Tokyo University of Agriculture and Technology, for his help with experiments in the paddy field.
Disclosure statement
No potential conflict of interest was reported by the author(s).
Data availability statement
The datasets used and analyzed during the current study are available from the corresponding author on reasonable request.
Supplementary material
Supplemental data for this article can be accessed online at https://doi.org/10.1080/1343943X.2023.2299641.
Additional information
Funding
References
- Adamchuk, V. I., Ferguson, R. B., & Hergert, G. W. (2010). Soil heterogeneity and crop growth. In Precision crop protection—the challenge and use of heterogeneity (pp. 3–16). Springer Netherlands. https://doi.org/10.1007/978-90-481-9277-9_1
- Bascon, M. V., Nakata, T., Shibata, S., Takata, I., Kobayashi, N., Kato, Y., Inoue, S., Doi, K., Murase, J., & Nishiuchi, S. (2022). Estimating yield-related traits using UAV-Derived multispectral images to improve rice grain yield prediction. Agriculture, 12(8), 1141. 12(8. https://doi.org/10.3390/agriculture12081141
- Bendig, J., Yu, K., Aasen, H., Bolten, A., Bennertz, S., Broscheit, J., Gnyp, M. L., & Bareth, G. (2015). Combining UAV-based plant height from crop surface models, visible, and near infrared vegetation indices for biomass monitoring in barley. International Journal of Applied Earth Observation and Geoinformation, 39, 79–87. https://doi.org/10.1016/j.jag.2015.02.012
- Broge, N. H., & Leblanc, E. (2001). Comparing prediction power and stability of broadband and hyperspectral vegetation indices for estimation of green leaf area index and canopy chlorophyll density. Remote Sensing of Environment, 76(2), 156–172. https://doi.org/10.1016/S0034-4257(00)00197-8
- Budach, L., Feuerpfeil, M., Ihde, N., Nathansen, A., Noack, N., Patzlaff, H., Naumann, F., & Harmouch, H. (2022). The effects of data quality on machine learning performance. arXiv preprint arXiv:2207.14529. https://doi.org/10.48550/arXiv.2207.14529
- Buschman, C., & Nagel, E. (1993). In vivo spectroscopy and internal optics of leaves as basis for remote sensing of vegetation. International Journal of Remote Sensing, 14(4), 711–722. https://doi.org/10.1080/01431169308904370
- Chen, J. M. (1996). Evaluation of vegetation indices and a modified simple ratio for boreal applications. Canadian Journal of Remote Sensing, 22(3), 229–242. https://doi.org/10.1080/07038992.1996.10855178
- Chen, H., Chen, J., & Ding, J. (2021). Data evaluation and enhancement for quality improvement of machine learning. IEEE Transactions on Reliability, 70(2), 831–847. https://doi.org/10.1109/TR.2021.3070863
- Demšar, J. (2006). Statistical comparisons of classifiers over multiple data sets. The Journal of Machine Learning Research, 7, 1–30. https://dl.acm.org/doi/10.5555/1248547.1248548
- Dobermann, A., Pampolino, M. F., & Neue, H. U. (1995). Spatial and temporal variability of transplanted rice at the field scale. Agronomy Journal, 87(4), 712–720. https://doi.org/10.2134/agronj1995.00021962008700040018x
- Gitelson, A. A., Kaufman, Y. J., Stark, R., & Rundquist, D. (2002). Novel algorithms for remote estimation of vegetation fraction. Remote Sensing of Environment, 80(1), 76–87. https://doi.org/10.1016/S0034-4257(01)00289-9
- Haboudane, D., Miller, J. R., Pattey, E., Zarco-Tejada, P. J., & Strachan, I. B. (2004). Hyperspectral vegetation indices and novel algorithms for predicting green LAI of crop canopies: Modeling and validation in the context of precision agriculture. Remote Sensing of Environment, 90(3), 337–352. https://doi.org/10.1016/j.rse.2003.12.013
- Hague, T., Tillett, N. D., & Wheeler, H. (2006). Automated crop and weed monitoring in widely spaced cereals. Precision Agriculture, 7(1), 21–32. https://doi.org/10.1007/S11119-005-6787-1/FIGURES/7
- Han, L., Yang, G., Dai, H., Xu, B., Yang, H., Feng, H., Li, Z., & Yang, X. (2019). Modeling maize above-ground biomass based on machine learning approaches using UAV remote-sensing data. Plant Methods, 15(1), 10. https://doi.org/10.1186/s13007-019-0394-z
- Huete, A. R. (1988). A soil-adjusted vegetation index (SAVI). Remote Sensing of Environment, 25(3), 295–309. https://doi.org/10.1016/0034-4257(88)90106-X
- Huete, A., Justice, C., & Liu, H. (1994). Development of vegetation and soil indices for MODIS-EOS. Remote Sensing of Environment, 49(3), 224–234. https://doi.org/10.1016/0034-4257(94)90018-3
- Jordan, C. F. (1969). Derivation of Leaf-Area Index from quality of light on the forest floor. Ecology, 50(4), 663–666. https://doi.org/10.2307/1936256
- Kim, M. S., Daughtry, C. S. T., Chappelle, E. W., McMurtrey, J. E., & Walthall, C. L. (1994, January). The use of high spectral resolution bands for estimating absorbed photosynthetically active radiation (A par). In CNES, proceedings of 6th international symposium on physical measurements and signatures in remote sensing (No. GSFC-E-DAA-TN72921), France. https://ntrs.nasa.gov/citations/19950010604
- Liu, X., Jin, J., Herbert, S. J., Zhang, Q., & Wang, G. (2005). Yield components, dry matter, LAI and LAD of soybeans in Northeast China. Field Crops Research, 93(1), 85–93. https://doi.org/10.1016/j.fcr.2004.09.005
- Li, S., Yuan, F., Ata-UI-Karim, S. T., Zheng, H., Cheng, T., Liu, X., Tian, Y., Zhu, Y., Cao, W., & Cao, Q. (2019). Combining color indices and textures of UAV-Based digital imagery for rice LAI estimation. Remote Sensing, 11(15), 1763. https://doi.org/10.3390/rs11151763
- Louhaichi, M., Borman, M. M., & Johnson, D. E. (2001). Spatially located platform and aerial photography for documentation of grazing impacts on wheat. Geocarto International, 16(1), 65–70. https://doi.org/10.1080/10106040108542184
- Lu, D., & Batistella, M. (2005). Exploring TM image texture and its relationships with biomass estimation in Rondônia, Brazilian Amazon. Acta Amazonica, 35(2), 249–257. https://doi.org/10.1590/S0044-59672005000200015
- Ma, J., Li, Y., Liu, H., Wu, Y., & Zhang, L. (2022). Towards improved accuracy of UAV-based wheat ears counting: A transfer learning method of the ground-based fully convolutional network. Expert Systems with Applications, 191, 116226. https://doi.org/10.1016/j.eswa.2021.116226
- Nemenyi, P. B. (1963). Distribution-free multiple comparisons. Princeton University.
- Peprah, C. O., Yamashita, M., Yamaguchi, T., Sekino, R., Takano, K., & Katsura, K. (2021). Spatio-temporal estimation of biomass growth in rice using canopy surface Model from unmanned aerial vehicle images. Remote Sensing, 13(12), 2388. https://doi.org/10.3390/rs13122388
- Rondeaux, G., Steven, M., & Baret, F. (1996). Optimization of soil-adjusted vegetation indices. Remote Sensing of Environment, 55(2), 95–107. https://doi.org/10.1016/0034-4257(95)00186-7
- Rouse, J. W., Hass, R. H., Schell, J. A., & Deering, D. W. (1973). Monitoring vegetation systems in the great plains with ERTS. Third Earth Resources Technology Satellite (ERTS) Symposium, 1, 309–317. citeulike-article-id:12009708
- Silleos, N. G., Alexandridis, T. K., Gitas, I. Z. & Perakis, K. (2006). Vegetation Indices: Advances Made in Biomass Estimation and Vegetation Monitoring in the Last 30 Years. Geocarto International, 21(4), 21–28. https://doi.org/10.1080/10106040608542399
- Tang, S., Zhu, Q., Wang, J., Zhou, Y., & Zhao, F. (2005). Principle and application of three-band gradient difference vegetation index. Science in China Series D: Earth Sciences, 48(2), 241–249. https://doi.org/10.1360/02yd0527
- Tanre, D., Holben, B. N., & Kaufman, Y. J. (1992). Atmospheric correction against algorithm for NOAA-AVHRR products: Theory and application. IEEE Transactions on Geoscience and Remote Sensing, 30(2), 231–248. https://doi.org/10.1109/36.134074
- Tilly, N., Hoffmeister, D., Cao, Q., Huang, S., Lenz-Wiedemann, V., Miao, Y., & Bareth, G. (2014). Multitemporal crop surface models: Accurate plant height measurement and biomass estimation with terrestrial laser scanning in paddy rice. Journal of Applied Remote Sensing, 8(1), 083671. https://doi.org/10.1117/1.jrs.8.083671
- Tsouros, D. C., Bibi, S., & Sarigiannidis, P. G. (2019). A review on UAV-Based applications for precision agriculture. Information, 10(11), 349. https://doi.org/10.3390/info10110349
- Wulder, M. A., LeDrew, E. F., Franklin, S. E., & Lavigne, M. B. (1998). Aerial image texture information in the estimation of northern deciduous and mixed wood forest leaf area index (LAI). Remote Sensing of Environment, 64(1), 64–76. https://doi.org/10.1016/S0034-4257(97)00169-7
- Xiao, Z., Liang, S., Wang, J., Jiang, B., & Li, X. (2011). Real-time retrieval of Leaf Area Index from MODIS time series data. Remote Sensing of Environment, 115(1), 97–106. https://doi.org/10.1016/j.rse.2010.08.009
- Xu, T., Wang, F., Xie, L., Yao, X., Zheng, J., Li, J., & Chen, S. (2022). Integrating the textural and spectral information of UAV hyperspectral images for the improved estimation of rice aboveground biomass. Remote Sensing, 14(11), 2534. https://doi.org/10.3390/rs14112534
- Yamaguchi, T., Sasano, K., & Katsura, K. (2023). Improving efficiency of ground-truth data collection for UAV-based Rice growth estimation models: Investigating the effect of sampling size on model accuracy. Research Square. PREPRINT (Version 1) available at Research Square. https://doi.org/10.21203/rs.3.rs-2615932/v1
- Yamaguchi, T., Tanaka, Y., Imachi, Y., Yamashita, M., & Katsura, K. (2020). Feasibility of combining deep learning and RGB images obtained by unmanned aerial vehicle for leaf area index estimation in rice. Remote Sensing, 13(1), 84. https://doi.org/10.3390/rs13010084
- Yoshida, H., Horie, T., Katsura, K., & Shiraiwa, T. (2007). A model explaining genotypic and environmental variation in leaf area development of rice based on biomass growth and leaf N accumulation. Field Crops Research, 102(3), 228–238. https://doi.org/10.1016/j.fcr.2007.04.006
- Yue, J., Yang, H., Yang, G., Fu, Y., Wang, H., & Zhou, C. (2023). Estimating vertically growing crop above-ground biomass based on UAV remote sensing. Computers and Electronics in Agriculture, 205, 107627. https://doi.org/10.1016/j.compag.2023.107627
- Zheng, H., Cheng, T., Zhou, M., Li, D., Yao, X., Tian, Y.,… Zhu, Y. (2019). Improved estimation of rice aboveground biomass combining textural and spectral analysis of UAV imagery. Precision Agriculture, 20(3), 611–629. https://doi.org/10.1007/s11119-018-9600-7