ABSTRACT
This study was carried out to clarify the actual eating quality of 33 recent cultivars of local-brand-rice and the relationship between overall eating-quality, physicochemical properties, and rice market prices. Furthermore, the local-brand-rice cultivars were grouped using principal component analysis. The overall eating-quality evaluation of the 33 LBR cultivars were at the same level or superior to that of the check cultivar Hinohikari, which is a highly palatable rice cultivar. Multiple regression analysis showed that taste contributed the most to overall eating-quality, followed by stickiness and appearance, and aroma contributed the least. No significant relationship was found between protein and amylose contents and eating quality. In contrast, moisture content showed a positive correlation with eating quality, suggesting that the improvement in eating quality with increasing moisture content was due to the decrease in the H/-H ratio of cooked rice. Although a significant positive correlation was observed between eating quality and the rice market price, the multiple correlation coefficient was 0.47, indicating that eating quality evaluation was not highly reflected in the rice market price. Principal component analysis, using the values of eating quality evaluation items in the sensory test as variables, classified the palatability characteristics of each LBR cultivars into four categories. Thus, the eating quality of the recent LBR cultivars are excellent, and the taste and moisture content are play a major role in the overall eating-quality, and the degree of reflection of the eating quality evaluation on the market price was not necessarily high.
GRAPHICAL ABSTRACT
Introduction
Currently, 310 edible paddy rice cultivars that have undergone agricultural product inspections for the 2021 crop year are cultivated in Japan, as published by the Ministry of Agriculture, Forestry and Fisheries (MAFF, Citation2021). Among them, 47 cultivars are registered as local-brand-rice (LBR) cultivars and account for only approximately 15% of the total number of edible rice cultivars. LBR cultivars designated by MAFF (Citation2001) for each prefecture in accordance with the Agricultural Product Standards Regulations under the Agricultural Product Inspection. Today, in response to consumers’ strong preference for delicious LBR cultivars, highly palatable rice cultivars are increasingly appearing on the market in each production area. In contrast, although the number of LBR cultivars has increased, most are dominated by Koshihikari or Koshihikari-type cultivars. In fact, nearly 70% of the number of the LBR cultivars in the top 10 planted areas in Japan are either Koshihikari or cultivars with a genetic background very similar to that of Koshihikari (Matsue, Citation2019).
This indicates a lack of diversity in the genetic background and raises concerns regarding genetic vulnerability. Judging from the palatability characteristics, the cooked rice of most LBR cultivars is sticky and has a soft texture. Although a wide variety of LBR cultivars are currently available, consumer taste preferences are uniform nationwide. Supporting this, Yokoe and Kawamura (Citation2014) reported that there are no regional differences in the taste preferences for rice. However, there are regional (Yoshikawa, Citation1996) and generational (Matsue & Ogata, Citation1998) differences in the taste preference of cooked rice. In addition, there are highly palatable rice cultivars that are not closely related to Koshihikari, such as Nakateshinsenbon, Asahi, and Sasanishiki, which are not very sticky, have a good aroma and taste, and are slightly hard (Matsue & Ogata, Citation1998).
Thus, as the taste preference for eating quality of rice is recognized in Japan, it is considered necessary to develop LBR cultivars supported by the taste preference in order to diversify the genetic background of LBR cultivars. This way, a highly palatable cultivar with diverse genetic backgrounds that are not biased towards Koshihikari can be constructed.
Until now, research on the palatability of LBR cultivars has been limited to specific cultivars. However, no reports have clarified the current state of eating quality evaluation and the relationship between palatability and physicochemical properties using a large number of nationally well-known LBR cultivars. In addition, although palatability is emphasized in the rice market, the relationship between palatability and rice market prices for LBR cultivars has not been clarified.
With the spread of highly palatable rice cultivars throughout Japan, it is important to clarify the palatability characteristics of LBR cultivars to develop strategies for future palatability diversity, considering the rice market. Therefore, we clarified the current status of eating quality evaluation using 33 cultivars of well-known local-brand name rice sold commercially throughout Japan and analyzed the relationship between palatability and physicochemical properties and rice market price. Furthermore, to classify the palatability characteristics of each LBR cultivar, principal component analysis was performed using the values of eating quality evaluation items in the sensory test.
Materials and methods
Sample preparation
The 33 LBR cultivars used for the 2019 and 2020 crops are shown in . The LBR cultivars used were purchased from the main producing area and that within each cultivar development province.
Table 1. List of local-brand-rice cultivars tested by producing area.
Sensory test
The sensory test was conducted at Nakamura Gakuen University (Jonan-ku, Fukuoka 814–0198, Japan). The panel consisted of 18 to 20 university faculty members at Nakamura Gakuen University. The same panel members repeated the tests twice. The eating quality of cooked rice was evaluated using the Matsue (Citation1992) method to modify The Food Agency (Citation1968) method. The check cultivar for the sensory tests was Hinohikari, produced in Zennoh-Fukuren. The following six sensory attributes were evaluated by 18 or 20 panel members: overall eating-quality, appearance, stickiness, taste, aroma, and hardness. Six sensory attributes were classified into seven stages compared with a check cultivar: −3 (considerably poor), −2 (poor), −1 (slightly poor), 0 (no difference), +1 (good), +2 (very good), and + 3 (excellent) for overall eating-quality, appearance, aroma, and taste; −3 (considerably weak) to + 3 (considerably strong) for stickiness; and − 3 (considerably soft) to + 3 (considerably hard) for hardness.
Physicochemical properties of milled rice
The moisture content of milled rice was determined using the drying method at 105°C for 5 h and expressed as % dry weight. The protein content of milled rice was measured using an Infratec1241 Grain Analyzer (Foss Japan Co., Ltd., Tokyo, Japan), and values were expressed as % dry weight. The amylose content of the milled rice was measured using an Auto Analyzer type-II (Bran+Luebbe Co. Ltd., Germany), and values were expressed as % dry weight. The hardness/adhesion (H/-H) ratio of cooked rice (an effective indicator of palatability) was measured using a Tensipresser My Boy2 (Taketomo Electric Inc., Tokyo, Japan). Protein and amylose content were expressed as averages of 2 replicates and H/-H ratio as averages of 5 replicates.
Rice market prices of LBR cultivars
The rice market price of the LBR cultivars was the price of relative transactions (year-round average), as published by MAFF (Citation2020).
Statistical analysis
ANOVA was used in conjunction with the Tukey – Kramer test for significant differences. All statistical analyses were performed using the Statcel statistical analysis system (Statcel-the Useful Addin Forms on Excel-3rd ed., Publisher OMS 2012). Principal component analysis was performed using Excel statistics (Bell Curve for Excel).
Results
Frequency distribution of overall eating-quality for different production years in the LBR cultivars
The relationship between overall eating-quality in 2019 and that in 2020 for producing LBR cultivars is shown in . A positive correlation was observed between the overall eating-quality of the 2019 and 2020 crops. Although the years of production were different, the overall eating-quality of the brand-name rice was the same. The overall eating-quality values of some cultivars differed significantly among different production years, as indicated by the dotted line. The frequency distribution of the overall eating-quality of the LBR cultivars is shown in . The distribution of overall eating-quality values (averaged over two years) ranged from − 0.33 to + 0.64, with the highest distribution in the range of 0 to + 0.20. Compared to the check cultivar Hinohikari, which is a highly palatable rice cultivar, the overall eating-quality values for all the LBR cultivars were similar or superior, and no cultivar was significantly inferior.
Figure 1. Relationship between overall eating-quality of local-brand-rice produced in 2019 and overall eating-quality of local-brand-rice produced in 2020.

Figure 2. Frequency distribution of the value of overall eating-quality for local-brand-rice cultivars.

Contribution of each evaluation item to overall eating-quality
shows the results of the multiple regression analysis with overall eating-quality over two years as the objective variable and the other evaluation items as the explanatory variables. The standard partial regression coefficient was positive for all evaluation items, and the overall eating-quality tended to be higher for cultivars with superior appearance, taste, and aroma, and higher stickiness and hardness. The standard partial regression coefficient for each evaluation item was highest for taste, at 0.584, and lowest for aroma, at 0.124. The contributions of appearance, taste, aroma, stickiness, and hardness estimated from the ratio of standard partial regression coefficients were 17%, 44%, 9%, 17%, and 13%, respectively, with taste making the largest contribution to overall eating-quality, followed by stickiness and appearance, and aroma making the smallest contribution.
Table 2. Standard partial regression coefficient for evaluation item against the overall eating-quality of cooked rice.
Relationship between palatability and physicochemical properties
No significant relationship was found between the overall eating-quality of cooked rice and the protein () or amylose () contents of milled rice. A significant positive correlation was observed between the overall eating-quality of cooked rice and the moisture content of milled rice in both years, indicating that a higher moisture content resulted in a superior overall eating-quality in cooked rice when the milled rice moisture content was within 15% (). Significant negative correlations were found between the overall eating-quality of cooked rice and the hardness/adhesion (H/-H) ratio (), and moisture content of milled rice and the H/-H ratio of cooked rice ().
Figure 3. Relationship between the palatability and the content of protein in milled rice produced in 2019.

Figure 4. Relationship between the palatability and the content of amylose in milled rice produced in 2019.

Figure 5. Relationship between the palatability and the content of moisture in milled rice.

Figure 6. Relationship between the palatability and the texture characteristics (H/-H ratio) of cooked rice produced in 2020.

Figure 7. Relationship between the content of moisture in milled rice and the texture characteristics (H/-H ratio) of cooked rice produced in 2020.

Palatability characteristics of LBR cultivar by principal component analysis
To classify the palatability characteristics of each LBR cultivar, a principal component analysis was performed using the values of eating quality evaluation items in the sensory test. The eigenvalues, contribution rates, and cumulative contribution rates of each principal component are listed in . Because the cumulative contribution ratio of the first and second principal components was 76%, we found that the palatability characteristics of LBR cultivars could be sufficiently explained by the first and second principal components. Scatterplots based on the scores of the first and second principal components are shown in . The palatability characteristics of the LBR cultivars in terms of eating quality evaluation items were classified into four groups. Group A cooked rice had excellent appearance, taste, and aroma, and was sticky and hard; Group B cooked rice had excellent appearance but poor taste and aroma, and was weak and hard; Group C cooked rice had poor appearance, taste, and aroma, and was weak and soft; and Group D cooked rice had an inferior appearance but excellent taste and aroma, and showed strong stickiness characteristics.
Figure 8. Scatter plot of first and second principal component scores.

Table 3. Eigenvector and eigenvalue.
Relationship between palatability and the price of relative transactions of rice
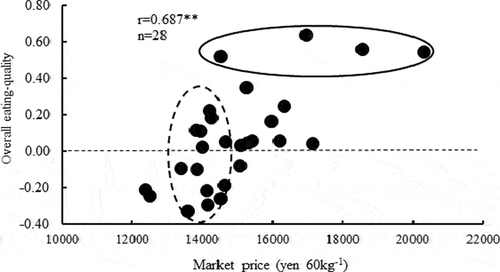
The relationship between the value of overall eating-quality (averaged over two years) and the price of the relative transactions of rice is shown in . The overall eating-quality ranged from − 0.33 to + 0.64, and the price of the relative transactions of rice ranged from 12,000 to 20,000 yen 60 kg−1. A significant positive correlation was found between overall eating-quality and the price of relative transactions of rice, indicating that the price of relative transactions of rice tended to be higher for LBR cultivars with superior overall eating-quality. However, a group with a large difference in the price of relative transactions of rice (14,530 to 20,308 yen 60 kg−1) was observed, despite the overall eating-quality being almost the same (+0.52 to + 0.64) as that in the cultivars surrounded by the solid line in the figure. In addition, similar to the cultivars enclosed by the dotted line, a group with a large difference in the value of overall eating-quality (−0.33 to + 0.22) but a small difference in the price of relative transactions of rice (13,566 to 14,634 yen 60 kg−1) was observed.
Figure 9. Relationship between the palatability and the market price of rice.

Discussion
At present, most of the LBR cultivars that are popular in Japan are cultivars close to the genetic background of Koshihikari. This study clarified the current state of eating quality evaluation using 33 cultivars of well-known LBR cultivars sold commercially throughout Japan and analyzed the relationship between overall eating-quality, physicochemical properties, and rice market price. Principal component analysis was performed according to the values of eating quality evaluation items in the sensory test for each LBR cultivar.
The eating quality evaluation of LBR cultivars and contribution of each evaluation item to the overall eating-quality
The eating quality of all LBR cultivars was similar to or better than that of the highly palatable rice cultivar Hinohirikari (), indicating that the development and planting of highly palatable rice cultivars in each region improves eating quality. This indicates that the differences in eating quality between production locations that were once commonly rumored to exist are now absent or extremely small. Taste contributed the most to the overall eating-quality evaluation, followed by stickiness and appearance, and aroma contributed the least (). This result is consistent with previous reports (Matsue, Citation1993; Matsue & Ogata, Citation1998; Shigemune et al., Citation2007), suggesting that taste and stickiness are strongly related to Japanese taste preferences, even for recent LBR cultivars.
Relationship between palatability and physicochemical properties
In this study, protein and amylose contents showed no significant relationship with overall eating-quality (), in contrast to previous reports. The evaluation of eating quality of rice produced in each production area among a wide geographic region showed that the effect of protein content on eating quality was small, and the results obtained in this study are consistent with those of Matsue et al. (Citation2004) and Matsue (Citation2016). Amylose content is not suitable as an indicator component to evaluate rice palatability under high temperature during the ripening period (Matsue, Citation2012). This indicates that protein and amylose content cannot be used as effective indicator components to evaluate the palatability of LBR cultivars with highly palatable levels.
The moisture content of milled rice was positively correlated with the eating quality evaluation for two years () and negatively correlated with the H/-H ratio () of texture characteristics (Yanagimoto, Citation2002), which is closely related to texture and deliciousness. Thus, the improvement in the eating quality due to the increase in moisture content of milled rice is considered to be due to the decrease in the H/-H ratio. In addition, for the same cultivar, the effect on eating quality was influenced more by differences in the moisture content of brown rice than by differences in production area (Matsue, Citation2016). Therefore, it is necessary to reaffirm that the moisture content of milled rice is not only the water content, but also an important component that greatly influences the evaluation of eating quality.
Palatability characteristics of LBR cultivar obtained by principal component analysis
Nishimura et al. (Citation1985), Tanifuzi et al. (Citation1988), and Sakurada et al. (Citation1993) applied principal component analysis to eating quality and related physicochemical properties to investigate its effectiveness as a selection method for breeding efficiency in highly palatable rice cultivars and breeding lines. However, there are no reports of principal component analysis of eating quality evaluation with items involved in the overall eating-quality as variables.
Considering each principal component from the calculated eigenvectors of the eating quality evaluation items, the first principal component can be interpreted as the flavor component, including taste, stickiness, and aroma, which have a significant impact on overall eating-quality, and the second principal component as the preference taste component. As shown in the score scatter diagram of the first and second principal components (), the percentage of LBR cultivars distributed in the first and fourth quadrants with superior flavor was approximately 60% (19 of 33). In contrast, the percentage of those in the first quadrant with superior flavor and appearance was only approximately 20% (7 of 33) of the total. In addition, the percentage of LBR cultivars distributed in quadrants 1 and 2 with a superior appearance was small, approximately 40% (14 of 33). Appearance in sensory tests evaluates the whiteness, glossiness, and grain shape collapse of cooked rice, as seen by the eye (The Food Agency, Citation1968), and is an important parameter that determines whether the rice is delicious. Therefore, to further improve the palatability characteristics of LBR cultivars, it is necessary to improve the appearance of cooked rice from the viewpoint of eating quality evaluation.
Relationship between palatability and the price of relative transactions of rice
This type of academic research on the levels of tastes and rice market prices using major rice cultivar samples from throughout the country may be the first to be conducted in Japan. Although there was a significant positive correlation between eating quality and price of relative transactions of rice (), the value of the multiple correlation coefficient R was 0.471. This indicates that the degree to which the eating quality is reflected in the rice market price is 47%, suggesting that the influence of eating quality on rice market price formation is small. In addition, we observed a group of cultivars with large differences in the relative price of transactions of rice despite having almost the same value of eating quality, and a group of cultivars with large differences in eating quality values but small differences in relative prices of relative rice transactions (). Thus, the values of eating quality are not always directly reflected in rice market prices.
When setting the rice market price, the eating quality and name recognition of the production area, cultivar brand, appearance quality, and cultivation method are considered. However, the ‘deliciousness’ of rice is the most important factor in determining the value of agricultural products, and a survey on why consumers are greatest concern about purchasing rice showed that eating quality is cited as the number one reason (JA General Research Institute, Citation2008). From this perspective, the value of eating quality evaluation should be given the highest priority in rice price formation. Furthermore, consumers are currently more interested in delicious rice, and international competition is intensifying to improve the quality and palatability of Japonica rice. Therefore, it is essential for the maintenance and development of domestically produced rice to reflect eating quality evaluation more strongly in the rice market price.
Acknowledgments
We are grateful to Dr. Akiko Fujita of Satake Co., Ltd. for her efforts in collecting LBR cultivars and to the Nakamura Gakuen University staff who participated as a panel in the sensory test.
Disclosure statement
No potential conflict of interest was reported by the author(s).
Data availability statement
The authors confirm that the supporting data included in this finding are available within the article.
Additional information
Funding
References
- The Food Agency. (1968). Guidelines for palatability sensory tests of rice. 1–27.
- JA General Research Institute. (2008). Survey results on rice consumption Behavior.1-31. Retrieved June 25, 2022, from https://www.japan.coop/wp/wp-content/uploads/2018/05/komechousa.pdf
- MAFF. (2001). Agricultural products standards regulations. Retrieved September 1, 2023 from https://www.maff.go.jp/j/seisan/syoryu/kensa/sentaku/attach/pdf/index-7.pdf
- MAFF. (2020). Aitai (mutual) rice market prices of 2019 products from individual regions in Japan. Retrieved August. 25, 2022 from https://www.maff.go.jp/j/seisan/keikaku/soukatu/aitaikakaku.html
- MAFF. (2021). Agricultural product inspection results of rice produced in 2021. Retrieved August 25, 2022, from https://www.maff.go.jp/j/seisan/syoryu/kensa/kome/
- Matsue, Y. (1992). On a sensory test of cooked rice in which 10 cultivars were evaluated by 13 panel members. Journal of Home Economics of Japan, 43(10), 1027–1032. https://doi.org/10.11428/jhej1987.43.1027
- Matsue, Y. (1993). The effects of environmental conditions on palatability and physicochemical properties of rice and the evaluation of good eating quality rice varieties. Special Bulletin of Fukuoka Agricultural Research Centre, 6, 1–73. https://www.farc.pref.fukuoka.jp/farc/kenpo/tokukenp/tokuho6.pdf
- Matsue, Y. (2012). Rice palatability science from the viewpoint of crop production (pp. 1–141). Yokendo Ltd.
- Matsue, Y. (2016). Technology for countermeasures to increase yield and improve quality through analysis of big data on rice cultivation. In T. Nanseki, Y. Chomei, & Y. Matsue (Eds.), Rice farm management innovation and smart agriculture in TTP era-farming technology package and ICT applications- (pp. 119–128). Yokendo Ltd.
- Matsue, Y. (2019). Development direction of paddy rice production technology as a staple food. Agriculture and Horticulture, 94(1), 15–20.
- Matsue, Y., & Ogata, T. (1998). Studies on palatability of rice grown in northern Kyushu-comparison of palatability between old and new types of rice cultivars. Nihon Sakumotsu Gakkai Kiji, 67(3), 312–317. https://doi.org/10.1626/jcs.67.312
- Matsue, Y., Okumura, Y., & Ikeda, R. (2004). Locational differences in palatability of Rice and its related factors in the Kyushu and Chugoku districts. Japan Society of Nutrition and Food Sciences, 57(6), 243–248. https://doi.org/10.4327/jsnfs.57.243
- Nishimura, M., Yamauchi, F., Ohuchi, K., & Hamamura, K. (1985). Evaluation of the eating quality of recent rice varieties and lines in Hokkaido. Res. Bulletin of the Hokkaido National Agricultural Experiment Station, 144, 77–89. https://agriknowledge.affrc.go.jp/RN/2010331727.pdf
- Sakurada, H., Sato, S., Yokoo, N., Sano, T., Yamakawa, A., & Chuba, R. (1993). Evaluation of the eating quality of rice varieties and raising lines by Principal component analysis. Tohoku Journal of Crop Science, 36, 57–59. https://doi.org/10.20725/tjcs.36.0_57
- Shigemune, A., Sasahara, H., Goto, A., Miura, K., & Yoshida, T. (2007). Analysis of the accuracy of eating quality test for breeding highly palatable rice variety. Nihon Sakumotsu Gakkai Kiji, 76(2), 306–310. https://doi.org/10.1626/jcs.76.306
- Tanifuzi, Y., Sakurada, H., Sato, S., Kikuchi, E., & Chuba, M. (1988). Breeding studies on eating quality and physicochemical properties of rice. II. Selection of good eating quality by physicochemical properties of milled rice. Rep Tohoku Br, Crop Science Society, 31, 5–6. https://doi.org/10.20725/tjcs.31.0_5
- Yanagimoto, M. 2002. Comparison of sensory characteristics in their contribution to food palatability. Journal of Cookery Science of Japan, 35(1), 32–36. https://doi.org/10.11402/cookeryscience1995.35.1_32
- Yokoe, M., & Kawamura, S. (2014). Effect of number of panelists and variances in region and ages of panelists on rice sensory evaluation. Journal of the Japanese Society of Agricultural Machinery and Food Engineers, 76(2), 170–178. https://doi.org/10.11357/jsamfe.76.2_170
- Yoshikawa, T. (1996). Section 3. Taste preferences for rice in western Japan. In M. Maesige (Ed.), Proceedings of. 1st int. technological innovation and management strategies for rice cultivation- looking to the 21st century (pp. 152–159). Yokendo Ltd.