
ABSTRACT
Objectives
The objective of this study was to investigate whether skeletal muscle cystathionine γ-lyase (CTH) contributes to high-fat diet (HFD)-induced metabolic disorders using skeletal muscle Cth knockout (CthΔskm) mice.
Methods
The CthΔskm mice and littermate Cth-floxed (Cthf/f) mice were fed with either HFD or chow diet for 13 weeks. Metabolomics and transcriptome analysis were used to assess the impact of CTH deficiency in skeletal muscle.
Results
Metabolomics coupled with transcriptome showed that CthΔskm mice displayed impaired energy metabolism and some signaling pathways linked to insulin resistance (IR) in skeletal muscle although the mice had normal insulin sensitivity. HFD led to reduced CTH expression and impaired energy metabolism in skeletal muscle in Cthf/f mice. CTH deficiency and HFD had some common pathways enriched in the aspects of amino acid metabolism, carbon metabolism, and fatty acid metabolism. CthΔskm+HFD mice exhibited increased body weight gain, fasting blood glucose, plasma insulin, and IR, and reduced glucose transporter 4 and CD36 expression in skeletal muscle compared to Cthf/f+HFD mice. Impaired mitochondria and irregular arrangement in myofilament occurred in CthΔskm+HFD mice. Omics analysis showed differential pathways enriched between CthΔskm mice and Cthf/f mice upon HFD. More severity in impaired energy metabolism, reduced AMPK signaling, and increased oxidative stress and ferroptosis occurred in CthΔskm+HFD mice compared to Cthf/f+HFD mice.
Discussion
Our results indicate that skeletal muscle CTH expression dysregulation contributes to metabolism disorders upon HFD.
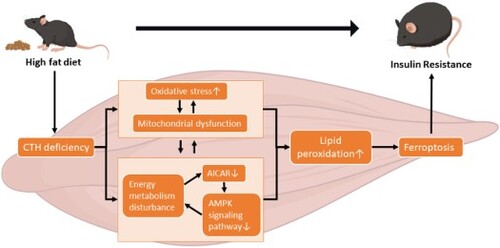
GRAPHICAL ABSTRACT
1. Introduction
Metabolic disorders like obesity and type 2 diabetes (T2D) pose global public health challenges. An unhealthy lifestyle, characterized by factors such as excessive calorie intake and consumption of high-fat diets (HFD), stands as one of the primary causes of metabolic disorders [Citation1,Citation2]. Insulin resistance (IR) is a key phenomenon in metabolic disorders, characterized by reduced glucose uptake in tissues like the liver, skeletal muscle, and adipocytes [Citation3].
Skeletal muscle plays a crucial role in glucose uptake and storage and contributes to 80% of insulin-mediated glucose disposal [Citation4]. Skeletal muscle IR is implicated as a major cause of T2D [Citation5], involving pathways like mitochondrial dysfunction, inflammation, and oxidative stress [Citation6–8]. Myokines synthesized by skeletal muscle may also contribute to IR [Citation9]. However, the underlying mechanism regarding IR in skeletal muscle remains to be further elucidated.
Cystathionine-γ-lyase (CTH) and cystathionine-β-synthetase (CBS) are ubiquitously present enzymes that are crucial in biological processes [Citation10]. CBS, catalyzed by vitamin B6, converts homocysteine and serine to cystathionine, which is then hydrolyzed by CTH to produce cysteine, used for antioxidant glutathione (GSH) synthesis [Citation10]. About 50% of cysteine is utilized for GSH biosynthesis [Citation11], playing a critical role in redox homeostasis. Cysteine is also a precursor of hydrogen sulfide (H2S), a gaseous signaling molecule. Only CTH but not CBS is identified in mouse skeletal muscle at protein level [Citation12]. Parsanathan and Jain [Citation13,Citation14] have shown that HFD downregulates CTH in mice skeletal muscle and CTH/H2S promotes glucose uptake and glucose transporter 4 (GLUT4) expression in cultured myotubes. More recently, we have shown that skeletal muscle Cth knockout leads to impaired glucose tolerance and insulin sensitivity in the mice over 21 weeks old [Citation15]. Thus, it is of great interest to know whether skeletal muscle CTH has an impact on HFD-induced metabolism disorders in an animal model.
This study aimed to investigate the impact of skeletal muscle CTH on HFD-induced metabolism disorders in vivo. Using skeletal muscle Cth knockout (CthΔskm) mice and littermate Cth-floxed (Cthf/f) controls, we assessed HFD effects on body weight, glucose levels, and insulin sensitivity. We then analyzed the changes in molecular network via RNA-seq, quasi-targeted metabolomics, quantitative real-time RT–PCR (Q-PCR), and western blotting. We showed that skeletal muscle CTH deficiency exacerbated obesity and IR after 12 weeks of HFD, which would be attributed to the more pronounced energy metabolism disturbance, mitochondria dysfunction, and ferroptosis. Our findings unveil a novel mechanism regarding the roles of skeletal muscle in metabolism disorders and T2D.
2. Materials and methods
2.1. Animals
Study was approved by the Ethics Committee of Medical Research at Xiangya Hospital, Central South University (No.2023091177). The Cth-floxed mice (Cthf/f) and Ckmm-Cre mice were obtained from Shanghai Model Organisms Center. Skeletal muscle-specific Cth-deficient (CthΔskm) mice were generated by crossing Cthf/f mice with Ckmm-Cre mice. Littermates Cthf/f mice were used as controls. Genotypes were confirmed by PCR. Only male mice were used. All mice were housed with 12 h light/dark cycle, 23°C, free access to food/water. At 4 weeks, CthΔskm mice and Cthf/f mice were randomly divided into chow and HFD groups (n = 8). HFD group was fed HFD diet (20kcal% protein, 20kcal% carbohydrate, and 60kcal% fat, SYSE Bio-tech Co., LTD, Changzhou, China) for 13 weeks. All mice were sacrificed with deep anesthesia at 17 weeks. Before scarification, mice were fasted overnight. Blood was collected and plasma was obtained. Skeletal muscles including the quadriceps (QUA), gastrocnemius (GAS), triceps brachii (TRI), and tibialis anterior (TA) were dissected, weighed, snap frozen in liquid nitrogen, and stored at −80°C. A small portion of the GAS muscle was fixed in 4% paraformaldehyde.
2.2. RNA-sequencing
GAS muscles (n = 8/group) were used for RNA-seq (NovoGene, Beijing, China). The mRNA was purified from total RNA using poly-T beads and sequenced on Illumina NovaSeq 6000 (150 bp paired-end reads). Demultiplexing was carried out with Bcl2fastq2 v2.17. The reads were mapped to UCSC transcripts (Hisat2 v2.0.5). Gene expression was estimated using featurecounts v1.5.0-p3. Normalization of gene expression was accomplished using the trimmed mean of M-values (DESeq). Differentially expressed genes (DEGs) were identified using the DESeq2 R package (1.16.1), with criteria set at p < 0.05 and |log2FoldChange| > 0.5. Subsequent pathway analysis included Gene Ontology (GO) enrichment analysis and Kyoto Encyclopedia of Genes and Genomes (KEGG) enrichment analysis was conducted at NovoMagic platform (NovoGene, Beijing, China).
2.3. Quasi-targeted metabolomics
GAS muscle tissues were utilized for Quasi-targeted metabolomics conducted by NovoGene (Beijing, China). In brief, the samples were individually ground with liquid nitrogen, and the homogenate was resuspended in prechilled 80% methanol through vigorous vortexing. The samples were incubated on ice for 5 min and then centrifuged at 15,000 g, 4°C for 20 min. A portion of the supernatant was diluted to a final concentration containing 53% methanol using LC-MS grade water. The samples were then transferred to a fresh Eppendorf tube and centrifuged at 15,000 g, 4°C for 20 min. Finally, the supernatants were collected for subsequent experiments. LC-MS/MS analyses were performed using an ExionLC™ AD system (SCIEX) coupled with a QTRAP® 6500+ mass spectrometer (SCIEX). Samples were injected onto a Xselect HSS T3 (2.1 × 150 mm, 2.5 μm) using a 20-min linear gradient at a flow rate of 0.4 mL/min for the positive/negative polarity mode. Experimental sample detection using Multiple Reaction Monitoring (MRM) was based on the Novogene in-house database. Data files generated by LC-MS/MS were processed using SCIEX OS Version 1.4 to integrate and correct peaks. The area of each peak represented the relative content of the corresponding substance. Metabolite annotation utilized the KEGG database, HMDB database, and Lipidmaps database. Metabolites with VIP > 1, P-value < 0.05 were defined as differential metabolites (DEMs). Functions of these metabolites and metabolic pathways were investigated using the KEGG database at NovoMagic platform (NovoGene, Beijing, China). Integrated analysis of RNA-seq and metabolomics was conducted at MetaboAnalyst 5.0.
The details of other methods are in the supplemental materials.
3. Results
3.1. Skeletal muscle CTH deficiency leads to impaired energy metabolism in skeletal muscle
Quasi-targeted metabolomics analysis showed that the levels of 151 metabolites were significantly changed between in CthΔskm and Cthf/f mice ((A,B)). Enriched KEGG pathways of DEMs are shown in (C). Notably, metabolites linked to obesity and T2D [Citation16–20], such as γ-Glu-Leu, 3-hydroxyisobutyric acid, 2-hydroxybutyric acid (2-HB), aromatic amino acids (AAA), and branched-chain amino acids (BCAA), were elevated in CthΔskm mice (Supplemental Fig.S1).
Figure 1. Metabolomics analysis and GO biology process (BP) enrichment of RNA-seq-based transcriptome of skeletal muscle in CthΔskm mice. The CthΔskm and littermate Cthf/f mice were house under standard condition until 17 weeks old, and then sacrificed under deep anesthesia. GAS was obtained for quasi-metabolomics analysis and RNA-seq analysis. (A), volcano plot of differential metabolites (p < 0.05 and VIP > 1) between CthΔskm and Cthf/f mice (n = 8 in each group). (B), the composition of differential metabolites in skeletal muscle. (C), KEGG enrichment analysis of metabolomics between CthΔskm and Cthf/f mice. (D), Metabolic pathways in RNA-seq GO:BP enrichment between CthΔskm and Cthf/f mice.
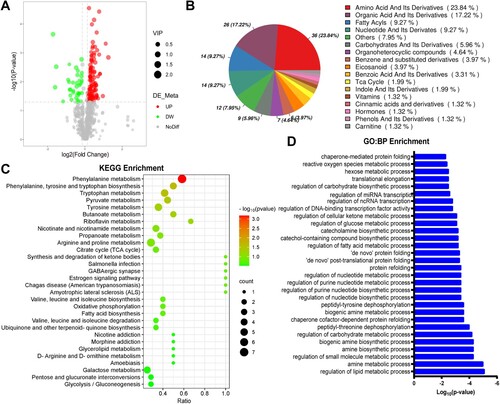
GO enrichment analysis of RNA-seq data found many metabolic process pathways were significantly enriched ((D)). Integrated analysis of metabolomics and transcriptome showed enriched pathways including fatty acid degradation, TCA cycle, pyruvate metabolism, glycolysis/gluconeogenesis, pentose phosphate pathway (PPP), etc. ((A)).
Figure 2. Energy metabolism was reduced in skeletal muscle in CthΔskm mice. The CthΔskm and littermate Cthf/f mice were housed under standard condition until 17 weeks old, and then sacrificed under deep anesthesia. GAS was obtained for quasi-metabolomics analysis, RNA-seq analysis, and Q-PCR. (A), integrated KEGG enrichment analysis of metabolomics and RNA-seq. (B), diagrammatic sketch map of glycolysis/gluconeogenesis, TCA cycle, pentose phosphate pathway, and fatty acid degradation. (C&D), the levels of metabolites in carbohydrate metabolism (C) and fatty acid degradation (D) between CthΔskm and Cthf/f mice (n = 8 in each group). (E–G), the mRNA levels of the enzymes in glycolysis/gluconeogenesis (E), TCA cycle (E), pentose phosphate pathway (F), and fatty acid degradation (G) determined by Q-PCR (n = 6 in each group). The data were expressed as mean ± SEM. *p < 0.05, **p < 0.01. G6PC1, glucose-6-phosphatase catalytic subunit 1; GPI1, glucose-6-phosphate isomerase 1; FBP1, fructose bisphosphatase 1; OGDH, oxoglutarate (alpha-ketoglutarate) dehydrogenase (lipoamide); SUCLA2, succinate-Coenzyme A ligase, ADP-forming, beta subunit; FH1, fumarate hydratase 1; MDH1, malate dehydrogenase 1, NAD (soluble); MDH2, malate dehydrogenase 2, NAD (mitochondrial); EHHADH, enoyl-Coenzyme A, hydratase/3-hydroxyacyl Coenzyme A dehydrogenase; ECHS1, enoyl Coenzyme A hydratase, short chain, 1, mitochondrial; HADHA, hydroxyacyl-CoA dehydrogenase trifunctional multienzyme complex subunit alpha; HADH, hydroxyacyl-Coenzyme A dehydrogenase; HADHB, hydroxyacyl-CoA dehydrogenase trifunctional multienzyme complex subunit beta; ACAA1A, acetyl-Coenzyme A acyltransferase 1A; ACAA1B, acetyl-Coenzyme A acyltransferase 1B; Hk1, hexokinase 1; Hk2, hexokinase 2; Pfkm, phosphofructokinase, muscle; Aldoa, aldolase A, fructose-bisphosphate; Tpi, triosephosphate isomerase 1; Pkm, pyruvate kinase, muscle; Ldha, lactate dehydrogenase A; Pck1, phosphoenolpyruvate carboxykinase 1, cytosolic; Pcx, pyruvate carboxylase; Pdhb, pyruvate dehydrogenase (lipoamide) beta; Dlat, dihydrolipoamide S-acetyltransferase; Cs, citrate synthase; Aco2, aconitase 2, mitochondrial, Idh1, isocitrate dehydrogenase 1 (NADP+), soluble; Idh2, isocitrate dehydrogenase 2 (NADP+), mitochondrial; Sdha, succinate dehydrogenase complex, subunit A, flavoprotein (Fp); Sdhd, succinate dehydrogenase complex, subunit D, integral membrane protein; Rgn, regucalcin; Idnk, idnK gluconokinase homolog (E. coli); Rpia, ribose 5-phosphate isomerase A; Rpe, ribulose-5-phosphate-3-epimerase; Tkt, transketolase; Pgd, phosphogluconate dehydrogenase; Cpt1b, carnitine palmitoyltransferase 1b, muscle; Cpt2, carnitine palmitoyltransferase 2; Acadl, acyl-Coenzyme A dehydrogenase, long-chain; Acadsb, acyl-Coenzyme A dehydrogenase, short/branched chain; Acaa2, acetyl-CoA acyltransferase 2.
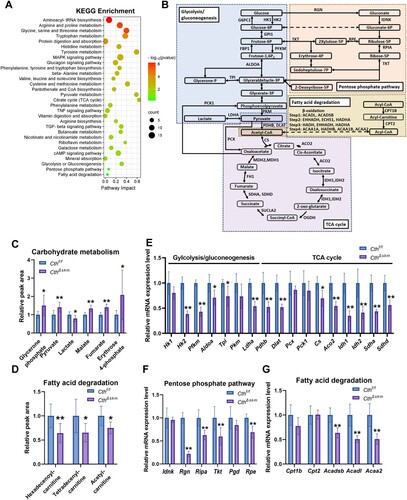
We examined the expression levels of the key genes in some pathways including glycolysis/gluconeogenesis, TCA cycle, pentose phosphate pathway (PPP), and fatty acid degradation ((B)). The mRNA levels of Hk2, Pfkm, Aldoa, etc., were significantly decreased in glycolysis/gluconeogenesis, TCA cycle, and PPP pathways in CthΔskm mice ((E,F)). The levels of glycerone phosphate, pyruvate, malate, fumarate, and erythrose 4-phosphate were increased while the level of lactate was decreased in CthΔskm mice ((C)), which might indicate the decreased enzymes resulted in accumulation of intermediate metabolites in above pathways. The mRNA of Acadsb, Acadl, and Acaa2 and the levels of the acyl-carnitines were decreased in fatty acid (FA) degradation ((D,G)), indicating impaired FA degradation in CthΔskm mice.
3.2. Skeletal muscle CTH deficiency promotes obesity, IR, hyperglycemia and muscle injury upon HFD
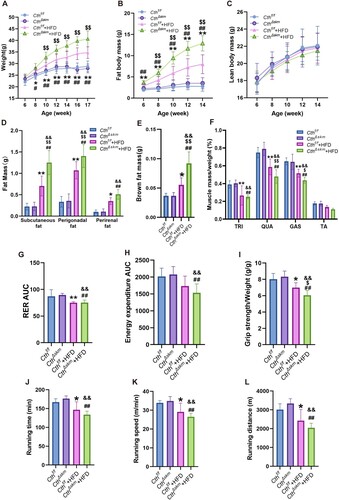
The CthΔskm mice exhibited higher body weight gain than Cthf/f mice since HFD for 6 weeks, with fat mass rising faster than lean mass from 4 weeks onwards ((A–C)). CthΔskm mice exhibited increased relative fat mass and reduced relative lean mass after 2 weeks of HFD (Supplemental Fig.2A&B). After HFD for 13 weeks, brown and white fat weights rose in CthΔskm mice, while relative skeletal muscle weight decreased ((D–F)). Metabolic rate analysis revealed reduced respiratory exchange ratio (RER) and energy expenditure in CthΔskm+HFD mice compared to CthΔskm mice ((G,H) and supplemental Fig.S2C&D), indicating a diminished metabolism rate, possibly due to decreased skeletal muscle mass. Exercise performance, grip strength, and running capabilities declined in both Cthf/f+HFD and CthΔskm+HFD mice compared to their respective controls ((I–L)).
Figure 3. The effects of HFD on body weight, body fat composition, metabolism rate and exercise performance in CthΔskm and Cthf/f mice. The CthΔskm and littermate Cthf/f mice were fed with HFD or chow from 4 weeks old. The body weight and body fat composition were determined from 6 weeks old. Treadmill exhaustive exercise capacity and grip strength were determined at 17 weeks old. The mice were then sacrificed, and fat tissue and skeletal muscle tissues were obtained and weighted. (A–C), the body weight (A), fat body mass (B), and lean body mass (C) in CthΔskm and Cthf/f mice with chow and HFD. (D–F), the white fat mass (D), brown fat mass (E) and skeletal muscle mass (F) in CthΔskm and Cthf/f mice with chow and HFD at 17 weeks old. (G&H), the metabolism rate of CthΔskm and Cthf/f mice with chow and HFD at 16 weeks old. (I–L), grip strength (I) and treadmill exhaustive exercise capacity including running time (J), speed (K) and distance (L). The data were expressed as mean ± SEM. n = 8 in each group. *p < 0.05, **p < 0.01 (Cthf/f vs. Cthf/f+HFD); # p < 0.05, ## p < 0.01 (CthΔskm vs. CthΔskm+HFD); $ p < 0.05, $$ p < 0.01 (Cthf/f+HFD vs. CthΔskm+HFD); & p < 0.05, && p < 0.01 (Cthf/f vs. CthΔskm+HFD). TRI, triceps; QUA, quadriceps; GAS, gastrocnemius; TA, tibialis anterior; RER, respiratory exchange ratio.
After 12 weeks of HFD, increased fasting blood glucose, increased plasma insulin, and impaired glucose tolerance and insulin sensitivity were observed in Cthf/f mice. The homeostasis model assessment of insulin resistance (HOMA-IR) was then calculated, and it was significantly increased in Cthf/f mice with HFD compared to Cthf/f mice with chow. These indexes were worsened in CthΔskm +HFD mice ((A–G)).
Figure 4. The effects of HFD on fasting blood glucose, insulin sensitivity, and morphology of skeletal muscle in CthΔskm and Cthf/f mice. The CthΔskm and littermate Cthf/f mice were fed with HFD or chow from 4 weeks old. The fasting blood glucose level was determined at 16 weeks old. Intraperitoneal glucose tolerance test (IGTT) and insulin tolerance test (ITT) were determined at 16 weeks old and 17 weeks old, respectively. The mice were then sacrificed, and blood, fat tissue and skeletal muscle tissues were obtained at 17 weeks old. (A–G), fasting blood glucose level (A), IGTT (B&C), ITT (D&E), plasma insulin (F), and HOMA-IR (G) in CthΔskm and Cthf/f mice with chow and HFD (n = 8 in each group). (H), HE staining of GAS muscle and fat tissue cross-section area (n = 6 in each group). Black arrow head, fat tissue. (I), TEM images of the skeletal muscle. Red arrow head, mitochondria. The data were expressed as mean ± SEM. * p < 0.05, ** p < 0.01 (Cthf/f vs. Cthf/f+HFD); # p < 0.05, ## p < 0.01 (CthΔskm vs. CthΔskm+HFD); $ p < 0.05, $$ p < 0.01 (Cthf/f+HFD vs. CthΔskm+HFD); & p < 0.05, && p < 0.01 (Cthf/f vs. CthΔskm+HFD).
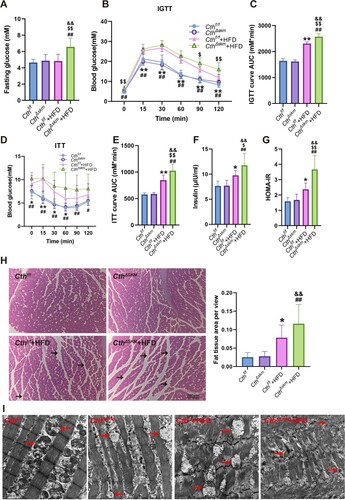
Blood cholesterol levels increased significantly in both CthΔskm and Cthf/f mice on HFD, but no difference was observed between CthΔskm +HFD mice and Cthf/f +HFD mice (supplemental Fig.S2E). H&E staining showed that more fat tissue area was found in Cthf/f +HFD and CthΔskm+HFD mice than their respective controls ((H)). Transmission electron microscope (TEM) analysis showed CthΔskm had reduced mitochondria and edematous mitochondria. Cthf/f+HFD had abnormal mitochondria and myofilament alignment. CthΔskm+HFD had the worst morphologic presentation, with fewest mitochondria, edematous mitochondria, and disrupted myofilament arrangement ((I)).
3.3. Some common pathways in skeletal muscle occur upon skeletal muscle CTH deficiency and HFD treatment
Metabolomics revealed 253 significantly altered metabolites in HFD mice compared to chow mice (supplemental Fig.S3A&B). KEGG enrichment analysis of DEMs is shown in supplemental Fig.S3C. Some metabolites related to obesity and T2D were increased in Cthf/f+HFD mice (supplemental Fig.S3D). Moreover, altered levels of choline, lysophosphatidylcholine, and eicosanoids were observed in Cthf/f+HFD mice (supplemental Fig.S3E&F).
RNA-seq identified 875 up-regulated and 977 down-regulated genes, including Cth, downregulated in Cthf/f+HFD mice (supplemental Fig.S4A). Western blotting showed CTH protein expression was significantly downregulated in Cthf/f+HFD mice (supplemental Fig.S4D). Enriched GO and KEGG pathways of DEGs are shown in supplemental Fig.S4B&C. Integrated KEGG analysis of metabolomics and transcriptome in Cthf/f+HFD/Cthf/f showed the pathways including fatty acid degradation, TCA cycle, aminoacyl-tRNA biosynthesis, AMPK signaling pathway, etc. ((A)).
Figure 5. The effects of HFD on energy metabolism in Cthf/f mice based on metabolomics and RNA-seq analysis. The Cthf/f mice were fed with HFD or chow from 4 weeks old. The mice were then sacrificed, and blood, fat tissue and skeletal muscle tissues were obtained at 17 weeks old. GAS was obtained for quasi-metabolomics analysis and RNA-seq analysis. (A), integrated KEGG enrichment analysis of metabolomics and transcriptome in skeletal muscle in the mice upon HFD. (B), levels of the metabolites of carbohydrate metabolism in skeletal muscle (n = 8 each group). (C), levels of the metabolites of fatty acid degradation in skeletal muscle (n = 8 each group). (D&E), mRNA levels of the genes in glycolysis/gluconeogenesis, TCA, and pentose phosphate pathway (D) as well as fatty acid degradation (E) determined by Q-PCR (n = 6 each group). (F), Venn diagram of differential metabolites in Cthf/f+HFD/Cthf/f and CthΔskm/Cthf/f. (G), Venn diagram of KEGG pathways based on analysis of metabolomics between Cthf/f+HFD/ Cthf/f and CthΔskm/Cthf/f. The data were expressed as mean ± SEM. * p < 0.05, ** p < 0.01.
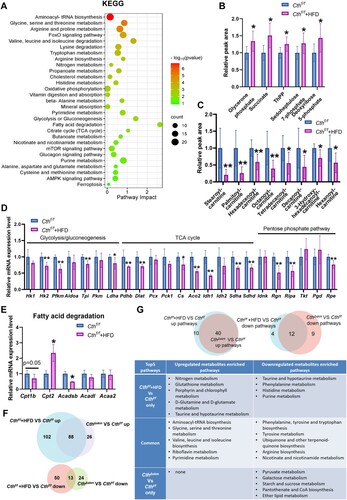
In glycolysis/gluconeogenesis, TCA cycle, and PPP, Cthf/f+HFD mice exhibited increased metabolites (glycerone phosphate, succinate, ThPP, sedoheptulose 7-phosphate, and deoxyribose 5-phosphate) with decreased enzyme mRNA levels ((B,D)), indicating that the above pathways were impaired. In fatty acid degradation, downregulated acyl-carnitines and decreased Cpt1b and Acadsb mRNA levels were shown in Cthf/f+HFD mice ((C,E)).
A total of 101 common DEMs were found between Cthf/f+HFD/Cthf/f and CthΔskm/Cthf/f ((F)), inferring some similarity between metabolic regulation via HFD and CthΔskm. In terms of the KEGG pathways based on metabolomics, we found many common pathways and a few differential pathways between CthΔskm/Cthf/f and Cthf/f+HFD/Cthf/f ((G)). Some of the common upregulated pathways (aminoacyl-tRNA biosynthesis, glycine, serine, and threonine metabolism) and the common downregulated pathways (phenylalanine, tyrosine, and tryptophan biosynthesis, tyrosine metabolism, nicotinate and nicotinamide metabolism) have been implicated in metabolic disorders and IR [Citation19–24]. Thus, it may imply that IR induced by HFD and CTH deficiency is associated with the above signaling pathways. The common and differential enriched pathways based on RNA-seq between Cthf/f+HFD/Cthf/f and CthΔskm/Cthf/f are shown in supplemental Fig.S5.
3.4. CthΔskm mice and Cthf/f mice exhibit common and differential pathways enriched in skeletal muscle in response to HFD
In CthΔskm mice, HFD induced changes in 178 metabolites (supplemental Fig.S6A&B). The KEGG-enriched pathways of DEMs are shown in supplemental Fig.S6C. Notably, the levels of 2-HB, BCAA, AAA, and lysophosphatidylcholines increased while levels of cholines were decreased in CthΔskm+HFD mice (supplemental Fig.S6D&E). RNA-seq identified 759 up-regulated and 765 down-regulated genes, showing enrichment in insulin signaling, insulin resistance, and related pathways (supplemental Fig.S7A–C). Integrated analysis of metabolomics and transcriptome revealed pathways like mTOR signaling and protein digestion and absorption in CthΔskm+HFD/CthΔskm ((A)). It was shown that glycolysis/gluconeogenesis and TCA cycle metabolites (glycerone phosphate, malate, and fumarate) decreased while PPP pathway metabolites (gluconolactone and deoxyribose 5-phosphate) increased in CthΔskm+HFD mice ((B)). The changes of mRNA levels of enzymes in glycolysis/gluconeogenesis, TCA cycle, and fatty acid degradation pathways are shown in (D,E) and supplemental Fig.S7D&E. The enzymes of PPP were not affected by HFD in CthΔskm (supplemental Fig.S7F). These data indicated that severe energy metabolism disorder occurs in CthΔskm mice upon HFD.
Figure 6. The effects of HFD on energy metabolism in CthΔskm mice based on metabolomics and RNA-seq analysis. CthΔskm and Cthf/f mice were fed with HFD or chow from 4 weeks old. The mice were then sacrificed, and blood, fat tissue and skeletal muscle tissues were obtained at 17 weeks old. GAS was obtained for quasi-metabolomics analysis and RNA-seq analysis. (A), integrated KEGG enrichment analysis of metabolomics and transcriptome in skeletal muscle in CthΔskm mice upon HFD. (B&C), levels of the metabolites of carbohydrate metabolism (B) and fatty acid degradation (C) in skeletal muscle in CthΔskm mice with chow and HFD diet (n = 8 in each group). (D&E), mRNA levels of the genes in glycolysis/gluconeogenesis and TCA (D, only significantly changed genes were shown) as well as fatty acid degradation (E) determined by Q-PCR (n = 6 in each group). (F), Venn diagram of differential metabolites between CthΔskm+HFD/CthΔskm and Cthf/f+HFD/Cthf/f. (G), Venn diagram of KEGG pathways based on analysis of metabolomics between CthΔskm+HFD/CthΔskm and Cthf/f+HFD/Cthf/f. The data were expressed as mean ± SEM. * p < 0.05; ** p < 0.01.
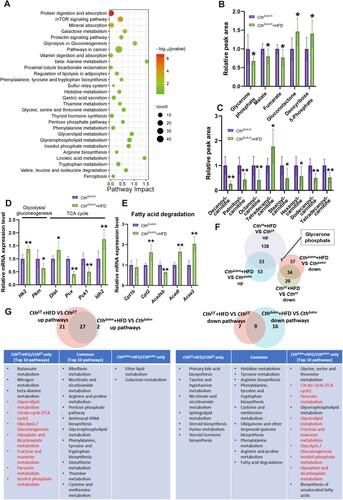
There were 87 common DEMs changed similarly in CthΔskm+HFD/CthΔskm and Cthf/f+HFD/Cthf/f, except for glycerone phosphate ((F)). We further analyzed the common and differential pathways enriched between CthΔskm+HFD/CthΔskm and Cthf/f+HFD/Cthf/f in metabolomics. Notably, the pathways TCA cycle, glycolysis/gluconeogenesis, glyoxylate and dicarboxylate metabolism, pyruvate metabolism, fructose and mannose metabolism, inositol phosphate metabolism were upregulated in Cthf/f+HFD/Cthf/f but downregulated in CthΔskm+HFD/CthΔskm ((G)). Analysis of the common and differential enriched pathways of transcriptome between CthΔskm+HFD/CthΔskm and Cthf/f+HFD/Cthf/f showed the relatively big difference in pathways occurred between CthΔskm+HFD/CthΔskm and Cthf/f+HFD/Cthf/f (supplemental Fig.S8).
3.5. CTH deficiency promoting HFD-induced IR and energy metabolism disorder and muscle injury is associated with suppressed AMPK signaling, lipid peroxidation, and ferroptosis
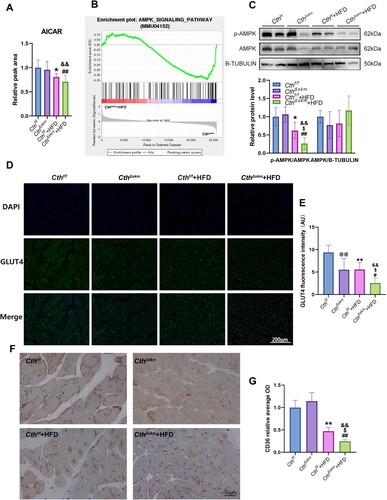
The 5-aminoimidazole-4-carboxamide ribonucleotide (AICAR), an endogenous AMPK activator [Citation25], significantly decreased in Cthf/f+HFD and CthΔskm+HFD mice ((A)). GSEA analysis revealed AMPK signaling downregulation in CthΔskm+HFD/CthΔskm ((B)). Western blotting showed p-AMPK level was decreased in Cthf/f+HFD mice and further decreased in CthΔskm+HFD mice, indicating reduced AMPK activation ((C)). GLUT4 expression and distribution were affected in CthΔskm and CthΔskm+HFD and further reduced in CthΔskm+HFD mice ((D,E)). Little GLUT4 is located in the cell membrane in CthΔskm+HFD mice ((D)). Similar changes were observed in CD36 expression and distribution ((F,G)).
Figure 7. The effects of HFD on AMPK activation, GLUT4 expression, and CD36 expression in CthΔskm and Cthf/f mice. The CthΔskm and littermate Cthf/f mice were fed with HFD or chow from 4 weeks old. The mice were then sacrificed, and blood, fat tissue and skeletal muscle tissues were obtained at 17 weeks old. GAS was obtained for western blotting, immunofluorescence, and immunohistochemistry. (A), the level of AICAR in skeletal muscle (n = 8 in each group). (B), AMPK signaling pathway enriched in GSEA analysis based on RNA-seq data of CthΔskm+HFD and CthΔskm. (C), the protein levels of p-AMPK and AMPK in CthΔskm and Cthf/f mice with HFD and chow determined by western blotting (n = 6 in each group). (D&E), GLUT4 expression and distribution in skeletal muscle determined by immunofluorescence analysis (n = 6 in each group). (F&G), CD36 expression and distribution in skeletal muscle determined by immunohistochemistry (n = 6 in each group). The data were expressed as mean ± SEM. *p < 0.05, ** p < 0.01 (Cthf/f vs. Cthf/f+HFD); # p < 0.05, ## p < 0.01 (CthΔskm vs. CthΔskm+HFD); $ p < 0.05, $$ p < 0.01 (Cthf/f+HFD vs. CthΔskm+HFD); & p < 0.05, && p < 0.01 (Cthf/f vs. CthΔskm+HFD); @ p < 0.05, @@ p < 0.01 (Cthf/f vs. CthΔskm).
Mitochondrial functions were found to be impaired, i.e. increased ROS and decreased MMP and ATP, in Cthf/f+HFD mice, and worsen in CthΔskm+HFD mice ((A–C)). The total antioxidative capacity (T-AOC) was reduced in CthΔskm, Cthf/f+HFD, and CthΔskm+HFD mice compared to Cthf/f mice ((D)). MDA was increased in Cthf/f+HFD mice and further increased in CthΔskm+HFD mice ((E)). GSH/GSSG level was significantly reduced in CthΔskm+HFD mice compared to CthΔskm mice ((F)).
Figure 8. The effects of HFD on mitochondrial function, oxidative stress, and ferroptosis in CthΔskm and Cthf/f mice. The CthΔskm and littermate Cthf/f mice were fed with HFD or chow from 4 weeks old. The mice were then sacrificed, and blood, fat tissue and skeletal muscle tissues were obtained at 17 weeks old. GAS was obtained for mitochondrial function analysis, oxidative stress and western blotting. (A–C), mitochondrial function analysis including reactive oxygen species (ROS, A), mitochondrial membrane potential (MMP, B), and ATP (C) levels. (D–F), oxidative stress index including total antioxidant capacity (T-AOC, D), malondialdehyde (MDA, E), and GSH/GSSG ratio (F). (G), the protein levels of ACSL4 and GPX4 in CthΔskm and Cthf/f mice with HFD and chow determined by western blotting. The data were expressed as mean ± SEM. n = 6 in each group. *p < 0.05, ** p < 0.01 (Cthf/f vs. Cthf/f+HFD); # p < 0.05, ## p < 0.01 (CthΔskm vs. CthΔskm+HFD); $ p < 0.05, $$ p < 0.01 (Cthf/f+HFD vs. CthΔskm+HFD); & p < 0.05, && p < 0.01 (Cthf/f vs. CthΔskm+HFD); @ p < 0.05, @@ p < 0.01 (Cthf/f vs. CthΔskm).
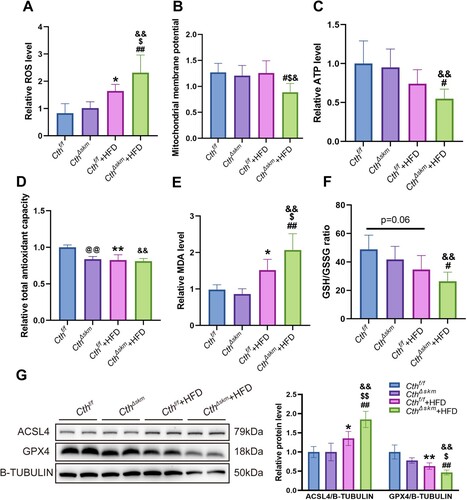
Given that increased MDA and reduced GSH/GSSG are associated with ferroptosis, we examined whether ferroptosis occurs in these mice. As shown in (G), GPX4 level was reduced whilst ACSL4 level was increased in Cthf/f+HFD mice compared to Cthf/f and CthΔskm+HFD mice compared to Cthf/f+HFD mice.
4. Discussion
We previously showed that skeletal muscle CTH deficiency causes IR in the mice over 21 weeks old although fasting glucose level remains normal level, which is associated with reduced expression of GLUT4 in skeletal muscle [Citation15]. In the present study, we found that many metabolism pathways were changed in the CthΔskm mice at 17 weeks old. Particularly, glycolysis, TCA cycle and fatty acid β-oxidation were significantly changed in CthΔskm mice, suggesting that skeletal muscle CTH deficiency causes impaired energy metabolism. Amino acid metabolism-linked to metabolic disorder and T2D were significantly changed in CthΔskm mice. Since 2-HB is a byproduct of glutathione anabolism, amino acid catabolism and fatty acid metabolism, our data implies that excess cysteine synthesis pathway and amino acid catabolism occurs in skeletal muscle after CTH knockout. BCAA metabolism disorder and increased 2-HB level in skeletal muscle occurred before the occurrence of IGTT and ITT impairment, suggesting that the above changes in skeletal muscle make contribution to IR in CthΔskm mice. As mentioned, 50% of the cysteine generated by the transsulfuration pathway is utilized for GSH biosynthesis [Citation11], and GSH is critical for scavenging ROS [Citation26]. Consistently, we found that T-AOC was reduced in CthΔskm mice. Abnormal mitochondrial morphology occurred in CthΔskm mice. Thus, impaired energy metabolism might be attributed to abnormal mitochondria in CthΔskm mice.
Of note, HFD led to reduced CTH expression in skeletal muscle, and HFD and CTH deficiency shared many common signaling pathways, which may suggest that the metabolism changes caused by HFD is partly associated with reduced CTH expression in skeletal muscle. Phosphatidylcholine metabolism and glutamine metabolism are associated with IR caused by HFD [Citation27]. Consistently, reduced glutamine metabolism and phosphatidylcholine metabolism occurred upon HFD. In addition, 2-HB level was significantly increased upon HFD, which is consistent with the phenotype of IR.
HFD could induce oxidative stress and mitochondrial dysfunction [Citation28]. Consistently, oxidative stress and impaired mitochondrial morphology and function were found in skeletal muscle in response to a high-fat diet. Energy metabolism was also impaired in skeletal muscle upon HFD. In fact, omics analysis showed that other metabolism disorders were found in skeletal muscle upon HFD, such as, phosphatidylcholine metabolism, aminoacyl-tRNA biosynthesis. It is known that the above signaling pathways are associated with IR and obesity [Citation27,Citation29]. Of note, skeletal muscle CTH deficiency exacerbates oxidative stress, mitochondrial dysfunction, and lipid peroxidation upon HFD. CTH deficiency reduces antioxidative capacity, which would lead to more severity in oxidative stress, mitochondrial dysfunction, and lipid peroxidation upon HFD. There were many differential pathways enriched among Cthf/f and CthΔskm mice in response to HFD, TCA cycle, glycolysis/gluconeogenesis, glyoxylate and dicarboxylate metabolism, pyruvate metabolism, fructose and mannose metabolism, etc. More severity in mitochondrial dysfunction was found in CthΔskm+HFD mice. Together, the above changes are associated with more severity in energy metabolism disorder in CthΔskm mice upon HFD.
Decreased AMPK activation was found in both Cthf/f and CthΔskm mice with HFD. Interestingly, the levels of AICAR, the AMPK activator, were reduced in both Cthf/f and CthΔskm mice with HFD. AMPK signaling is an important regulator of glucose metabolism and lipid metabolism [Citation25]. The energy of skeletal muscles mainly comes from glucose and FA [Citation30]. Glucose and FA uptake by skeletal muscle are mainly through two factors GLUT4 and CD36 [Citation30]. Activated AMPK promotes GLUT4 and CD36 expression and induces translation of GLUT4 and CD36 to cell membranes [Citation31,Citation32]. Consistently, we found that GLUT4 and CD36 expression levels and GLUT4 and CD36 in cell membranes were reduced in Cthf/f+HFD and CthΔskm+HFD mice. In fact, GLUT4 expression level was reduced in CthΔskm mice although AMPK activation was not reduced in CthΔskm mice compared to Cthf/f mice. PI3K/AKT signaling promotes GLUT4 expression and translocation in cell membrane of skeletal muscle [Citation33]. We have previously demonstrated that skeletal muscle CTH deficiency leads to reduced PI3K/AKT signaling [Citation15], which contributes to reduced GLUT4 expression and translocation in cell membrane.
Ferroptosis occurred in CthΔskm mice with HFD, which was attributed to the increased severity of oxidative stress, lipid peroxidation, and mitochondrial dysfunction in these mice. CD36 expression was robustly reduced, particularly, very little CD36 in cell membrane was found in CthΔskm+HFD mice. Some studies have demonstrated that reduced CD36 in cell membrane leads to FAs accumulation in cell membrane, which contributes to lipid peroxidation [Citation34]. The muscle injury induced by ferroptosis would aggravate IR in skeletal muscle CTH deficiency mice upon HFD.
In conclusion, skeletal muscle CTH deficiency could lead to impaired energy metabolism and amino acid metabolism and reduced antioxidant capacity, which increases the risk of IR. Upon to HFD, skeletal muscle CTH deficiency causes more severity in impaired energy metabolism and mitochondria dysfunction, and lipid peroxidation, and subsequently leads to ferroptosis, which aggravates IR and promotes hyperglycemia and obesity. Our study highlights the importance of skeletal muscle CTH in IR and energy metabolism disorder.
supplemental material_rev.pdf
Download ()supplemental_material_rev cleaned.docx
Download MS Word (8.6 MB)Acknowledgments
The graphic abstract was created by figdraw.com.
Disclosure statement
No potential conflict of interest was reported by the author(s).
Data availability statement
The RNA-seq data is available at Gene Expression Omnibus (accession number: GSE254704).
Additional information
Funding
References
- Vandevijvere S, Chow CC, Hall KD, et al. Increased food energy supply as a major driver of the obesity epidemic: a global analysis. Bull World Health Organ. 2015;93:446–456. doi:10.2471/BLT.14.150565
- Angelico F, Baratta F, Coronati M, et al. Diet and metabolic syndrome: a narrative review. Intern Emerg Med. 2023;18:1007–1017. doi:10.1007/s11739-023-03226-7
- Lee S-H, Park S-Y, Choi CS. Insulin resistance: from mechanisms to therapeutic strategies. Diabetes Metab J. 2022;46:15–37. doi:10.4093/dmj.2021.0280
- Thiebaud D, Jacot E, DeFronzo RA, et al. The effect of graded doses of insulin on total glucose uptake, glucose oxidation, and glucose storage in man. Diabetes. 1982;31:957–963. doi:10.2337/diacare.31.11.957
- DeFronzo RA, Tripathy D. Skeletal muscle insulin resistance is the primary defect in type 2 diabetes. Diabetes Care. 2009;32(Suppl 2):S157–S163. doi:10.2337/dc09-S302
- Nieblas B, Pérez-Treviño P, García N. Role of mitochondria-associated endoplasmic reticulum membranes in insulin sensitivity, energy metabolism, and contraction of skeletal muscle. Front Mol Biosci. 2022;9:959844. doi:10.3389/fmolb.2022.959844
- Wu H, Ballantyne CM. Skeletal muscle inflammation and insulin resistance in obesity. J Clin Invest. 2017;127:43–54. doi:10.1172/JCI88880
- Hurrle S, Hsu WH. The etiology of oxidative stress in insulin resistance. Biomed J. 2017;40:257–262. doi:10.1016/j.bj.2017.06.007
- Garneau L, Aguer C. Role of myokines in the development of skeletal muscle insulin resistance and related metabolic defects in type 2 diabetes. Diabetes Metab. 2019;45:505–516. doi:10.1016/j.diabet.2019.02.006
- Cirino G, Szabo C, Papapetropoulos A. Physiological roles of hydrogen sulfide in mammalian cells, tissues, and organs. Physiol Rev. 2023;103:31–276. doi:10.1152/physrev.00028.2021
- Banerjee R, Zou C-G. Redox regulation and reaction mechanism of human cystathionine-beta-synthase: a PLP-dependent hemesensor protein. Arch Biochem Biophys. 2005;433:144–156. doi:10.1016/j.abb.2004.08.037
- Zhang Y, Masters L, Wang Y, et al. Cystathionine gamma-lyase/H2S signaling facilitates myogenesis under aging and injury condition. FASEB J. 2021;35:e21511.
- Parsanathan R, Jain SK. Hydrogen sulfide regulates circadian-clock genes in C2C12 myotubes and the muscle of high-fat-diet-fed mice. Arch Biochem Biophys. 2019;672:108054. doi:10.1016/j.abb.2019.07.019
- Parsanathan R, Jain SK. Hydrogen sulfide increases glutathione biosynthesis, and glucose uptake and utilisation in C2C12 mouse myotubes. Free Radic Res. 2018;52:288–303. doi:10.1080/10715762.2018.1431626
- Xu M, Liu X, Bao P, et al. Skeletal muscle CSE deficiency leads to insulin resistance in mice. Antioxidants. 2022;11:2216. doi:10.3390/antiox11112216
- Wu Q, Li J, Zhu J, et al. Gamma-glutamyl-leucine levels are causally associated with elevated cardio-metabolic risks. Front Nutr. 2022;9:936220. doi:10.3389/fnut.2022.936220
- Mardinoglu A, Gogg S, Lotta LA, et al. Elevated plasma levels of 3-hydroxyisobutyric acid are associated with incident type 2 diabetes. EBioMedicine. 2018;27:151–155. doi:10.1016/j.ebiom.2017.12.008
- Sousa AP, Cunha DM, Franco C, et al. Which role plays 2-hydroxybutyric acid on insulin resistance? Metabolites. 2021;11:835. doi:10.3390/metabo11120835
- Lynch CJ, Adams SH. Branched-chain amino acids in metabolic signalling and insulin resistance. Nat Rev Endocrinol. 2014;10:723–736. doi:10.1038/nrendo.2014.171
- Ding Y, Wang S, Lu J. Unlocking the potential: amino acids’ role in predicting and exploring therapeutic avenues for type 2 diabetes mellitus. Metabolites. 2023;13:1017.
- Arroyo MN, Green JA, Cnop M, et al. tRNA biology in the pathogenesis of diabetes: role of genetic and environmental factors. Int J Mol Sci. 2021;22:496. doi:10.3390/ijms22020496
- Adeva-Andany M, Souto-Adeva G, Ameneiros-Rodríguez E, et al. Insulin resistance and glycine metabolism in humans. Amino Acids. 2018;50:11–27. doi:10.1007/s00726-017-2508-0
- Mazur-Bialy AI, Pocheć E. Riboflavin reduces pro-inflammatory activation of adipocyte-macrophage co-culture. Potential application of vitamin B2 enrichment for attenuation of insulin resistance and metabolic syndrome development. Molecules. 2016;21:1724. doi:10.3390/molecules21121724
- Yang SJ, Choi JM, Kim L, et al. Nicotinamide improves glucose metabolism and affects the hepatic NAD-sirtuin pathway in a rodent model of obesity and type 2 diabetes. J Nutr Biochem. 2014;25:66–72. doi:10.1016/j.jnutbio.2013.09.004
- Herzig S, Shaw RJ. AMPK: guardian of metabolism and mitochondrial homeostasis. Nat Rev Mol Cell Biol. 2018;19:121–135. doi:10.1038/nrm.2017.95
- Muri J, Kopf M. Redox regulation of immunometabolism. Nat Rev Immunol. 2021;21:363–381. doi:10.1038/s41577-020-00478-8
- Clore JN, Harris PA, Li J, et al. Changes in phosphatidylcholine fatty acid composition are associated with altered skeletal muscle insulin responsiveness in normal man. Metabolism. 2000;49:232–238. doi:10.1016/S0026-0495(00)91455-0
- Langley MR, Yoon H, Kim HN, et al. High fat diet consumption results in mitochondrial dysfunction, oxidative stress, and oligodendrocyte loss in the central nervous system. Biochim Biophys Acta Mol Basis Dis. 2020;1866:165630. doi:10.1016/j.bbadis.2019.165630
- López-Soldado I, Torres AG, Ventura R, et al. Decreased expression of mitochondrial aminoacyl-tRNA synthetases causes downregulation of OXPHOS subunits in type 2 diabetic muscle. Redox Biol. 2023;61:102630. doi:10.1016/j.redox.2023.102630
- Hargreaves M, Spriet LL. Skeletal muscle energy metabolism during exercise. Nat Metab. 2020;2:817–828. doi:10.1038/s42255-020-0251-4
- Giacoman-Martínez A, Alarcón-Aguilar FJ, Zamilpa A, et al. α-Amyrin induces GLUT4 translocation mediated by AMPK and PPARδ/γ in C2C12 myoblasts. Can J Physiol Pharmacol. 2021;99:935–942. doi:10.1139/cjpp-2021-0027
- Zhu B, Li M-Y, Lin Q, et al. Lipid oversupply induces CD36 sarcolemmal translocation via dual modulation of PKCζ and TBC1D1: an early event prior to insulin resistance. Theranostics. 2020;10:1332–1354. doi:10.7150/thno.40021
- Jaldin-Fincati JR, Pavarotti M, Frendo-Cumbo S, et al. Update on GLUT4 vesicle traffic: a cornerstone of insulin action. Trends Endocrinol Metab. 2017;28:597–611. doi:10.1016/j.tem.2017.05.002
- Ma X, Xiao L, Liu L, et al. CD36-mediated ferroptosis dampens intratumoral CD8+ T cell effector function and impairs their antitumor ability. Cell Metab. 2021;33:1001–1012.e5. doi:10.1016/j.cmet.2021.02.015