
Abstract
Graduate higher education coverage has expanded worldwide due to globalisation, the demand for more specialised human resources and online education, exacerbated by the COVID-19 pandemic. This article validates an evaluation model of academic service quality in graduate studies that integrates HiEduQual instruments with the Kano method for graduate students at a Peruvian university. A survey was conducted among graduate students (masters programmes and continuing education) at Universidad Continental, obtaining 326 responses. The study found that the attributes that have the greatest impact on student satisfaction include the presence of foreign professors, international activities, continuous improvement of university infrastructure and constant evaluation; the dimension associated with internationalisation plays an essential role in the satisfaction of graduate students, particularly in a globalised context.
Introduction
Quality is an essential aspect of graduate education. In recent decades, quality has become a key topic in higher education. Nowadays, it is possible to find a broad range of topics that are practically investigated on the relevance of higher education quality services, but most are focused on undergraduate students (Willis & Taylor, Citation1999; Rodman et al., Citation2013; Dicker et al., Citation2018). Measuring the quality of graduate student education is essential. Quality assurance in graduate education is vital to ensure that students receive a high-quality education that prepares them for their future careers. A lack of quality assessment in graduate education can adversely affect the achievement of learning objectives (Álvarez et al., Citation2020). Graduate programmes are essential for several reasons. They can provide extensive training in multiple different areas of the chosen field. Many employers are beginning to require master’s degrees for competitive roles.
In the last decade, graduate education coverage has increased considerably. From 2010 to 2018, the number of matriculated students in Iberoamerica increased by an average of 37% at all levels, particularly in graduate education (OEI, Citation2021). With this increase in graduate education coverage, educational quality has become the focus of attention (Sáinz & Barberá, Citation2020). Furthermore, in the face of globalisation, universities have been forced to enhance their quality by improving academic and non-academic services to graduate students (Valencia et al., Citation2015). Another contextual event that affected higher education service and quality was the COVID-19 pandemic, which triggered a rapid transition to online education systems worldwide (Álvarez et al., Citation2020). This event involved new quality criteria and required reforming accreditation standards (Piñero et al., Citation2021).
The quality of graduate educational services affects virtually all aspects of social life in the long term (Ginns et al., Citation2007). Therefore, developing the right quality of graduate educational service is extremely important and essentially involves shaping and modifying its features. Each of these characteristics can be individually addressed and perceived by a client or student. For the client to be delighted, it is necessary to constantly measure the quality of these services, allowing for the continuous improvement of the educational process (Álvarez et al., Citation2020).
Service quality and service excellence
Service quality is the relationship between service expectations and user perceptions (Parasuraman et al., Citation1988). In other words, service quality is the degree to which a service meets the customer’s expectations (Ghobadian et al., Citation1994).
A related but different construct is the excellence of the service. Service excellence focuses on user delight, which occurs when service performance surprisingly exceeds customer expectations (Rust & Oliver, Citation2000) and generates intense emotions that affect their behaviour (Schneider & Bowen, Citation1999). However, Johnston (Citation2004) suggested that excellence concerns the ease with which users can interact with a service; this excellence requires organisations to keep their promises and have adequate systems to address errors.
Kano model
The model developed by Kano et al. (Citation1984) for satisfaction evaluation assumes that the relationship between the variation of the attributes of a service or product and customer or consumer satisfaction can be linear, asymmetric (or non-linear), or non-existent (Jin et al., Citation2019; Nilsson‐Witell & Fundin, Citation2005). Furthermore, this model proposes that service factors that produce satisfaction may differ from those that produce dissatisfaction and that some factors may increase customer satisfaction more proportionally than others (Barrios-Ipenza et al., Citation2021).
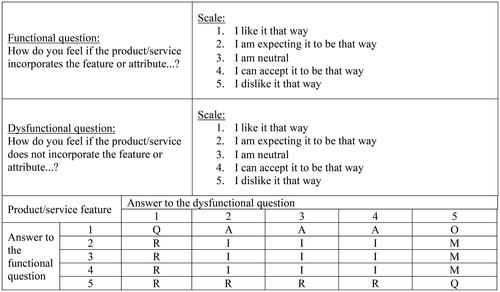
To implement this model, questionnaires are developed for users or customers who respond to items based on product or service attributes. Each attribute is evaluated by a few questions: a functional question in which customers report their level of satisfaction with the product with the attribute, and a dysfunctional question in which customers report their dissatisfaction with the product without the attribute. More specifically, students can respond in five different ways: (1) I like it that way, (2) It must be that way, (3) I am neutral, (4) I can live with that, (5) I dislike it that way (Berger et al., Citation1993; Tontini, Citation2007; Xu et al., Citation2009). The final rating of an attribute is obtained through an evaluation table (). In this table, the user's or client’s rating for each attribute is obtained based on their response to functional and dysfunctional questions. The frequencies of the ratings given by each user or client are then calculated, and the one with the highest frequency is assigned as the final rating (Madzík & Pelantová, Citation2018; Tontini & Picolo, Citation2014) ().
Figure 1. Method of classifying quality attributes in the Kano model. Source: adapted from Witell and Löfgren (Citation2007) and Madzík and Pelantová (Citation2018).
Under this approach, four attribute types interact with user satisfaction (Barrios-Ipenza et al., Citation2021; Jin et al., Citation2019) (): (1) Must-be attributes are those that, if not fulfilled, generate deep user dissatisfaction, are taken for granted and, as such, when fulfilled, do not increase satisfaction; (2) one-dimensional attributes, which increase satisfaction or dissatisfaction proportionally to their fulfilment and are usually explicitly demanded by customers; (3) attractive attributes, which have the most decisive influence on user satisfaction but whose absence does not generate dissatisfaction; (4) indifferent attributes, which have no impact on user satisfaction or dissatisfaction. Therefore, identifying and providing attractive attributes are critical to achieving service excellence (Gouthier et al., Citation2012).
Figure 2. The Kano diagram.
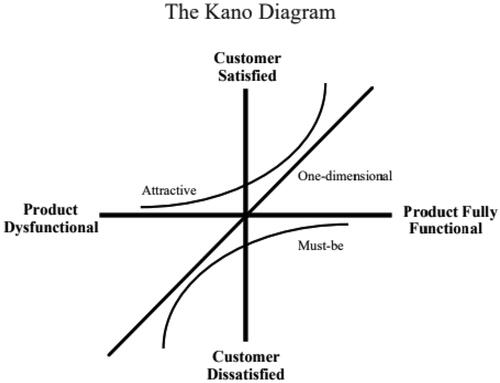
These categories are not static; they vary with time and degree of use. They usually start as indifferent and become attractive, one-dimensional and, eventually, must-be attributes (Nilsson‐Witell & Fundin, Citation2005). In this context, the Kano model is often integrated with quality function deployment (QFD) (Sauerwein et al., Citation1996), which is a user-centred planning process for developing new products or services (Kiran, Citation2017). The Kano model makes it easy to identify the essential features of a product for customer satisfaction, enabling developers to focus on them (Berger et al., Citation1993). Investing in one-dimensional or attractive attributes is more beneficial than investing in must-be attributes regarding satisfaction level because the former will substantially affect customer satisfaction more than the latter (Sauerwein et al., Citation1996). Furthermore, the identification and satisfaction of attractive attributes differentiate the service from its competition (Yang et al., Citation2010).
Kano model in higher education
The Kano model has been applied primarily to product development and design (Matzler & Hinterhuber, Citation1998). Furthermore, this model has been widely used to assess the quality of various types of services, including healthcare (Materla et al., Citation2019), hospitality and tourism (Gregory & Parsa, Citation2012; Pandey et al., Citation2020), website and application design (Zhang & Von Dran, Citation2001) and airline services (Shahin & Zairi, Citation2009).
Although the use of the Kano model in higher education remains limited in the literature, some studies have used it, usually in combination with other methods. For example, some authors (Kuo et al., Citation2011; Sahney, Citation2011; Terzakis et al., Citation2012; Um et al., Citation2021) use this model with the SERVQUAL instrument (Parasuraman et al., Citation1988). This instrument conceptualises quality as the discrepancy between expectations and the perception of a product or service. It proposes the following five categories for its measurement: reliability, tangibility, responsiveness, assurance and empathy.
In some studies, authors have developed questionnaires based on qualitative data collection and reviews of the literature (Arefi et al., Citation2012; Gruber et al., Citation2010; Ömürgönülflen & Eryi, Citation2020; Rezaie et al., Citation2012; Sukwadi et al., Citation2012; Szeliga-Duchnowska & Szewczyk, Citation2018). Other authors have integrated the Kano model into the service improvement planning process and combined it with methods such as Importance-Performance Analysis (IPA) (Kuo et al., Citation2011) and QFD (Ömürgönülflen & Eryi, Citation2020; Sahney, Citation2011).
In the context of undergraduate studies, Um et al. (Citation2021) identified system quality and security as one-dimensional attributes and information quality, responsiveness and tangibility as attractive attributes in blended learning. Terzakis et al. (Citation2012) found that facilities, equipment and services were must-have attributes, the educational content and reliability of the academic department were attractive attributes and the abilities and capabilities of professors (all teaching staff) were one-dimensional attributes. However, among technical students, Stanković et al. (Citation2018) found that the attributes that had the most significant effect on student satisfaction were the prompt responses of teachers to student demands, their availability and willingness to help students, the hospitality of the employees and the quick response time. Sahney (Citation2011) highlighted that the infrastructure, teaching skills and expertise of teachers substantially affected dissatisfaction.
Research on graduate students remains scarce. Gruber et al. (Citation2010) found that the characteristics of professors that most affected student satisfaction were kindness, enthusiasm, openness to suggestions and a sense of humour. They also identified expertise in other areas, various teaching methods, kindness, a sense of humour and motivation for teamwork as attractive attributes. Arefi et al. (Citation2012) classified various indicators according to the four attributes of the Kano model. They identified the indicators with the most decisive effect on student satisfaction, including providing up-to-date material and incentives and the willingness of professors to accept criticism. However, none of these studies analysed the differences between the types of graduate programmes (master’s and doctorate) or evaluated continuing education programmes.
Methodology
Participants
Using the Kano model, a cross-sectional descriptive study was used to assess satisfaction with higher education. For this purpose, students who had matriculated at the Graduate School of Universidad Continental (UC) between July 2019 and August 2021 were selected as the sample framework. A single case study analysis was used because UC is one of the few universities in Peru that has systematically offered online education since 2010. Unlike most universities in Peru, UC had the technological infrastructure for a full virtual service once the COVID-19 outbreak began. Therefore, this university was chosen to analyse and evaluate the quality of service of these programmes because it had to make the fewest changes to provide online education services. Furthermore, UC was chosen because it has different campuses on the Central Coast (2 campuses), Central Highlands (1 campus) and South (2 campuses) of Peru and attracts students from different areas.
Two types of postgraduate programmes were evaluated, the first corresponding to the university’s two-year academic master's programme that contains four semesters of study because it is part-time. The other is a specialisation programme that lasts 4–6 months.
Three hundred twenty-six students participated in this study, of whom 22% are between 18 and 29 years old, 78% are over 30 and 61% are in specialisation programmes.
The survey was carried out online. To increase participation in the study, students were informed that a graduate school scholarship would be raffled off among those who completed the survey. The survey was anonymised to protect the identities of the students. Similarly, the study was approved and registered by the Vice-Chancellor of Research at UC.
Instruments
The attributes of service quality in higher education taken as a reference for classification through the Kano model methodology have been obtained from the HiEduQual instruments. These questionnaires were developed by Annamdevula and Bellamkonda (Citation2016) and Latif et al. (Citation2019) and are the most cited surveys on satisfaction, motivation, loyalty and online education services (Schijns, Citation2021). In addition, the reliability and validity of such instruments have also been shaped by studies such as Singh (Citation2016) and Justin et al. (Citation2019).
The first HiEduQual instrument (Annamdevula & Bellamkonda, Citation2016), which evaluates the quality of higher education services, was developed with a sample of students from seven public universities in India and has 23 items grouped into six dimensions: teaching, administrative services, academic facilities, campus infrastructure, support services and internationalisation. Additionally, this instrument has subscales that assess student motivation, loyalty and satisfaction. The dimensions of teaching, administrative services, academic facilities and internationalisation were used for the present study. The dimensions of campus infrastructure and support services of Annamdevula and Bellamkonda (Citation2016) were not included because the former is related to physical infrastructure, which could not be evaluated due to the COVID-19 epidemic. The latter considers services unavailable at the Graduate School of Continental University.
The second instrument (Latif et al., Citation2019), which assesses the quality of higher education services, was developed in Pakistan with a sample of three public and four private universities. This structural evaluation model is based on the relationships between service quality and student-perceived satisfaction, with a focus on higher education. This instrument comprises 37 items grouped into six dimensions: teacher quality, administrative services, knowledge services, activities, continuous improvement and leadership quality. These dimensions were supported by information collected through focus groups with stakeholders. The dimensions of continuous improvement and leadership quality were used for the present study. The dimensions of teacher quality, administrative services, knowledge services and activities from Latif et al. (Citation2019) were not included because the dimensions and respective attributes proposed by Annamdevula and Bellamkonda (Citation2016) were more comprehensive and suitable for the Graduate School of Continental University.
Finally, the dependent dimensions of satisfaction and loyalty were adapted from the study by Annamdevula and Bellamkonda (Citation2016).
The items from each of the service quality dimensions were translated and adapted to a Peruvian university and online educational environment. These items were validated by expert judges and were deemed suitable for the application. In line with the Kano model, each item was broken down into functional and dysfunctional aspects (Berger et al., Citation1993). The first item evaluated the response when the attribute was present, and the second evaluated the response in the absence of the attribute. The students responded to each pair of questions according to five alternatives: ‘1. I like it that way’, ‘2. I am expecting it to be that way’, ‘3. I am neutral’, ‘4. I can accept it to be that way’, ‘5. I dislike it that way’. presents an example of a pair of items for each dimension. Additionally, data on age, gender and type of programme (master’s degree, specialisation, continuing education certificate, or course) were collected.
Table 1. Examples of functional and dysfunctional items by dimension
Data analysis
The student’s perception of the offered graduate education was classified into six categories. In this study, following the study by Barrios-Ipenza et al. (Citation2021), an additional dimension to the original version of the model (Kano et al., Citation1984), termed questionable (Q), was considered to indicate that it was unclear whether the quality was as expected by the user. Based on this review, the responses of the interviewees were classified into attributes A: Attractive; O: One-dimensional; M: Must-be; I: Indifferent; R: Reverse; Q: Questionable, as presented in other studies, such as those conducted in Greece (Vassiliadis et al., Citation2014) and Indonesia (Dwi, Citation2012).
Therefore, in the attractive (A) category, attributes of delight are included, that is, attributes not expected by customers or students but which, if present, increase satisfaction. However, if they are not present, they do not produce dissatisfaction. Attributes in the one-dimensional category (O) produce satisfaction when they are present in services and dissatisfaction when not. These attributes are positively and linearly related to customer satisfaction, that is, the higher the degree of fulfilment of the attribute, the higher the degree of customer satisfaction and vice versa. The must-be dimension (M) contains the primary quality attributes of a product or service. If they are missing, the customer or student will be dissatisfied, but if they are present in the service, they do not produce satisfaction. The indifferent (I) category is for attributes that do not provide any value to the customer or student; that is, it is indifferent whether or not they are present in the service. Finally, the model also contemplates other categories that are difficult to occur in practice, or if they do occur, it is because the respondent has not understood the meaning of the functional and dysfunctional questions: these are the categories of reverse (R) and attributes of doubtful classification (questionable, Q).
Univariate descriptive analysis was performed in line with previous studies using the Kano model. For this purpose, the satisfaction level (SL) and dissatisfaction level (DL) coefficients were calculated, as outlined in , using the method proposed by Berger et al. (Citation1993).
Table 2. Calculation of satisfaction and dissatisfaction levels using the Kano model
These coefficients are used to find the average impact of the attributes evaluated by the student. In the SL, one-dimensional (unidimensional) and attractive attributes are added and divided by the total of attractive, must-be, one-dimensional and indifferent attributes. Calculating the DL requires adding the must-be and one-dimensional columns and dividing them by the same factor as in the case of satisfaction.
Maximum values range from 1 (SL) to −1 (DL). Therefore, SL indicates how much a student’s satisfaction level increases if an attribute ‘attractive’ or ‘one-dimensional’ is met. On the contrary, DL indicates how much customer satisfaction decreases if a ‘must be’ or ‘one-dimensional’ attribute is unmet.
Results
According to demographic data, this study included 326 students, of whom students aged 30–49 accounted for a high percentage (63%). Women represented 59% of the participants, 61% of the students matriculated in specialisation programmes (aimed at delving into a specific area of a professional field) and 39% of the students matriculated in masters ().
Table 3. Demographic data
Table 4. Results for the teaching dimension
Table 5. Results for the administrative services dimension
Table 6. Results for the academic facilities dimension
Table 7. Results for the continuous improvement dimension
The first stage of the data processing consisted of analysing the reliability of the range used in the instrument. Again, the Cronbach alpha indicator was used. The functional and dysfunctional questions were tested separately. The results of the Cronbach alpha indicator for the functional questions were 0.98, a value that indicates the excellent reliability of the scale. Similarly, the score for the dysfunctional questions was 0.99 (Materla et al., Citation2019).
In the following, the results are analysed according to the HiEduQual scale's dimensions, considering the Kano model's classification and the SL and DL scores found in this study.
Teaching
For the teaching (TE) dimension, the evaluation results of the attributes suggest that they are all one-dimensional. In other words, when attributes are present, they generate satisfaction; when attributes are absent, they generate dissatisfaction. For example, the more receptive and accessible teachers are, the greater the students’ satisfaction.
In most attributes, the degree of dissatisfaction was proportionally more notable than the degree of satisfaction. Consequently, the absence of an attribute caused greater dissatisfaction than the satisfaction resulting from its presence.
Attribute TE5, ‘Student performance is constantly evaluated’, has a higher degree of satisfaction proportionally than the degree of dissatisfaction and is close to being an attractive attribute ( and ).
Figure 3. Classification of attributes of the teaching dimension.
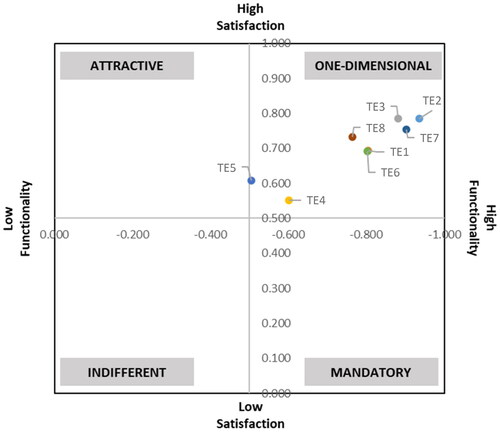
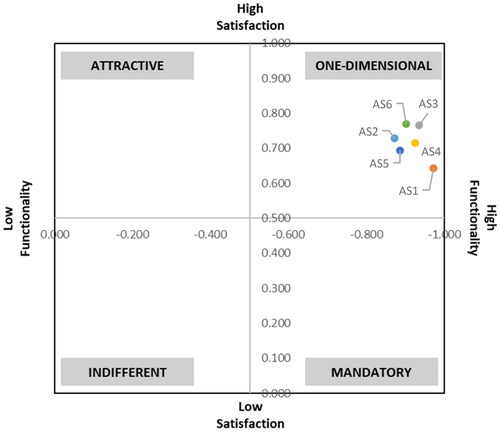
Figure 4. Classification of attributes of the administrative services dimension.
Administrative services
As in the teaching dimension, the results for the administrative services (AS) dimension indicate that all attributes are one-dimensional. In this dimension, the satisfaction and dissatisfaction levels are more homogeneous; and the coefficient of dissatisfaction is always proportionally higher than the coefficient of satisfaction.
The AS1 attribute, ‘The administrative staff provides error-free work’, stands out since it tends to fall closer to the quadrant of must-be attributes. Moreover, the AS1 attribute exhibits a higher degree of dissatisfaction proportionally than the degree of satisfaction ( and ).
Academic facilities
The attributes of the dimension of academic facilities (AF) are also one-dimensional. Similarly, considering the levels of satisfaction and dissatisfaction, they are all distributed homogeneously; and the coefficients of dissatisfaction are proportionally higher than the coefficients of satisfaction, that is, non-compliance with these attributes causes greater dissatisfaction than the satisfaction generated by their fulfilment. The IA7 attribute stands out, as its non-compliance generates a higher degree of dissatisfaction than the satisfaction caused by its fulfilment ( and ).
Figure 5. Classification of attributes of the academic facilities dimension.
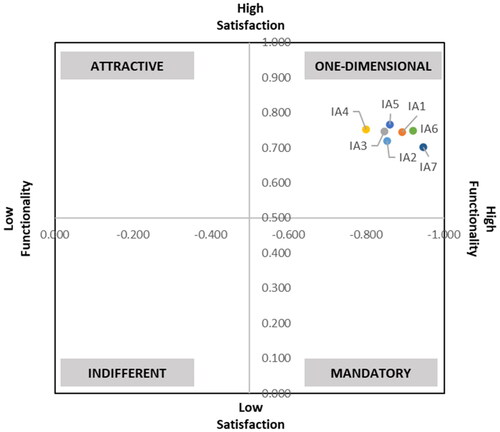
Figure 6. Classification of attributes of the continuous improvement dimension.
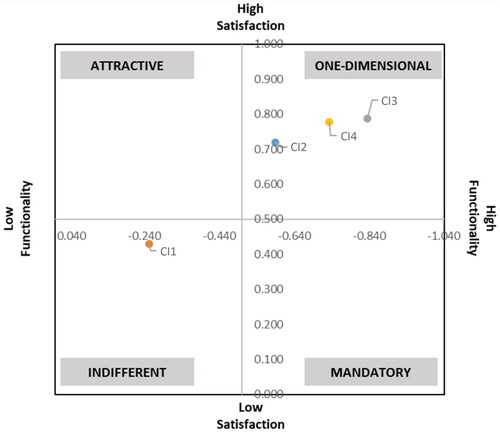
Continuous improvement
Evaluating attributes in the continuous improvement (CI) dimension highlights various points. For example, the attribute CI1, ‘The number of students seeking admission continues to increase’, is indifferent to matriculated students; the increase or lack of an increase in students seeking admission generates neither satisfaction nor dissatisfaction.
The coefficients of satisfaction with the attributes CI2, ‘The university infrastructure continues to improve’, and CI4, ‘University ranking and research performance’, continue to improve and are proportionally higher than those of dissatisfaction, which means that the presence of the attributes causes greater satisfaction than the dissatisfaction with their absence.
The coefficients of satisfaction and dissatisfaction with the attribute CI3, ‘My conceptual and technical skills continue to improve throughout my stay at the university’, had similar values ( and ).
Leadership
The attributes of the leadership (LD) dimension are one-dimensional. Satisfaction and dissatisfaction levels vary homogeneously; and the level of dissatisfaction is always proportionally higher than the level of satisfaction ( and ).
Figure 7. Classification of attributes of the leadership dimension.
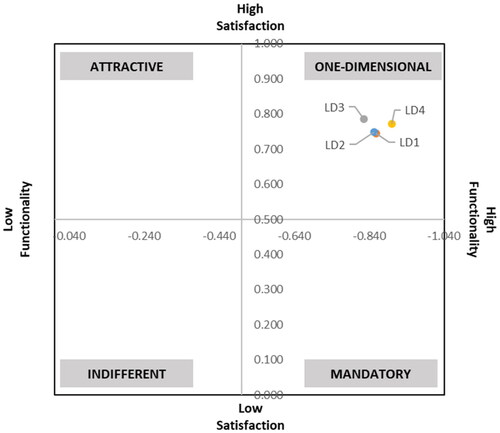
Figure 8. Classification of attributes of the internationalisation dimension.
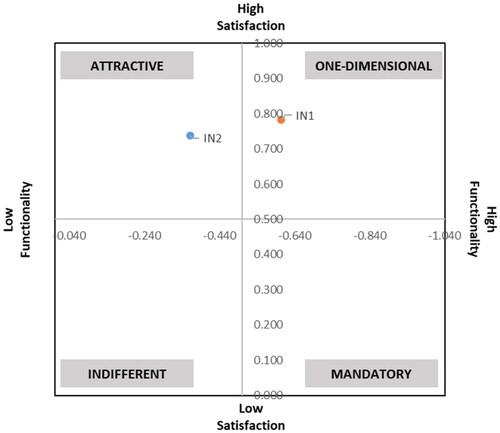
Table 8. Results for the leadership dimension
Internationalisation
Evaluation of attributes of the dimension of internationalisation (IN) shows that the attribute IN1, ‘The university promotes international activities’, is one-dimensional. On the contrary, the attribute IN2, ‘The university has teachers from abroad’, is attractive, which means that its fulfilment causes satisfaction, but its non-compliance does not cause student dissatisfaction.
IN1 is evaluated as a one-dimensional attribute. However, its satisfaction and dissatisfaction coefficients place this attribute close to the quadrant of attractive attributes; its presence proportionally generates greater satisfaction than its absence ( and ).
Table 9. Results for the internationalisation dimension
Analysis of results by type of programme
The results of attributes by type of programme were subjected to a comparative analysis. For this purpose, they were clustered into master and specialisation programmes.
The results of all attributes were similar in both groups and all dimensions; that is, (1) most attributes were considered one-dimensional; (2) the attribute CI1, ‘The number of students seeking admission continues to increase’, was classified as indifferent in both groups; (3) the attribute IN2, ‘The university has teachers from abroad’, was evaluated as attractive in both groups.
However, differences in the levels of satisfaction and dissatisfaction with the dimensions under study were found in each group, particularly for the attribute TE5, ‘Student performance is continuously evaluated,’ which was an attractive attribute in the group of specialisation programmes.
The most notable difference between the attributes of both groups was that of the 31 attributes evaluated in all dimensions, dissatisfaction with 23 attributes in the master group was proportionally higher than the level of satisfaction. In the group of specialisation programmes, the level of satisfaction with 24 attributes was higher than the level of dissatisfaction.
Conclusion
This study validates the usefulness of the Kano model quality assessment for graduate education. The questionnaire showed high reliability in both its functional and dysfunctional modalities. Moreover, these results are relevant since the Kano model has rarely been applied to higher education and not to graduate education. These results validate the theoretical proposal of Kano (1984) that satisfaction and dissatisfaction are not unipolar constructs and that some service characteristics have a more substantial impact on customer satisfaction or dissatisfaction (Barrios-Ipenza et al., Citation2021; Jin et al., Citation2019; Nilsson‐Witell & Fundin, Citation2005).
Furthermore, these findings suggest that the dimension associated with internationalisation, proposed by Annamdevula and Bellamkonda (Citation2016), is related to the satisfaction of graduate students, particularly in a globalised context (Valencia et al., Citation2015). Although university infrastructure has been considered an essential aspect of university quality (Annamdevula & Bellamkonda, Citation2016; Sukwadi et al., Citation2012; Terzakis et al., Citation2012), it was identified as the attribute with the most substantial impact on dissatisfaction in a previous study (Sahney, Citation2011), in contrast to the findings reported.
On the other hand, the attributes that had the most decisive impact on student dissatisfaction were the performance of the administrative staff, the proper maintenance of the university platform, accurate administrative records, the availability of administrative staff during office hours and a suitable university platform. In previous research using the Kano model in higher education, none of these attributes was identified as particularly relevant to dissatisfaction. However, various studies have highlighted the role of administrative services in education quality (Annamdevula & Bellamkonda, Citation2016; Keržič et al., Citation2021; La Rotta et al., Citation2020) while Al-Fraihat et al. (Citation2020) report that the quality of technical and support systems are relevant measures to identify factors of educational success.
Although no previous study has evaluated differences in the graduate programme, Karadag et al. (Citation2021) found that university students with adequate distance education capacity were more satisfied than students of younger grades. This research indicates that the amount of exposure to studies influences not only the student but also the programme's characteristics, which determine the level of satisfaction or dissatisfaction.
These results have significant implications for university management by identifying the attributes that have the most decisive impact on student satisfaction and dissatisfaction; this could help to propose innovative steps to improve the university experience. In the context of COVID-19, the accelerated adaptation to an online format was a significant barrier to adequately implementing this approach. However, e-learning or blended learning can facilitate multiple forms of content presentation, which presents an opportunity to develop the multimodal approach (Skulmowski & Rey, Citation2020).
In conclusion, the Kano model is valid and valuable for assessing satisfaction in graduate education and can be integrated with various instruments to evaluate educational quality. For the teaching dimension, administrative services, academic facilities and leadership are considered one-dimensional. For the continuous improvement dimension, the attributes of enrolment increase are indifferent. For the internationalisation dimension, the attribute of foreign professors is attractive; this latter dimension has the most significant impact on the perception of quality. Finally, these findings suggest that the dimension associated with internationalisation, raised by Annamdevula and Bellamkonda (Citation2016), plays a vital role in graduate student satisfaction, particularly in a globalised context (Valencia et al., Citation2015).
A limitation of this study is that the sample considers only one university. The study was carried out only using cross-sectional data; the selected sample was based on convenience or not on a criterion of representativeness of the universe of graduate students. Finally, for future research, there is still a gap in the scientific literature on the factors that explain perceived satisfaction and quality of online educational services, especially in postgraduate studies.
Acknowledgments
The Universidad Continental supported this work under a special grant and with support from the Vice Rectorate of Research.
Disclosure statement
No potential conflict of interest was reported by the author(s).
References
- Al-Fraihat, D., Joy, M., Masa’deh, R. & Sinclair, J., 2020, ‘Evaluating E-learning systems success: an empirical study’, Computers in Human Behavior, 102, pp. 67–86.
- Álvarez, S.M., Maldonado-Maldonado, A., Gacel-Ávila, J. & Marmolejo, F., 2020, ‘Impacto del COVID-19 en la educación superior en México’, Revista de Educación Superior en América Latina, 9, pp. 9–14.
- Annamdevula, S. & Bellamkonda, R.S., 2016, ‘Effect of student perceived service quality on student satisfaction, loyalty and motivation in Indian universities: development of HiEduQual’, Journal of Modelling in Management, 11(2), pp. 488–517.
- Arefi, M., Heidari, M., Morkani, G.S. & Zandi, K., 2012, ‘Application of Kano model in higher education quality improvement: study master’s degree program of educational psychology in State Universities of Tehran’, World Applied Sciences Journal, 17(3), pp. 347–53.
- Barrios-Ipenza, F., Calvo-Mora, A., Criado-García, F. & Curioso, W.H., 2021, ‘Quality evaluation of health services using the Kano model in two hospitals in Peru’, International Journal of Environmental Research and Public Health, 18(11), pp. 6159–75.
- Berger, C., Blauth, R.E. & Boger, D., 1993, ‘Kano’s methods for understanding customer-defined quality’, Center for Quality Management Journal, 2(4), pp. 2–37.
- Dicker, R., Garcia, M., Kelly, A. & Mulrooney, H., 2019, ‘What does ‘quality’ in higher education mean? Perceptions of staff, students and employers’, Studies in Higher Education, 44(8), pp. 1425–41.
- Dwi, S., 2012, ‘Integrating Kano’s Model and SERVQUAL to improve healthcare service quality’, Global Public Health, pp. 132–46.
- Ghobadian, A., Speller, S. & Jones, M.A., 1994, ‘Service quality: concepts and models’, International Journal of Quality Management, 11, pp. 43–66.
- Ginns, P., Prosser, M. & Barrie, S., 2007, ‘Students’ perceptions of teaching quality in higher education: the perspective of currently enrolled students’, Studies in Higher Education, 32(5), pp. 603–15.
- Gouthier, M., Giese, A. & Bartl, C., 2012, ‘Service excellence models: a critical discussion and comparison’, Managing Service Quality: An International Journal, 22(5), pp. 447–64.
- Gregory, A. & Parsa, H.G., 2012, ‘Kano’s model: an integrative review of theory and applications to the field of hospitality and tourism’, Faculty Scholarship and Creative Works, 22(1), pp. 25–46
- Gruber, T., Reppel, A. & Voss, R., 2010, ‘Understanding the characteristics of effective professors: the student’s perspective’, Journal of Marketing for Higher Education, 20(2), pp. 175–190.
- Jin, Y., Park, Y. & Yu, J., 2019, ‘An assessment model for evaluating asymmetric effects of attribute-level performance on satisfaction’, Sustainability, 11(16), pp. 4323–44.
- Johnston, R., 2004, ‘Towards a better understanding of service excellence’, Managing Service Quality, 14(2), pp. 129–33.
- Justin, L.D., Jin, S. & Hubert, V., 2019, ‘Effect of international students’ perceived service quality on the student’s motivation, satisfaction, loyalty, and institutional image in higher education in China’ International Journal of Science and Business, 3(2), pp. 110–25.
- Kano, N., Seraku, N., Takahashi, F. & Tsuji, S., 1984, ‘Attractive quality and must-be quality’, Journal of the Japanese Society for Quality Control, 14(2), pp. 39–48.
- Karadag, E., Su, A. & Ergin-Kocaturk, H., 2021, ‘Multi-level analyses of distance education capacity, faculty members’ adaptation, and indicators of student satisfaction in higher education during COVID-19 pandemic’, International Journal of Educational Technology in Higher Education, 18(1), pp. 57–75.
- Keržič, D., Alex, J.K., Alvarado, R.P.B., da Silva Bezerra, D., Cheraghi, M., Dobrowolska, B., Fagbamigbe, A.F., Faris, M.E., França, T., González-Fernández, B., Gonzalez-Robledo, L.M., Inasius, F., Kar, S.K., Lazányi, K., Lazăr, F., Machin-Mastromatteo, J.D., Marôco, J., Marques, B.P., Mejía-Rodríguez, O., Méndez Prado, S.M., Mishra, A., Mollica, C., Navarro Jiménez, S.G, Obadić, A., Raccanello, D., Rashid, M.M.U., Ravšelj, D., Tomaževič, N., Uleanya, C., Umek, L., Vicentini, G., Yorulmaz, Ö., Zamfir A-M., Aristovnik, A., 2021, ‘Academic student satisfaction and perceived performance in the e-learning environment during the COVID-19 pandemic: evidence across ten countries’, PLoS ONE, 16(10), np, e0258807.
- Kiran, D.R., 2017, ‘Chapter 30: Quality Function Deployment’, in Kiran, D.R. (Ed.), 2017, Total Quality Management, pp. 425–37 (Oxford, Butterworth-Heinemann).
- Kuo N.-T, Chang, K-C., Lai, C-H., 2011, ‘Identifying critical service quality attributes for higher education in hospitality and tourism: applications of the Kano model and importance-performance analysis (IPA)’, African Journal of Business Management, 5(30), pp. 12016–24.
- La Rotta, D., Usuga, O.C. & Clavijo, V., 2020, ‘Perceived service quality factors in online higher education’, Learning Environments Research, 23(2), pp. 251–67.
- Latif, K.F., Latif, I., Farooq Sahibzada, U. & Ullah, M., 2019, ‘In search of quality: measuring higher education service quality (HiEduQual)’, Total Quality Management and Business Excellence, 30(7), pp. 768–91.
- Madzík, P. & Pelantová, V., 2018, ‘Validation of product quality through graphical interpretation of the Kano model: an explorative study’, International Journal of Quality & Reliability Management, 35(9), pp. 1956–75.
- Materla, T., Cudney, E.A. & Antony, J., 2019, ‘The application of Kano model in the healthcare industry: a systematic literature review’, Total Quality Management & Business Excellence, 30(5–6), pp. 660–81.
- Materla, T., Cudney, E.A. & Hopen, D., 2019, ‘Evaluating factors affecting patient satisfaction using the Kano model’, International Journal of Health Care Quality Assurance, 32(1), pp. 137–51.
- Matzler, K. & Hinterhuber, H.H., 1998, ‘How to make product development projects more successful by integrating Kano’s model of customer satisfaction into quality function deployment’, Technovation, 18(1), pp. 25–38.
- Nilsson‐Witell, L. & Fundin, A., 2005, ‘Dynamics of service attributes: a test of Kano’s theory of attractive quality’, International Journal of Service Industry Management, 16(2), pp. 152–68.
- Ömürgönülflen, M. & Eryi, C., 2020, ‘Enhancing the quality of a higher education course: quality function deployment and Kano model integration’, Yuksekogretim Dergisi, 10(3), pp. 1–16.
- Organización de Estados Iberoamericanos para la Educación, la Ciencia y la Cultura (OEI), 2021, ‘Guía Iberoamericana de Evaluación de la Calidad de la Educación a Distancia’, Informes OEI. Available at: https://oei.int/oficinas/secretaria-general/publicaciones/guia-iberoamericana-de-evaluacion-de-la-calidad-educacion-a-distancia (accessed 28 February 2024).
- Pandey, A., Sahu, R. & Joshi, Y., 2020, ‘Kano model application in the tourism industry: a systematic literature review’, Journal of Quality Assurance in Hospitality & Tourism, 23(1), pp. 1–31.
- Parasuraman, A.P., Zeithaml, V. & Berry, L., 1988, ‘SERVQUAL: A multiple item scale for measuring consumer perceptions of service quality’, Journal of Retailing, 64(1), pp. 12–40.
- Piñero, M., Esteban Rivera, E., Cotrina, A. & Becerra, S., 2021, ‘Tendencias y desafíos de los programas de posgrado latinoamericanos en contextos de COVID-19’, Revista Venezolana de Gerencia, 26, pp. 123–38.
- Rezaie, M., Nosratabadi, H.E. & Fazlollahtabar, H., 2012, ‘Applying Kano model for users’ satisfaction assessment in e-learning systems: a case study in Iran virtual higher educational systems’, International Journal of Information and Communication Technology Education, 8(3), pp. 1–12.
- Rodman, K., Biloslavo, R. & Bratož, S., 2013, ‘Institutional quality of a higher education institution from the perspective of employers’, Minerva, 51(3), pp. 71–92.
- Rust, R. & Oliver, R., 2000, ‘Should we delight the customer?’, Journal of the Academy of Marketing Science, 28, pp. 86–94.
- Sahney, S., 2011, ‘Delighting customers of management education in India: a student perspective, part II’, TQM Journal, 23(5), pp. 531–48.
- Sáinz, J. & Barberá, R., 2020, ‘Diagnóstico de la educación superior en Iberoamérica 2019’, Organización de Estados Iberoamericanos para la Educación, la Ciencia y la Cultura, June 2020.
- Sauerwein, E., Bailom, F., Matzler, K. & Hinterhuber, H., 1996, ‘The Kano model: how to delight your customers’, International Working Seminar on Production Economics, 1(4), pp. 313–27.
- Schijns, J.M., 2021, ‘Measuring service quality at an online university: using PLS-SEM with archival data’ Tertiary Education and Management, 27(2), pp. 161–85.
- Schneider, B. & Bowen, D., 1999, ‘Understanding customer delight and outrage’. MIT Sloan Management Review, 15 October 1999.
- Shahin, A. & Zairi, M., 2009, ‘Kano model: a dynamic approach for classifying and prioritising requirements of airline travellers with three case studies on international airlines’, Total Quality Management & Business Excellence, 20(9), pp. 1003–28.
- Singh, B.S., 2016, ‘Using HiEduQual to assess student satisfaction in selected higher educational institutions in North India’ International Research in Education, 4(1), pp. 67–85.
- Skulmowski, A. & Rey, G., 2020, ‘COVID-19 as an accelerator for digitalisation at a German university: establishing hybrid campuses in times of crisis’, Human Behavior and Emerging Technologies, 2(3), pp. 212–16.
- Stanković, J., Medvecki, D., Rakić, S., Ćurčić, J. & Gračanin, D., 2018, ‘How to create attractive customer experience: implementation of Kano’s theory in higher education’, paper presented at the 8th International Conference on Mass Customization and Personalization—Community of Europe, Novi Sad, Serbia, 19–21 September.
- Sukwadi, R., Yang, C.-C. & Fan, L., 2012, ‘Determining the priority of critical service attributes: an integrated model and an empirical case study in the higher education sector’, Service Science, 4(4), pp. 308–19.
- Szeliga-Duchnowska, A. & Szewczyk, M., 2018, ‘An assessment of the quality attributes of an educational service as seen from the perspective of loyal and disloyal students of institutions of higher education’, Zeszyty Naukowe Politechniki Poznańskiej. Organizacja i Zarządzanie, 78(2), pp. 213–30.
- Terzakis, D., Zisis, P.V., Garefalakis, A.E. & Arvanitis, S.E., 2012, ‘Translating the service quality gaps into strategy formulation. An experimental case study of a Greek Academic Department’, European Research Studies Journal, 15(1), pp. 99–125.
- Tontini, G., 2007, ‘Integrating the Kano model and QFD for designing new products’, Total Quality Management & Business Excellence, 18(6), pp. 599–612.
- Tontini, G. & Picolo, J.D., 2014, ‘Identifying the impact of incremental innovations on customer satisfaction using a fusion method between importance-performance analysis and Kano model’, International Journal of Quality and Reliability Management, 31(1), pp. 32–52.
- Um, K.-H., Fang, Y. & Seo, Y.-J., 2021, ‘The ramifications of COVID-19 in education: beyond the extension of the Kano model and unipolar view of satisfaction and dissatisfaction in the field of blended learning’, Educational Measurement: Issues and Practice, 40(3), pp. 96–109.
- Valencia, L.E.P., Ferrer, J.M., Cano, A.S.G. & Gómez, W., de J.A., 2015, ‘Tendencias de la educación superior’, Páginas: Revista académica e institucional de la UCPR, 97, pp. 133–63.
- Vassiliadis, C.A., Fotiadis, A.K. & Tavlaridou, E., 2014, ‘The effect of creating new secondary health services on patients’ perceptions: a Kano service quality analysis approach’, Total Quality Management & Business Excellence, 25(8), pp. 897–907.
- Willis, T.H. & Taylor, A.J., 1999, ‘Total quality management and higher education: the employers' perspective’, Total Quality Management, 10(7), pp. 997–1007.
- Witell, L. & Löfgren, M. 2007, ‘Classification of quality attributes’, Managing Service Quality, 17(1), pp. 54–73.
- Xu, Q., Jiao, R.J., Yang, X., Helander, M., Khalid, H.M. & Opperud, A., 2009, ‘An analytical Kano model for customer need analysis’, Design Studies, 30(1), pp. 87–110.
- Yang, C., Sukwadi, R. & Mu, P.-P., 2010, ‘Integrating Kano model into customer-oriented reputation model in higher education’ paper presented at 2010 International Conference on Management and Service Science, South Selawasi, Indonesia, 10–15 June.
- Zhang, P. & Von Dran, G.M., 2001, ‘User expectations and rankings of quality factors in different Web site domains’ International Journal of Electronic Commerce, 6(2), pp. 9–33.