
 ?Mathematical formulae have been encoded as MathML and are displayed in this HTML version using MathJax in order to improve their display. Uncheck the box to turn MathJax off. This feature requires Javascript. Click on a formula to zoom.
ABSTRACT
This paper studies the impact of relative endowments of skilled labour and physical capital on the location choices of multinational firms (MNEs). We demonstrate potential methodological issues and possible solutions related to the identification of vertical MNE activity when using aggregate country-level data. To support our analysis, we introduce data matching and various assumptions with respect to the degree of profit shifting activities of MNEs that we apply to study unilateral inward foreign direct investment (FDI) across Estonia, Latvia, and Lithuania. Our choice of data is motivated by various legislation gaps, taxation specificities, and growing equity stocks in sectors related to profit shifting in the aforementioned economies. Ultimately, we highlight the importance of international tax differences and the growing discrepancy between real and reported cross-country FDI data.
JEL:
1. Introduction
Multinational firms (MNEs) are arguably the most important actors in the world economy. Their role is usually connected with fragmented production networks that take advantage of the availability (and costs) of production factors across multiple destinations (Antràs & Helpman, Citation2004; Antràs et al., Citation2017). Yet, MNEs are also frequently associated with aggressive tax planning and profit shifting because of their ability to transfer equity, profits, or liabilities across jurisdictions using intra-firm transactions, intangible property, and price manipulation (Cristea & Nguyen, Citation2016; Davies et al., Citation2018; Vicard, Citation2015).
Canonical models of cross-country MNEs’ location choices generally follow a very distinct differentiation between motives of multinational activity in a host economy, e.g. horizontal or vertical (Bergstrand & Egger, Citation2007, Citation2013; Markusen, Citation2002), where vertical specialization of a given firm is driven by the existence of significant differences between the relative factor endowments of skilled labour and (or) physical capital in the presence of low barriers to trade. However, MNEs may locate themselves in destinations, where tax planning opportunities can be combined with the relative abundance of skilled labour. For example, destinations such as Hong Kong SAR, Luxembourg, the Netherlands, and othersFootnote1, where foreign direct investment (FDI) is frequently used to perform tax optimization of MNEs, feature identical levels of skilled labour in comparison to real investing economies such as the United States, Japan, or France (see Figures A1, A2 of Appendix). As a result, the identification of vertical MNE activity via country-level data on incoming foreign equity may pose an empirical puzzle.
This paper studies how the relative levels of skilled labour and physical capital can be used to identify factor cost advantages in a setting, where MNEs have an additional motive to engage in FDI. To this end, we develop the seminal idea of Bergstrand and Egger (Citation2007, Citation2013) of using levels of physical capital to identify vertical MNE activity. In particular, we introduce assumptions that reflect the recent findings of the literature with respect to role transfer pricing, which we consider to be an extra motive for FDI activity. For example, MNEs can use the FDI channel to perform various accounting schemes to re-allocate equity, earnings, or liabilities off their balance sheets and implement tax planning using intra-group services or intangible property using shell companies known as Special Purpose Entities (SPEs). Since SPEs are usually located in offshore destinations, they present enhanced confidentiality as disclosure requirements for such entities are frequently low even in large firm databases such as Orbis. Recent empirical evidence associates large-scale activities of SPE-associated FDI with exactly the destinations endowed with skilled labour such as Luxembourg, the Netherlands, Hong Kong SAR, and others (Damgaard et al., Citation2019). Further, we demonstrate how similar levels of skilled labour can lead to biased or inconsistent inference when canonical assumptions about the distribution of cross-country factor endowments are brought to real-world data. To support the derived methodological propositions, we use panel data for the Baltic economies of Estonia, Latvia, and Lithuania from 2009 to 2019.
Our choice of data is motivated by the following facts. First, although the Baltics have introduced and implemented the arm’s-length principleFootnote2 to their domestic tax legislation, only Lithuania has recently (i.e. in 2020) extended its provisions to cover investments in intra-group services and transactions involving intangible property (OECD, Citation2021). Second, capital taxation has been well below the European average of 8% GDP across the Baltic economies and has never exceeded more than 4% in the past decade. Moreover, the share of capital taxation within the overall tax income across all three economies has been the lowest among the European Union (EU) members (European Commission, Citation2021). Third, the Baltics see relatively large FDI equity stocks located in the financial and insurance sectors, which are often associated with the profit shifting of multinationals (Damgaard et al., Citation2019). Lastly, firms with residence in the Baltics maintain abnormally large FDI equity levels in each other. For example, Estonian firms have one of the largest FDI equity levels in Latvia and Lithuania. In both cases, firms registered in Estonia own more equity than firms from Germany (2019 data): $2.41 bln vs $1.14 bln (Latvia), and $3.09 bln vs $1.54 bln (Lithuania). On the other hand, the existing firm-level studies of Masso et al. (Citation2008), Roolaht and Varblane (Citation2009), and Varblane et al. (Citation2019) document large volumes of genuine FDI activity of Estonian firms in the Baltic region, which leads to us to believe that at least some of the reported incoming FDI has to be genuine.Footnote3 Hence, in our opinion, data on inward FDI from the Baltic economies present an excellent opportunity to study the identification of vertical FDI under the constraint of imperfect data.
This study is related to the following strands of the literature. The first is the literature on general cross-country activity of multinational firms and includes, among others, the seminal models of Markusen and Venables (Citation2000), Markusen (Citation2002), Bergstrand and Egger (Citation2007, Citation2013), who show that relative factor cost advantages and market size characteristics can be used to differentiate between horizontal and vertical motives for MNE activity. In contrast, we show that there is often a third motive for FDI, namely transnational profit shifting performed via affiliates in destinations seemingly abundant with skilled labour. The presented analysis demonstrates how relative levels of physical capital can be used as a powerful tool for the identification of vertical MNE activity even in the presence of offshore destinations. This is mainly applicable to cases, where economists study FDI determinants in country-level samples that feature modest differences in relative human capital endowments (e.g. small open economies acting as equity recipients or investors).
Further, our paper links the theoretical literature with the existing cross-country empirical studies of Carr et al. (Citation2001), Braconier et al. (Citation2005), Waldkirch (Citation2011), Ledyaeva et al. (Citation2013), Damgaard et al. (Citation2019), Cieślik (Citation2020) and others. In particular, we follow Waldkirch (Citation2011) and Ledyaeva et al. (Citation2013), who study vertical MNE activity in Mexico and Russia through FDI equity stock data at various levels of disaggregation. Our methodological findings in Section 2 help explain the reason why the use of skilled labour difference to identify vertical MNE activity can lead to inconsistent estimates in cases, where such difference was employed together with FDI data from economies prone to tax avoidance opportunities.
Lastly, the paper is also related to empirical studies of MNE activity in the context of Baltic economies of Vahter (Citation2004), Titarenko (Citation2006), Vahter (Citation2011), Masso et al. (Citation2013), Brock (Citation2018), Cieślik and Gurshev (Citation2021), and others. Our contribution to this strand is the analysis of just how much the relative presence of offshore destinations in the sample impacts the canonical determinants of vertical FDI (human and physical capital differences) based on the Baltic data. We accomplish this by using extensive data matching across multiple data sources and further robustness analysis of possible assumptions in regards to possible presence of offshore equity.
The rest of the paper is organized as follows. Section 2 describes theoretical framework, methodological issues, data description, and econometric approach. Section 3 discusses empirical results. Section 4 summarizes and includes implications for further research.
2. Theoretical framework, statistical data, and empirical methodology
2.1. Theoretical framework
As a point of reference, this paper adopts the modern theory of cross-country MNEs’ location choices developed by Markusen (Citation2002), and Bergstrand and Egger (Citation2007, Citation2013). In particular, the theoretical analysis is based on three countries: Home , Foreign
, and Rest-of-the World
; three factors of production: unskilled labour
, skilled labour
, and physical capital
; and two goods: homogeneous and differentiated. The rationale behind having
as an additional country helps in endogenizing international trade between
and
as the activity of horizontal multinational firms does not displace national producers and bilateral trade. The model allows joint market size, and endowments of
, and
to determine the location of MNEs and generate national exporters (NEs), and both horizontal (H-MNEs) and vertical (V-MNEs) multinational firms in the equilibrium (Bergstrand & Egger, Citation2013). All factors are internationally immobile, and used in the production of the differentiated good, with skilled labour and physical capital being complements in production. Headquarters of firms can be set up with the sole use of skilled labour, while the establishment of plants requires physical capital.
The distribution of three types of firms between countries is driven by endowment characteristics and relative market sizes of ,
and
: NEs arise in equilibrium if one of the countries is relatively larger than the other and trade costs are low, which encourages domestic production and exports. H-MNEs gain salience once both
and
are similar in size and factor endowments, while trade barriers and shipment costs are high. On the opposite, when countries have different relative factor endowments and trade costs are low, firms prefer to specialize vertically and leverage cost variation between
and
across
,
and
. In particular, Bergstrand and Egger (Citation2013) present simulations where V-MNEs are prominent in all cases where skilled labour is slightly more abundant and physical capital is scarce in a pair of countries. In other words, if
and
feature close levels of skilled labour, it is possible to use physical capital to identify vertical MNE activity as long as levels of physical capital are significantly different across partners.
To account for the profit shifting mode of FDI, we modify the initially stated theoretical model of MNE’s location choice. In particular, we assume that there are the following three countries: Home , Foreign
, and Offshore
. The distribution of endowments is such that all three countries feature similar levels of skilled labour
, yet exhibit market size and physical capital stock differences:
, and
. Such a set of assumptions is motivated by the real-world data as offshores often feature relatively close levels of skilled labour in comparison to real investing partners, but significantly differ in physical capital levels. Figures A1, A2, A3, and A4 (in Appendix) illustrate the distribution of human and physical capital between offshore and real investor destinations based on the Penn World Table 10.0 (PWT) database (Feenstra et al., Citation2015). The caveat to this line of reasoning is in the particular selection of host countries (Central and Eastern Europe). Granted, there are still large development gaps in terms of skill across Africa, Middle East, and Asia that would not fit the above assumptions. Next, we treat FDI originating from MNEs located in
as SPE-FDI that does not have any real economic impact, while FDI originating from
is real and feasible investment. To demonstrate this point, we introduce extensive data-matching across various data sources in Section 3 and perform counterfactual estimations in Section 4.
Given such a set of assumptions, the use of skilled labour difference to identify vertical MNE activity can lead to biased or inconsistent estimates, which is demonstrated in Proposition 2.1. Potential methodological implications of Proposition 2.1 are especially severe in cases, where empirical studies rely on skilled labour differences together with FDI stock data in economies prone to tax avoidance opportunities and have offshore destinations present in the sample. For example, Waldkirch (Citation2011) uses such a measure to determine vertical MNE activity in Mexico whilst employing FDI data from Hong Kong SAR, the Netherlands, Panama, and Singapore. Subsequently, Ledyaeva et al. (Citation2013) studied the link between inward FDI and money laundering in Russia using FDI stock data and a similar cross-country model from Carr et al. (Citation2001). The analysis of the latter study relies on the following critical assumptions: (a) that SPE-FDI originates only from Cyprus, and the British Virgin Islands and (b) include destinations such as the Netherlands, or Luxembourg as potential real partners, indicating that ‘a large portion of foreign investment from these countries might have a real foreign origin’ (Ledyaeva et al., Citation2013, p. 5). Both of the aforementioned papers obtain theoretically inconsistent and/or insignificant estimates of the skilled labour variable and/ or connected interaction terms.
To remedy this, we show in Proposition 2.2 how physical capital can be used to identify vertical MNE activity based on factor cost advantages even in the presence of offshore destinations as initially proposed in Bergstrand and Egger (Citation2007, Citation2013).
Proposition 2.1:
Relative endowment of skilled labour is either: (i) biased or (ii) insignificant determinant of vertical MNE activity whenever the observed levels of skilled labour are identical (or very similar) across real and offshore partners.
As most of SPE-FDI comes from destinations such as Luxembourg, Hong Kong SAR, or Singapore, which are highly endowed with skilled labour and feature relatively small populated markets. The resulting combination of a high concentration of skilled labour together with inflated levels of FDI causes skilled labour difference to be biased or insignificant explanatory variables.
Proof:
Part (i) Assume that Home (), Foreign (
), and Offshore (
) have the following levels of skilled labour (
) and market size (
):
,
, and that inward FDI from Foreign and Offshore to Home is such that
holds, and the Home ratio of
being fixed. It is immediate that Offshore has a higher concentration of
than Foreign, i.e.
. When taking absolute differences, we obtain:
which implies that higher levels of skilled labour concentration in Offshore will be associated with inflated levels of SPE-FDI in Home and generate vertical motive associated with the relative cost advantage in Home vs. Offshore.
Part (ii) If Home (), Foreign (
), and Offshore (
) have the following levels of skilled labour (
):
, and FDI of Foreign and Offshore in Home is such that
holds, it is immediate that
. Which implies a non-significant impact of skilled labour difference on inward FDI in Home from either Foreign and Offshore.
Part (iii) The equality condition between and
in parts (i) and (ii) can be relaxed in all cases where it is possible to show that
with
assumed to be sufficiently small. ▪
Proposition 2.2:
Relative physical capital cost advantage is a robust determinant of vertical multinational activity if and only if the differences in physical capital endowments are sufficiently large across real and offshore partners.
Since SPE-FDI essentially ‘transits’ between destinations, it has no impact on the real stock of physical capital in a host economy. Hence, typical offshore jurisdictions never feature large stocks of foreign equity capital (see Figure A3 in Appendix). As a result, the relative cost advantage of physical capital will be associated with the investment activity of real firms residing in legitimate economies, and we should observe little variation in the estimated parameter of physical capital difference in the presence of SPE-FDI.
Proof:
If Home (), Foreign (
), and Offshore (O) have the following levels of physical capital (
) and labour (
) endowments:
,
, and FDI levels of Foreign and Offshore in Home is such as:
holds, with Home ratio of
fixed at some level, it is immediate that Foreign has a higher concentration of
than Offshore or
, and taking the absolute differences yields:
In such a case, inflated levels of SPE-FDI are no longer associated with the high levels of factor cost advantages, which implies that physical capital can identify the vertical investment motive between Home and Foreign in the presence of Offshore. ▪
The applicability of Propositions 2.1 and 2.2 relies on the assumption that FDI stocks from Offshore dominate over Foreign in a given partner sample such that inequality holds. If this assumption is not met, the identification of vertical MNE activity via skilled labour can be permissible and will yield an unbiased result. Furthermore, we expect that the mechanism demonstrated in part (i) of Proposition 2.1 will produce sharp results in samples, where FDI from Offshore is such that
. This can be observed in cases, where destinations such as Cyprus feature inflated FDI stocks in an exposed economy such as Russia.Footnote4
The existing literature so far has not considered the Baltics as a potential place, where potential profit shifting or round-tripping may exist. Yet, as previously discussed in Section 1 the past decade has seen a significant increase in FDI equity located in the financial and insurance sectors of the Baltics coupled with the fact that domestic legislative frameworks on arm’s length in regards to intra-group services and intangible property were not established up until 2020. As well as the fact that Baltic economies feature the lowest corporate income tax collection volumes across the EU, our analysis assumes that MNEs may find it advantageous to locate their affiliates in the Baltics and use FDI for transfer pricing and/or tax planning. Besides, given the post-Soviet history of the Baltics, one can argue that the argument of physical capital scarcity applies well to the context, where MNEs from Finland, Norway, or Sweden have incentives to invest in the relatively capital-scarce Estonia, Latvia, and Lithuania. For the purpose of this study, we treat the Baltics as , offshores as
, and real investing economies as
.Footnote5
Overall, the literature features two empirical approaches to estimating cross-country models of MNE activity: (i) calibration of parameters in accordance with a set of binding constraints, typically expressed in the form of a system of inequalities, and (ii) estimation of log-linear regression models based on suitable proxies for quantifying factor endowments, market size, and bilateral barriers. The former approach usually tackles general theoretical problems related to the identification of MNE activity in the world economy, for example Markusen and Venables (Citation2000), Markusen (Citation2002), Bergstrand and Egger (Citation2007) or more recently, applied policy modelling (Oyamada, Citation2020). While the latter approach is mostly data-driven, see for example studies of Carr et al. (Citation2001), Braconier et al. (Citation2005), Cieślik (Citation2020), and others. Since the analysis of this paper is based on real-world data, we adopt the second approach and operationalize the model by running static linear regressions.
2.2. Statistical data
The empirical investigation employs four different datasets. First, national inward FDI stockFootnote6 positions are gathered from the available statistical databases of Bank of Estonia (Citation2021), Bank of Latvia (Citation2021), and Bank of Lithuania (Citation2021) for the period 2009–2019. Then, collected national data are matched with data from Damgaard et al. (Citation2019) that covers approximatedFootnote7 bilateral SPE-FDI and real FDI equity stock positions for the majority of economies in the world between 2009 and 2017. Aggregate comparison between various types of inward FDI across the Baltics is available in Figure A5 (Appendix). We further compare inward FDI stock position from the largest investor in the Baltics, namely Sweden, to get a better picture of how closely national and estimated data compare between each other. Figures A6, A7, and A8 (Appendix) plot this comparison for Estonia, Latvia, and Lithuania respectively. Generally, national and estimated data match, yet with some discrepancies, particularly in the case of Lithuania (Figure A8). Further, to identify offshore partners, we rely on the offshore blacklistFootnote8 of the EU (European Council, Citation2023), findings of Hines and Rice (Citation1994), and Damgaard et al. (Citation2019). As a result, we focus on investments coming from the following economies: Belize, Cyprus, Hong Kong, Malaysia, Mauritius, the Netherlands, Luxembourg, Panama, and Singapore.
We estimate the real FDI equity of offshore partners using data matching between reported national data with Damgaard’s conversion factors through the following formula:
where,
is the estimated FDI stock originating from firms classified as non-SPE in host economy
from partner economy
in year
;
is a conversion factor of total FDI stock intro real FDI stock for host economy
from partner economy
in year
;
is national FDI stock in host economy
from partner economy
in year
;
denotes the host economy (Estonia, Latvia, Lithuania), while
indicates the offshore partners, and
the year of observation (2009, … , 2019). Partner samples are described in Table A1 (Appendix). The final panel (national data only) contains three host economies and 85 investor partners over the period 2009–2019 that yields a total of 2805 observations.Footnote9 Ultimately, the described data matching technique allows us to construct three types of dependent variables for counterfactual analysis: (i) national data, (ii) modified national data with matched real inward FDI for offshore partners, and (iii) estimated FDI data.Footnote10
Next, we describe proxies that quantify levels of factor endowments, market size, and bilateral trade and investment barriers. According to the horizontal motive of FDI, inward investment in the host economy should increase with an increase in terms of both the absolute and relative market size of both investment partners. The absolute market size is measured using the sum of the real GDPs of the parent country and each of the Baltic economies (GDP_SUM). Next, to approximate similarity in the relative market size, we use Helpman’s market size dispersion index (Helpman, Citation1987), which is computed using the GDPs of each of the Baltic economies and the parent country. Larger values of market similarity (DISP) in a given country pair should be positively related to the amount of inward FDI. As a result, we expect a positive sign of the estimated coefficient on DISP. GDPs are expressed in constant 2017 dollars. GDP data are sourced from the PWT.
Further, according to the vertical motive for FDI, increased differences between the relative factor endowments should translate into larger stocks of inward FDI. Differences in relative production factor endowments between each Baltic country and the parent economy are measured using differences in human and physical capital with per worker. More specifically, relative endowments of skilled labour (S_DIFF) are calculated using the human capital index based on years of schooling and returns to education. In turn, relative endowments of physical capital in per worker terms (K_DIFF) are calculated using the physical capital stock expressed in PPPs in constant 2017 dollars. The human and physical capital per worker data are sourced from the PWT.
Finally, to account for potential external barriers to foreign trade and investments, we include trade and investment freedoms for each of the Baltics and partner economies (TFHOME, TCHOST, ICHOST). These indices are sourced from the Heritage Foundation (Citation2021). The trade freedom index measures the absence of tariff and non-tariff measures invoked by a host economy against imports and exports of goods and services. It is based on two inputs, namely the trade-weighted average tariff rate and the non-tariff barriers. In turn, the investment freedom index measures freedom from restrictions on the movement and use of investment capital, regardless of activity, within and across the country’s borders. Every country is scored with an index between 0 and 100, with 0 being the least free and 100 the freest. Higher values of these indexes are associated with more trade and investment freedoms. A score of 100 must be interpreted as a signal of an economic environment or a set of national policies that are the most conducive to a market-based economic activity. Since the majority of inward FDI in the Baltics originates from the EU or the EFTA members it is likely that external barriers play a secondary role and can be entirely insignificant in our analysis. Descriptive statistics of our datasetare available in below.
Table 1. Descriptive statistics of variables used in Equations (1) and (2).
2.3. Empirical methodology
To begin with, we provide stylized empirical evidence for Propositions 2.1 and 2.2 using a reduced form static regression with factor endowments as the only explanatory variables for the location of inward FDI:
(1)
(1) where:
is a unilateral inward FDI equity stock from home country
in host country
in year
;
and
are the endowments of skilled labour per worker in country
and country
in year
;
and
are the endowments of physical capital per worker in country
and country
in year
;
encompasses time effects;
captures country-pair fixed effects, error terms are denoted by
, for
= Estonia, Latvia, Lithuania,
= 1, … , 85 partner countries,
= 2009, … , 2019, and
’s are the parameters to be estimated.
Next, we generalize the analysis of Equation (1) and operationalize the model to study the role of factor endowments, market size, external barriers on inward FDI:
(2)
(2) where, besides the endowments of skilled labour and physical capital, we employ GDPs (
) of country
and country
in year
; squared shares (
) of country
and country
in the sum of their GDPs in year
; trade barriers (
) of country
’s in year
; and country
’s barriers to investment and trade (
,
) in year
.
To estimate Equations (1) and (2) we use Poisson pseudo maximum likelihood (PPML) regressions with multiple fixed effects developed in Correia et al. (Citation2020), which are estimated through the iteratively reweighted least squares algorithm. This is dictated by the following properties of PPML estimator. First, PPML can be generally used on any nonnegative dependent variable and does not require specifying the distribution (e.g. we do not pose any assumptions about the shape of the stock distribution). Further, PPML accommodates the existence of zero values in the dependent variable. As a result, our FDI stock data do not require manipulations, such as the use of truncation, negative-positive transformations or absolute values. In addition, the estimator is able to handle heteroscedasticityFootnote11 much better than conventional log-linearized models estimated by OLS, even when the proportion of zeros in dataset is large (Silva & Tenreyro, Citation2006). Though, we acknowledge possible issues related to having mass point at zero and perform robustness checks by also running the estimator on nonzero samples in our analysis. Next, Weidner and Zylkin (Citation2021) demonstrate that PPML estimator is the one and only consistent estimator among a wide range of PML gravity estimators. In sum, we use PPML for all of our estimations in the paper.
3. Estimation results
This section presents and discusses the estimation results in three parts. First, we report the results obtained from Equation (1) using variations of our dependent variable to empirically demonstrate Propositions 2.1 and 2.2. This also includes cases, where we use a specification with only a single endowment. Then, we provide sensitivity analysis by estimating Equation (1) using different assumptions about offshore destinations in our sample. Finally, we demonstrate the application of the model and describe and interpret our findings. Throughout our analysis, we rely on the four main cross-country data samples: national (2009–2019), matched (2009–2017), estimated total FDI (2009–2017), and estimated and non-SPE FDI (2009–2017).
showcases estimation results based on the reduced from regression (1) using human capital as the only determinant of MNE activity. Columns (1)-(2) demonstrate the results based on a bilateral FDI stock position as reported by the national banks with zero FDI present and removed. Further, columns (3)-(4) indicate results based on the matched sample, where offshore destinations (e.g. Belize, Panama, and others) feature estimated non-SPE volumes of FDI matched by Damgaard et al. (Citation2019). Finally, columns (4)-(5) present results based on either total or non-SPE FDI data for all 85 partners based on Damgaard et al. (Citation2019). Overall, throughout different samples considered, the human capital difference remains an insignificant () or weakly significant (p < 0.10) determinant. On the other hand, when we consider the physical capital variable () using the same data samples, the estimated significance notably increases (between 1% and 5% levels) and remains strong in all the considered cases. Next, pictures results obtained from reduced form regression (1) using both physical and human capital differences. In such a case, both physical capital and skilled differences produce the expected signs and feature significance at the 1%–5% and 10% levels, respectively. Yet, the impact of the human capital difference (+42%) appears to be abnormally large in comparison with the physical capital one. Another interesting point is that the results between Damgaard et al. (Citation2019) and national data are quantitatively very similar.
Table 2. Estimation results for the Baltic panel, reduced form regression, human capital difference. Based on national (2009–2019), matched (2009–2017), and estimated data samples (2009–2017).
Table 3. Estimation results for the Baltic panel, reduced form regression, physical capital difference. Based on national (2009–2019), matched (2009–2017), and estimated data samples (2009–2017).
Table 4. Estimation results for the Baltic panel, reduced form regression, both endowments. Based on national (2009–2019), matched (2009–2017), and estimated data samples (2009–2017).
provides sensitivity analysis using four different assumptions regarding our dataset: (i) removing baseline offshore partners, (ii) a hypothetical level of total FDI for offshore partners, and (iii) estimated Total and non-SPE FDI data. Generally, the results are very similar, except that the estimated magnitude of skilled labour difference is twice as large in comparison to the general results from . Our major takeaway from the results reported in and is that the effect of skilled labour differences on inward FDI appears to be underestimated and significantly weakened by the presence of offshore partners in the sample.
Table 5. Reduced form regression – robustness. Based on national (2009–2019), matched (2009–2017), and estimated data samples (2009–2017).
Next, we proceed to the estimation of the model on the Baltic panel. describes the results obtained from Equation (2). Column (1) reports a case, where the dependent variable is national FDI data and zero FDIs are present in the sample. First, it is evident that all independent variables display the expected signs. For example, physical capital difference (K_DIFF) is positive and significant at the 1% level implying that the physical capital cost advantage in the Baltics attracts vertical MNE activity, while the skilled labour difference (S_DIFF) is positive and significant only at the 10% level. Next, the market size variables (GDP_SUM), and external barrier proxies do not exhibit any statistical significance while displaying expected signs with the exception of two variables: relative market size similarity (DISP) and hosts’ external trade barriers proxy, which are significant at the 10% level. Column (2) pictures additional results based on national data, but with zero FDI removed from the sample. The results are quantitively similar to the ones from column (1) with two notable changes. Now, the skilled labour difference and hosts’ external trade barriers proxies are significant at the 5% level.
Table 6. Estimation results for the Baltic panel, results for complete model. Based on national (2009–2019), matched (2009–2017), and estimated data samples (2009–2017).
Columns (3)-(4) report estimation results, where the dependent variable is matched national FDI data together with non-SPE stock positions for the baseline offshore partners, and zero FDI is either present or omitted from the sample. The results are again very similar to the estimates obtained from the national data in column (2).
Columns (5)-(6) indicate results obtained from either (a) total or (b) non-SPE FDI data from Damgaard et al. (Citation2019). The results are different in three ways. First, the estimated coefficient on skilled labour difference is also positive and significant at the 5% level.Footnote12 Next, the physical capital difference is significant at the 5% level. We tested the aforementioned regressions with zero FDI removed from the sample, and estimates remain robust.Footnote13 In addition, we perform further estimations using geographic distance in Equation (2) without country-pair fixed effects and clustering of standard errors. Overall, the additional estimates obtain a much more pronounced horizontal motive for FDI with market size-related variables (GDP_SUM, DISP) being significant at the 1% level, the estimates are available in Table B1 (Appendix).
The obtained results from Damgaard’s data are in line with the generalized theory of multinational enterprises. In particular, we think that it is probable that both human and physical capital are important in attracting FDI with market size playing a secondary role for each of the Baltics. This is not surprising given small size of their internal markets. Further, given the scope of data and applied theory, it appears that inward FDI is very much cost-driven as external barriers play little role in the results except column (2). Considering the above, the presented analysis is in line with the existing body of work on this topic and supports the empirical results of Vahter (Citation2004) from firm-level panel regarding the absence of horizontal MNE activity and subsequent spillovers in Estonia. As well as found FDI concentration in vertically specialized service sectors in Latvia (Titarenko, Citation2006), and more recently, the importance of skilled labour and physical capital in attaining vertical FDI across the Baltics (Cieślik & Gurshev, Citation2021).
Overall, the results in provide empirical evidence in support of the invoked set of propositions. In particular, the results document the insignificant impact of skilled labour differences vis-à-vis inward FDI (a single determinant case) and abnormally large estimates (a reduced form case), while the physical capital difference demonstrates significant rigidity throughout the analysis. Moreover, the results indicate that the physical capital difference has a much larger propensity to identify factor cost advantages (and hence vertical MNE activity) in comparison to the human capital one in the presence of potential tax planning or profit shifting activities of MNEs via the FDI channel even when we specify and estimate the full model. It is also important to note that the presented approach features different assumptions in regards to the degree (or volume) of round-tripping and/or profit shifting of MNEs. Ultimately, the results highlight the importance of assumptions behind the given partner sample, and composition of the dependent variable when studying bilateral FDI stock data in a cross-country setting.
4. Conclusion
This paper showcased potential methodological issues and proposed possible solutions related to the identification of vertical activity of multinational firms under the constraint of imperfect data. In particular, we demonstrated stylized evidence and conditions under which the use of similar levels of skilled labour endowments could lead to a dubious inference in a theoretical model of MNE’s cross country activity.
Before summarizing our findings, we would like to highlight the following limitations of our analysis. First, is the selection of countries our theoretical propositions focus on – relatively advanced service-based economies located in Europe. Surely, not all FDI recipients feature demonstrated similarities in terms of human capital development. As a result, Proposition 2.1 could be different if a more contrasting set of countries with larger differences in skills were investigated. Second, the presented analysis partially relies on the assumption that the distribution of cross-partner SPE shares is proportional between host economies, which is a fairly strong conjecture as real volumes of SPE-FDI are very likely to be different. However, given the scarcity of information that the existing literature has on this topic, we think that the newly available data on bilateral SPE and non-SPE volumes can be put to empirical use.
Having this in mind, the presented results produce strong empirical evidence for using the relative physical capital endowment as a very important determinant of vertical MNE activity. Given the degree of the featured counterfactual analysis, the estimates of physical capital difference have been shown to be consistent and featured a much larger propensity to identify factor cost advantages in comparison to human capital even in the presence of offshore destinations in the studied sample.
The discussed findings have several methodological implications for future research. First, unlike affiliate sales data, which provide a strong connection between MNE affiliates and host markets, aggregate FDI volumes are more prone to issues such as profit shifting and tax planning. Hence, national statistics of the reported FDI data should be treated with great caution. Second, the use of human capital difference as the only factor cost advantage explanatory variable inside a log-linear regression may significantly limit the empirical analysis and identification of MNE activity in aggregate volumes of FDI. Thus, an alternative measure such as physical capital difference should be used to detect factor cost advantages and hence vertical MNE activity as initially proposed in Bergstrand and Egger (Citation2007, Citation2013).
replies.docx
Download MS Word (19.3 KB)Acknowledgements
We are thankful to Krzysztof Szczygielski, Stefano Bolatto, Sarhad Hamza, and three anonymous referees for their comments and suggestions on the earlier drafts of the paper. Gurshev acknowledges financial assistance from the University of Warsaw, and host assistance from the University of Bologna.
Disclosure statement
No potential conflict of interest was reported by the authors.
Additional information
Notes on contributors
Andrzej Cieślik
Prof. Andrzej Cieślik is a full professor of economics at the Faculty of Economic Sciences, University of Warsaw.
Oleg Gurshev
Dr. Oleg Gurshev is a PhD student at the Faculty of Economic Sciences, University of Warsaw.
Notes
1 This refers to, inter alia, Belize, Cyprus, Malaysia, Mauritius, Panama, and Singapore. Destinations that were frequently found to be major locations of the abovementioned accounting activities in the studies of Hines and Rice (Citation1994), Davies et al. (Citation2018), and Damgaard et al. (Citation2019).
2 As Davies et al. (Citation2018) note, the implementation of the arm’s length principle alone is not sufficient to completely deter profit shifting as there are ways with which the final price can be determined. Hence, the existing methodological legislative flexibility still leaves a lot of room for MNEs to prove that the declared intra-group price is correct to national tax authorities.
3 Due to the existing lack of up-to-date firm-level studies using data from either Latvia or Lithuania, there is no certainty about whether any of incoming FDI in financial or insurance sectors is completely real.
4 For example, according to Bank of Russia (Citation2021), between 2009 and 2019 firms with residence in Cyprus maintained FDI stocks valued at around $128.3 billion (current dollars, annual average), while firms from the closest real investor economy – Germany, had only $13.5 billion.
5 We acknowledge that this approach ignores the existence of multi-stage profit shifting. Nevertheless, given the available data, we can at least demonstrate that such a setup can yield sensible empirical results.
6 The use of stock data is dictated by the following facts: first, unlike affiliate sales, bilateral FDI stock data are significantly more widespread and readily available for a large group of economies. As a result, cross-comparison, and panel data analysis can be applied to a great extent. Second, unlike flow data (net FDI), which are a sum of equity and debt instruments, stock data contains only the reported real capital equity owned by foreign affiliates in a given host economy.
7 Damgaard et al. (Citation2019) construct cross-country FDI positions using IMF’s Coordinated Direct Investment Survey (CDIS) that reports basic annual equity ownership across 100–105 economies together with the OECD FDI Statistics database that specifies how much inward FDI is conducted into SPE and non-SPE entities. Then, the ultimate owner economy is identified using firm-level corporate ownership information from Orbis.
8 While the current (2023) EU blacklist treats Russia and Costa Rica as non-cooperative tax jurisdictions, between 2009 and 2019 both countries were not considered as such. Hence, our analysis does not account for this change.
9 In all fairness, because the employed estimator drops observations that are either singletons or separated by fixed effects, our results never feature the complete number of observations, more details are in Correia et al. (Citation2020).
10 Here we refer to the two types FDI data we use from Damgaard et al. (Citation2019): i) total FDI (this includes both real- and SPE-related transactions, and similar to the data we observe using national sources), and ii) non-SPE FDI (genuine value of real equity only).
11 This also includes cases where the use of robust standard errors in OLS are not able to completely mitigate concerns about heteroskedasticity and will lead to incorrect inference from the regression analysis.
12 The estimated parameter remains significant at the 5% level only in case when we use Damgaard’s total FDI stock data (single determinant case). In the other instances, it is insignificant (national data) and weakly significant (non-SPE FDI stocks only), see Table B2 for details (Appendix).
13 These additional results are available upon request from the authors.
References
- Antràs, P., Fort, T. C., & Tintelnot, F. (2017). The margins of global sourcing: Theory and evidence from us firms. American Economic Review, 107(9), 2514–2564. https://doi.org/10.1257/aer.20141685
- Antràs, P., & Helpman, E. (2004). Global sourcing. Journal of Political Economy, 112(3), 552–580. https://doi.org/10.1086/383099
- Antweiler, W. (2021). Pacific exchange rate service: Historical annual exchange rates for the Euro. Retrieved July, 2021, from https://fx.sauder.ubc.ca/etc/EURpages.pdf
- Bank of Estonia. (2021). Direct investment position in Estonia and abroad by country (EUR million). Retrieved July, 2021, from https://statistika.eestipank.ee/#/en/p/146/r/2293/2122
- Bank of Latvia. (2021). Direct investment position in Latvia (EUR million). Retrieved July, 2021, from https://statdb.bank.lv/lb/Data.aspx?id=128
- Bank of Lithuania. (2021). Foreign direct investment by country (EUR million). Retrieved July, 2021, from https://www.lb.lt/en/inward-foreign-direct-investment-by-country-1
- Bank of Russia. (2021). External sector statistics (USD million). Retrieved December, 2021, from http://www.cbr.ru/vfs/eng/statistics/credit_statistics/direct_investment/10e-dir_inv.xlsx
- Bergstrand, J. H., & Egger, P. (2007). A knowledge-and-physical-capital model of international trade flows, foreign direct investment, and multinational enterprises. Journal of International Economics, 73(2), 278–308. https://doi.org/10.1016/j.jinteco.2007.03.004
- Bergstrand, J. H., & Egger, P. (2013). Shouldn’t physical capital also matter for multinational enterprise activity? Review of International Economics, 21(5), 945–965. https://doi.org/10.1111/roie.12081
- Braconier, H., Norbäck, P. J., & Urban, D. (2005). Multinational enterprises and wage costs: Vertical FDI revisited. Journal of International Economics, 67(2), 446–470. https://doi.org/10.1016/j.jinteco.2004.08.011
- Brock, G. J. (2018). Lithuanian regional FDI during the litas period, 1997–2013. Journal of International Business Research, 17(1), 1–10.
- Carr, D. L., Markusen, J. R., & Maskus, K. E. (2001). Estimating the knowledge-capital model of the multinational enterprise. American Economic Review, 91(3), 693–708. https://doi.org/10.1257/aer.91.3.693
- Cieślik, A. (2020). Determinants of foreign direct investment from OECD countries in Poland. Eurasian Economic Review, 10(1), 9–25. https://doi.org/10.1007/s40822-019-00136-y
- Cieślik, A., & Gurshev, O. (2021). Factor endowments, economic integration, round-tripping, and inward FDI: Evidence from the baltic economies. Journal of Risk and Financial Management, 14(8), 348. https://doi.org/10.3390/jrfm14080348
- Correia, S., Guimarães, P., & Zylkin, T. (2020). Fast Poisson estimation with high-dimensional fixed effects. The Stata Journal: Promoting Communications on Statistics and Stata, 20(1), 95–115. https://doi.org/10.1177/1536867X20909691
- Cristea, A. D., & Nguyen, D. X. (2016). Transfer pricing by multinational firms: New evidence from foreign firm ownerships. American Economic Journal: Economic Policy, 8(3), 170–202. https://doi.org/10.1257/pol.20130407
- Damgaard, J., Elkjaer, T., & Johannesen, N. (2019). What is real and what is not in the global FDI network? (Working Paper No. 19/274). International Monetary Fund.
- Davies, R. B., Martin, J., Parenti, M., & Toubal, F. (2018). Knocking on tax haven’s door: Multinational firms and transfer pricing. The Review of Economics and Statistics, 100(1), 120–134. https://doi.org/10.1162/REST_a_00673
- European Commission. (2021). Data on taxation: Taxes on capital. Retrieved July 2021, from https://ec.europa.eu/taxation_customs/document/download/1c4386fc-1086-45ba-9df4-65db9d25d28d_en
- European Council. (2023). The EU list of non-cooperative jurisdictions for tax purposes. Retrieved September 2023, from https://www.consilium.europa.eu/en/policies/eu-list-of-non-cooperative-jurisdictions
- Feenstra, R. C., Inklaar, R., & Timmer, M. P. (2015). The next generation of the Penn World Table. American Economic Review, 105(10), 3150–3182. https://doi.org/10.1257/aer.20130954
- Helpman, E. (1987). Imperfect competition and international trade: Evidence from fourteen industrial countries. Journal of the Japanese and International Economies, 1(1), 62–81. https://doi.org/10.1016/0889-1583(87)90027-X
- Heritage Foundation. (2021). Index of economic freedom. Retrieved August, 2021, from https://www.heritage.org/index/
- Hines, J. R., Jr., & Rice, E. M. (1994). Fiscal paradise: Foreign tax havens and American business. The Quarterly Journal of Economics, 109(1), 149–182. https://doi.org/10.2307/2118431
- International Monetary Fund. (2019). Glossary of foreign direct investment terms. Retrieved July, 2021, from https://www.imf.org/external/np/sta/di/glossary
- Ledyaeva, S., Karhunen, P., & Whalley, J. (2013). Offshore jurisdictions (including Cyprus), corruption money laundering and Russian round-trip investment (No. w19019). National Bureau of Economic Research.
- Markusen, J. R. (2002). Multinational firms and the theory of international trade. MIT Press.
- Markusen, J. R., & Venables, A. J. (2000). The theory of endowment, intra-industry and multi-national trade. Journal of International Economics, 52(2), 209–234. https://doi.org/10.1016/S0022-1996(99)00055-0
- Masso, J., Roolaht, T., & Varblane, U. (2013). Foreign direct investment and innovation in Estonia. Baltic Journal of Management, 8(2), 231–248. https://doi.org/10.1108/17465261311310036
- Masso, J., Varblane, U., & Vahter, P. (2008). The impact of outward FDI on home-country employment in a low-cost transition economy. Eastern European Economics, 46(6), 27–61.
- Organization for Economic Cooperation and Development. (2021). Transfer pricing country profiles. Retrieved August 2021, from https://www.oecd.org/tax/transfer-pricing/transfer-pricing-country-profiles.htm
- Oyamada, K. (2020). How does BREXIT affect production patterns of multinational enterprises? Journal of Policy Modeling, 42(1), 1–19. https://doi.org/10.1016/j.jpolmod.2019.08.002
- Roolaht, T., & Varblane, U. (2009). The inward-outward dynamics in the internationalisation of Baltic banks. Baltic Journal of Management, 4(2), 221–242. https://doi.org/10.1108/17465260910958827
- Silva, J. S., & Tenreyro, S. (2006). The log of gravity. The Review of Economics and Statistics, 88(4), 641–658. https://doi.org/10.1162/rest.88.4.641
- Titarenko, D. (2006). The influence of foreign direct investment on domestic investment processes in Latvia. Transport and Telecommunication, 7(1), 76–83.
- Vahter, P. (2004). The effect of foreign direct investment on labor productivity: Evidence from Estonia and Slovenia (Working Paper 32-2004). University of Tartu Economics and Business Administration.
- Vahter, P. (2011). Does FDI spur productivity, knowledge sourcing and innovation by incumbent firms? Evidence from manufacturing industry in Estonia. The World Economy, 34(8), 1308–1326. https://doi.org/10.1111/j.1467-9701.2011.01379.x
- Varblane, U., Reiljan, E., & Roolaht, T. (2019). The role of outward foreign direct investments in the internationalization of Estonian firms. In Facilitating transition by internationalization (pp. 133–154). Routledge. https://doi.org/10.4324/9781315255583-8
- Vicard, V. (2015). Profit shifting through transfer pricing: Evidence from French firm level trade data (Working papers 555). Banque de France.
- Waldkirch, A. (2011). Comparative advantage FDI? A host country perspective. Review of World Economics, 147(3), 485–505. https://doi.org/10.1007/s10290-011-0096-8
- Weidner, M., & Zylkin, T. (2021). Bias and consistency in three-way gravity models. Journal of International Economics, 132, 103513. https://doi.org/10.1016/j.jinteco.2021.103513
Appendices
Appendix A
Figure A1. Level of human capital between offshore origin countries, 2019. Source: Penn World Table 10.0.
Note: Red solid line represents average level among the presented countries.
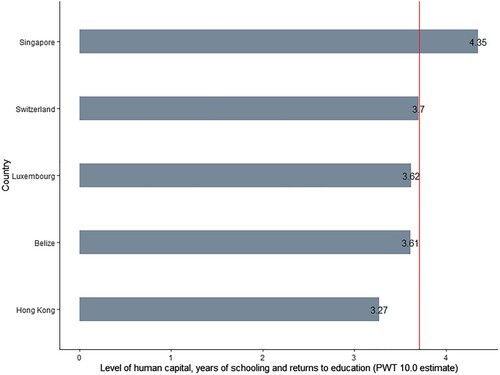
Figure A2. Level of human capital between real investor origin countries, 2019. Source: Penn World Table 10.0.
Note: Red solid line represents average level among the presented countries.
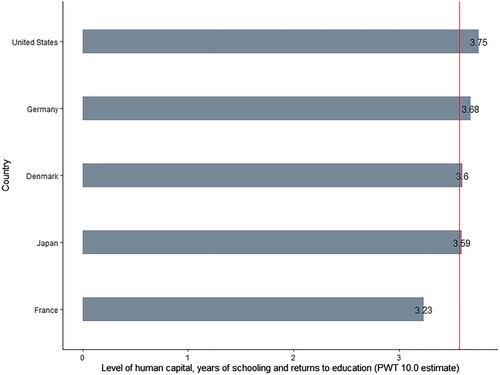
Figure A3. Level of physical capital between offshore origin countries, 2019. Source: Penn World Table 10.0.
Note: Red solid line represents average level among the presented countries.
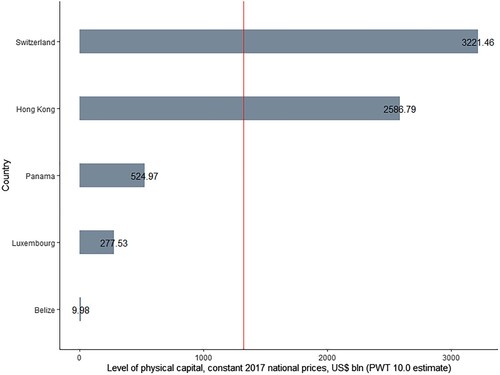
Figure A4. Level of physical capital between real investor origin countries, 2019. Source: Penn World Table 10.0.
Note: Red solid line represents average level among the presented countries.
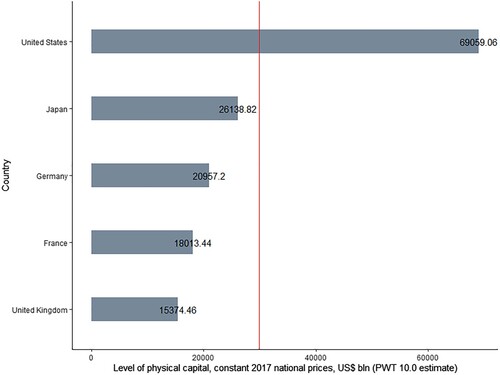
Figure A5. Cross-comparison between various types of inward FDI across the Baltic economies of Estonia, Latvia, and Lithuania, 2009–2017. Source: Bank of Estonia (Citation2021), Bank of Latvia (Citation2021), Bank of Lithuania (Citation2021), Damgaard et al. (Citation2019).
Note: Red dotted line denotes availability of real and SPE-FDI data.
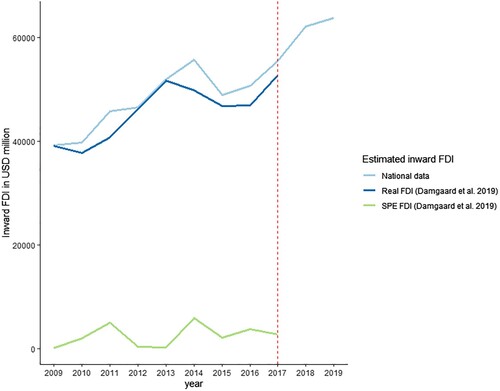
Figure A6. Comparison between reported and estimated data for Estonia, 2009–2017. Source: Bank of Estonia (Citation2021), Damgaard et al. (Citation2019).
Note: Inward FDI stocks from Sweden to Estonia, USD million.
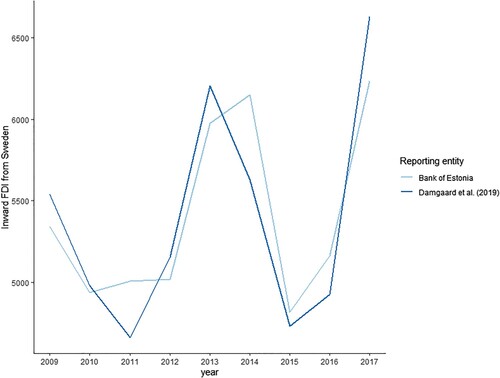
Figure A7. Comparison between reported and estimated data for Latvia, 2009–2017. Source: Bank of Latvia (Citation2021), Damgaard et al. (Citation2019).
Note: Inward FDI stocks from Sweden to Latvia, USD million.
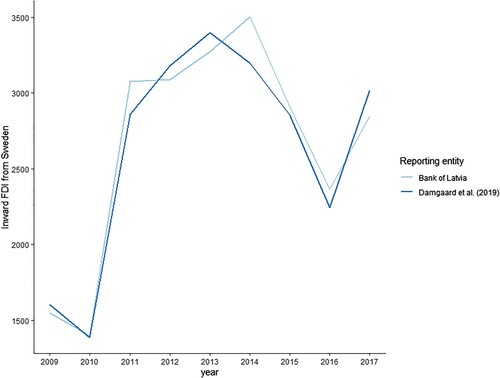
Figure A8. Comparison between national reported and estimated data for Lithuania, 2009–2017. Source: Bank of Lithuania (Citation2021), Damgaard et al. (Citation2019).
Note: Inward FDI stocks from Sweden to Lithuania, USD million.
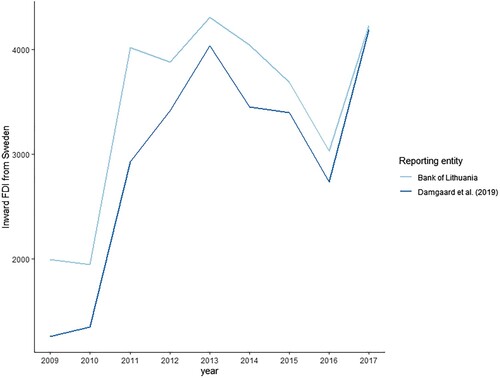
Table A1. Sample of partners used in the empirical analysis.
Table A2. Definitions and sources of independent variables.
Appendix B
Table B1. Estimation results for the Baltic panel with distance. Based on national (2009–2019), matched (2009–2017), and estimated data samples (2009–2017).
Table B2. Estimation results for the Baltic panel, single endowment case. Based on national (2009–2019), matched (2009–2017), and estimated data samples (2009–2017).