
 ?Mathematical formulae have been encoded as MathML and are displayed in this HTML version using MathJax in order to improve their display. Uncheck the box to turn MathJax off. This feature requires Javascript. Click on a formula to zoom.
ABSTRACT
Central bank communication plays a crucial role in the conduct of monetary policy, yet the research on central bank communication, while growing, is still scarce. In this paper, we analyze the communication reaction function of the European Central Bank (ECB) through topic-based indices derived from the bank’s speeches. These indices are used as dependent variables in policy and communication reaction function models, as suggested by recent literature. The topics are extracted using Latent Dirichlet Allocation (LDA), a popular text mining algorithm for topic extraction. The ECB has recently reviewed its monetary policy strategy, which led to an increase in studies incorporating the new methods offered by text mining for analyzing the policy reaction function of the bank. We show how indices built through topic modelling can be used to study the communication reaction function of a central bank, and we examine which variables are significant for every topic communicated by the ECB.
1. Introduction
Central bank communication plays a crucial role in the conduct of monetary policy, both in explaining policy decisions and as a policy instrument itself. Through communication, the ECB provides its views on the current economic environment, monetary policy outlook, and the policy reaction function, thus influencing market players’ expectations about the future course of policy, which is especially important in times of uncertainty. The research on central bank communication, while still scarce, has been growing in the last decades with a particularly renewed interest in studies about the policy reaction functions and communications of central banks thanks to the new analysis tools offered by natural language processing.
This paper lies in the intersection of central bank communication studies and natural language processing. In particular, our research aims to fill the gap between the literature on ECB communication reaction function and its speeches as a channel through which the bank communicates its stance on monetary policy and economic outlook. Other such channels include press conferences, monthly bulletins, interviews, etc. The issue is that the central bank does not explicitly share the way its decisions are taken, and thus researchers have estimated the policy reaction function of the ECB using different empirical models from the literature on optimal monetary policy, previous empirical research, and general information provided by the ECB itself (Cour-Thimann & Jung, Citation2021a, Citation2021b; Gerlach & Lewis, Citation2014; Rivolta, Citation2018).
Recently developed methods that use the text mining tools from natural language processing are currently being actively exploited by macroeconomists, particularly by those focused on central banking (Bohl et al., Citation2022; Hansen & McMahon, Citation2016; Hansen et al., Citation2019; Lin et al., Citation2023). Papers on the reaction function of the ECB usually use texts coming from the communications of the central bank to add new independent variables, such as indicators representing risks to price stability and growth, in order to increase the amount of information in their models and connect the words of the ECB with its actions (Cour-Thimann & Jung, Citation2021b; Gerlach, Citation2007).
There is also a plethora of studies focusing on other applications of text mining. Paloviita et al. (Citation2020) for example, create a sentiment index from the introductory statements of the ECB to understand the symmetry or asymmetry of the loss function of the bank to the risk of inflation or deflation. Cour-Thimann and Jung (Citation2021b) use an ordered probit model to estimate the interest rate setting of the ECB by deriving two discrete variables, which are added into the communication reaction function of the ECB. If the ECB’s words and actions are connected, the policy reaction function and the communication reaction function must be consistent with each other, so the same variables can also be used to estimate the communication reaction function of a central bank. Hanifi et al. (Citation2022) show how topics indicating surprise or confirmation by central bankers are affected by the expectations of inflation and GDP growth. Furthermore, Baranowski et al. (Citation2021) argue that central banks’ communications and interest rate decisions are interchangeable tools, while Cour-Thimann and Jung (Citation2021a) demonstrate that when comparing ECB policy decisions to the lagged balance of risks, a strong relationship between post-meeting communications and actions by the ECB becomes observable.
This paper aims to determine if the topic modelling and its ability to summarize textual documents into topic indices can be useful for estimating the communication function of the ECB in more detail than previous studies employing sentiment analysis or discrete indices could (Cour-Thimann & Jung, Citation2021b; Paloviita et al., Citation2020). This work also adds new insights to the studies on the connections between communication and the policy reaction function (Baranowski et al., Citation2021; Cour-Thimann & Jung, Citation2021b; Ehrmann et al., Citation2022). In analysing ‘what’ the ECB communicates instead of ‘how’ (Gu et al., Citation2022), we follow Casiraghi and Perez (Citation2022) who suggest that the central banks have to decide the contents of their communication before choosing how to communicate them.
Using topic indices allows us to treat the communication reaction function not as a monolithic entity but rather as part of a multifaceted framework. Our study describes novel findings, that are relevant to the literature on the communication reaction function. For instance, we show that by extracting topics from the ECB speeches, one can observe the impact of significant variables on all aspects of the communication reaction function. Such insights would remain hidden without employing topic modelling. Through our findings, we confirm that both monetary policy and price stability remain key parts of ECB communication. At the same time, we are able to observe that both the financial stability and some of the ECB’s secondary objectives have become more important since the Great Recession and the European sovereign debt crisis. We also analyze the importance of the zero lower bound on the topics.
From the empirical point of view, the textual dataset containing ECB speeches between 1997 and 2020 is pre-processed following standard procedures suggested in text mining literature. We then apply the Latent Dirichlet Allocation method (Blei et al., Citation2003; Griffiths & Steyvers, Citation2004) to extract topics from the speeches and apply common quantitative techniques to transform these topics into indices. Estimating different LDA models and conducting various robustness checks allow us to find the optimal number of topics to be extracted from our dataset. Newly formed topic-based indices are regressed using model specifications provided in previous studies (Cour-Thimann & Jung, Citation2021b; Hartmann & Smets, Citation2018) and act as new dependent variables for estimating the communication reaction function. Central bankers can consider different policy reaction functions when setting the interest rate (Zahner, Citation2021), this is why we use these two partially different models.
The introduction is followed by a section describing the relevant literature. The third section describes the text analysis process, data, and models used. The fourth section reports the results from the topic analysis and describes the regression results and findings for each topic. Finally, we discuss the results and conclude.
2. Literature review
This section reviews the literature on central bank communications and the development of topic indices, then discusses papers studying the policy reaction functions of the ECB. We also review the literature that connects policy reaction functions and the external communications of central banks.
Several papers employ text mining methods to study central bank communication and derive topics from the speeches. One example is Hendry and Madeley (Citation2010), which uses Latent Semantic Analysis on communication by the Bank of Canada and observes what type of information can affect returns and volatility in interest rate markets. El-Shagi and Jung (Citation2015) show that the minutes of the Bank of England’s Monetary Policy Committee influence the expectations of the markets for future monetary policies. Hansen and McMahon (Citation2016) and Hansen et al. (Citation2019) use text mining methods to study the macroeconomic effects of the Fed’s external communications. Lehtimäki and Palmu (Citation2019) create a topic-based indicator that measures the predictability of monetary policy through the official comments by policy makers. Thorsrud (Citation2020) constructs a new business cycle index based on quarterly GDP growth and information from a daily business newspaper found through a text mining algorithm. Their index can detect what type of news is more related to economic fluctuations. These studies, however, use the indices solely as independent variables and aim to measure their effects on macroeconomic indicators. The number of papers employing indices as dependent variables is still limited.
Studies of the ECB’s policy reaction functions started with the beginning of the European Monetary Union (EMU) and the creation of the ECB. Carstensen (Citation2006) shows through ordered probit models how the growth of M3 has been of central importance since the beginning of the EMU. Moreover, he argues that the ECB is more prone to agreeing to raise the interest rate rather than cutting it, implying that the anti-inflation view is stronger than the anti-deflation one. Gerlach (Citation2007) also applies an ordered probit model, using the ECB Monthly Bulletin to construct indices for evaluating the policy reaction function and shows that the ECB reacts to real activity, M3, and the exchange rate but not to inflation. In Gerlach’s view, this happens because the ECB interprets the inflation shock as temporary, but actually the reaction of real activities is stronger because it is related to the inflation outlook. In other applications, Gerlach and Lewis (Citation2014) use macroeconomic forecasts from the Survey of Professional Forecasters (SPF), which is available from the ECB, to estimate its policy reaction function and the influence of the crisis and the zero lower bound through a smooth transition model.
A well-known study on ECB communication is by Ehrmann and Fratzscher (Citation2009). The paper focuses on how the monetary policy decisions that are explained at press conferences are perceived by financial markets. Findings suggest that the ECB press conferences systematically add substantial information on ECB decisions and the underlying state of the economy. They also have larger effects on financial markets than the related policy decisions. Tobback et al. (Citation2017) build a Hawkish-Dovish indicator to measure the media's perception of the ECB's tone at press conferences. The results support the use such an indicator for analyzing and measuring media's perception of ECB communication. Findings also provide evidence that ECB communication enhances the accuracy of the bank's reaction function estimation. Bennani et al. (Citation2020) construct a similar measure of communication that assesses whether the communication is inclined towards easing, tightening or maintaining the monetary policy stance. In addition, this measure provides information on the future of the monetary policy and the course of interest rates. The importance of communication on future monetary policy decisions is highlighted also in Mirkov and Natvik (Citation2016), which focuses on the relationship between the forward guidance communications of central banks and forecasts. The paper shows how the past and present forecasts of the central banks are connected and how the adherence to the forecasts makes the forward guidance of the central banks more effective. However, Gosselin et al. (Citation2008) argue that a lack of full information from the central bank can diminish the effects of forward guidance and the alignment in expectations between the central bank and the private sector. Angelini et al. (Citation2019) stress the important effect of technical assumptions such as the assumption for fiscal development in the euro area, and of judgmental information on the ECB's projections.
Rivolta (Citation2018) examines the policy reactions of the ECB over the period 1999-2014 and investigates whether changes can be observed after the financial crisis of 2008 by employing various financial and macroeconomic variables. Most of this literature considers the importance of studies on optimal monetary policies such as Taylor (Citation1993), Clarida et al. (Citation1998), Orphanides (Citation2001), Orphanides (Citation2003), Orphanides (Citation2011), and Orphanides and Wieland (Citation2013) to make proper estimations of the policy reaction function. The Orphanides rule, in particular, is considered to be the one applied by the ECB, even if it there is still some debate about whether the rule is valid with the new unconventional policies of the bank (Hartmann & Smets, Citation2018; Orphanides & Wieland, Citation2013). It has to be noted, that numerous papers in this literature use macroeconomic forecasts in real time for inflation and GDP growth instead of unobserved future inflation and output. In principle, the communication and policy reaction functions should be consistent with each other, so it may be feasible to replace indicators of interest rates with topic indices and to regress those indices using the same variables and specifications that are in the models for the policy reaction function.
An increasing body of literature is now relating text mining analysis to the analysis of policy reaction functions, loss functions, and the introduction of new goals by different central banks during past decades. Dieijen and Lumsdaine (Citation2019) use LDA and a Dynamic Topic Model (DTM) to observe whether and how much the US Federal Reserve (the Fed) balanced its policies from 1997 to 2016 between the two components of its dual mandate of full employment and control of inflation. Moreover, they check whether the Fed added a third goal after the financial crisis of 2008–09, targeting financial stability and systemic risk. In their work, the authors use speeches from the Federal Reserve and extract three topics with LDA. They find that after the crisis, the Fed did indeed give more weight to employment, though the greater priority before the crisis had been inflation. In addition, they observe that the crisis has led the Fed to add financial stability and systematic risk aversion as a third goal.
Among papers that apply the topic modelling approach to textual data is Klejdysz and Lumsdaine (Citation2023), where LDA is applied to extract six topics from the introductory statements and Q&As of the ECB (2004-2018) and analyze their effects on volatility in the stock market. Event-based regressions are estimated, and the press conferences are disentangled between the ECB’s presidencies of Mario Draghi and Jean-Claude Trichet. The findings suggest that communication by the ECB is related to the monetary policy stance, and the communication is informative for the market. In consequence, any changes in the communications of the ECB can imply greater uncertainty in the financial markets. Hartmann and Smets (Citation2018) shows how ECB topics evolved in 1999-2018 through fifty LDA topics in the speeches of the ECB and the Supervisory Board of the Single Supervisory Mechanism at the ECB. These fifty topics are subsequently aggregated into nine large macro areas and the policy reaction function of the short-term interest rate is estimated using the ECB and SFP macroeconomic projections. The deviation from the inflation target is inserted, as is the deviation of forecast GDP growth from the potential output. The paper finds that the macroeconomic projections and the deviation of inflation are both significant in determining the policy reaction function of the ECB. The model is based on Orphanides (Citation2003).
A similar method of extracting topics with LDA together with sentiment analysis allows Kaminskas et al. (Citation2021) to investigate the effects of ECB communications on financial data. LDA is also applied in Tobback et al. (Citation2017) to study the tone of the ECB communication. Paloviita et al. (Citation2020) use the macroeconomic projections of the ECB and the introductory statements of the ECB to check for the presence of symmetry or asymmetry in the face of inflation and deflation. They construct an index to detect the tone of the different texts and estimate the loss function, considering an optimal monetary policy. As a robustness check, LDA is used and two topics related to price stability are extracted from nine available topics. The results differ depending on what target inflation rate is assumed.
Cour-Thimann and Jung (Citation2021b) estimate ordered probit models using twenty years of data from the ECB to derive the central bank's policy functions. The models are implemented by adding variables created from the ECB’s introductory statements at ECB press conferences and the KOF Monetary Policy Communicator. The variables represent risks to price stability and to growth. In the models, the dependent variables are replaced with their two discrete communication variables, and the results highlight that communications variables are partially explained by the projections of the ECB and the Survey of Professional Forecasters, the M3 annual growth, and the Fed funds policy rate target, as well as other regressors such as oil prices. Cour-Thimann and Jung (Citation2021b) base their theoretical framework on forward-looking Taylor rules (Orphanides, Citation2001).
Our paper takes account of these recent studies and exploits the possibilities offered by the LDA topic models to create topic indices. The aim is to fill the gap between the studies on communication reaction functions and those on topic modelling.
3. Empirical analysis
3.1. Text analysis and topic indices
The public speeches of ECB presidents, vice presidents, and board members (ECB, Citation2019) have recently started to be published on the ECB website in CSV format and openable for use by anyone. The available dataset stretches back to 1997 and is released and updated by the ECB every month. It includes speeches from conferences and meetings held in the ECB headquarters or other institutions. The speeches are published a few times a week, and for our analysis, they are aggregated by quarters. We consider the entire dataset from February 1997 to January 2020 and so deliberately exclude the effects of COVID-19.
The first step for our empirical analysis is to create topic indices. This section describes the different procedures used to define the number of topics in the LDA model and the methods used to aggregate the useful terms into topics. This step is needed to make the choice of the number of topics less arbitrary.
We start the analysis of the ECB speeches with initial pre-processing operations such as erasing the non-English speeches, punctuation, stop-words, white spaces, and digits. All words are also converted to lowercase. We then proceed to tokenize the sentences, which means splitting them into individual words so that ‘high interest rates’, for example, are divided into three tokens: ‘high’, ‘interest’, and ‘rates’. After the words have been tokenized, we stem them. This is done by cutting off the beginning or the ending of a word to reduce their length so that ‘policies’ becomes ‘polici’ or ‘financial’ becomes ‘financi’, and uniting similar words. In the last pre-processing step we eliminate the words that do not add any additional meaning, having already eliminated the standard language-specific stop-words in previous steps. The words we now eliminate are those like ‘take’, ‘year’, ‘today’, ‘part’, and so on.
Following the pre-processing stage, we employ a term frequency-inverse document frequency or TF-IDF (Salton & Harman, Citation2003), to see what the most frequent terms in each document in the corpus are, to observe what other words can be excluded and to find which value of in n-gramsFootnote1 can add more interpretation on the topics. In general, the TF-IDF approach scores word frequencies, therefore allowing to identify the words that have higher informational content. In TF-IDF, the frequency of each word is rescaled both by how rare it is accross all documents and by how frequently it appears in a given document. The researcher chooses the minimum frequency threshold and as such, we choose the minimum document frequency to be between 10% and 90%. What this means is that TF-IDF removes any words that occur in fewer than 10% of the documents, signalling that these words do not contain relevant information since they are not often used in ECB speeches. TF-IDF can be described as:
(1)
(1) where
counts the number of times the word w appears in document d. The denominator of (Equation1
(1)
(1) ) is the IDF. This takes on a value between 0 and 1 and measures how common a word is in the corpus by how frequently it appears. N is the corpus, the set of the documents in the dataset, and df is the occurrence of one term in the document set: the closer df is to 0, the more common the word is, and if the measure is close to 1, the word appears only rarely.
Pre-processing results in a total of 258 bigrams and trigrams. Some of these are relevant for TF-IDF measurement, while others are discarded, as they do not add particular value to the interpretation of the topics.Footnote2 Out of 258 bigrams and trigrams, only 25 are found to be relevant to our context. Consequently, we choose to limit our analysis to unigrams and bigrams and continue to apply the topic modelling. LDA is the chosen model used as the probabilistic Bayesian version of the Latent Semantic Analysis (LSA), but it allows a greater level of accuracy than LSA and is a popular method for topic modelling in natural language processing. It identifies each document analyzed as a mixture of topics, and it clusters the words into relevant topics. The algorithm assigns different probabilities to each word and document by estimating their probability distribution. The joint distribution for the LDA algorithm can be summarised as follows:
(2)
(2) where M is the number of documents that are the object of the analysis, k is the number of topics, θ is the distribution of the topics for each document, z is the number of topics per document, β is the distribution of words in each topic, and N is the corpus or the collection of documents in the dataset composed of all the M documents. α and η are vector parameters, with α relating to the distribution of the documents and η to topics. The LDA model estimates the joint posterior probability of θ, z, and β.
We apply LDA with a simple document matrix and follow the methods of Blei et al. (Citation2003), and Griffiths and Steyvers (Citation2004), but use only unigrams or bigrams. In those papers, the most robust result is provided by the Griffiths and Steyvers (Citation2004) model, in which Gibbs sampling is applied (Geman & Geman, Citation1984) and bigrams are used.
To validate this result and also the number of topics, we run different robustness checks. Firstly, we perform the LDA with both bigrams and unigrams, setting 4, 5, 14, and 50 as the number of topics. The limit of 50 topics is based on the findings of Hartmann and Smets (Citation2018) and the similarity between our dataset and their data. We chose 4 and 5 as the number of topics as a rough guess based on preliminary visualizations of the results of the LDA models. The number 14 is introduced as a further check in a subsequent run of the algorithm, given the results of the first run of the estimations. We compute perplexityFootnote3 and coherence scores as two typical measurements used in LDA literature, along with data visualization tools.Footnote4 The higher the coherence score is, the better the model is, so the two score measures work differently and in opposite directions (See ). The results of the coherence scores are better visualized in .Footnote5
Figure 1. Coherence scores of LDA models with different numbers of topics. Data source: ECB.
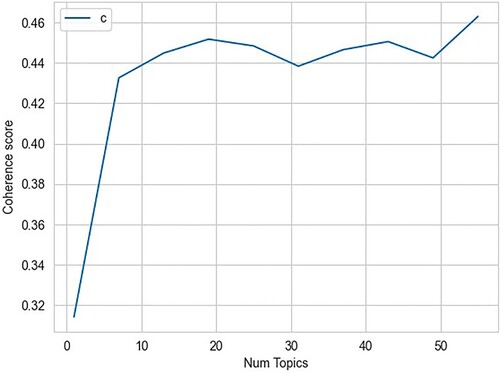
Table 1. Coherence and perplexity scores for different numbers of topics.
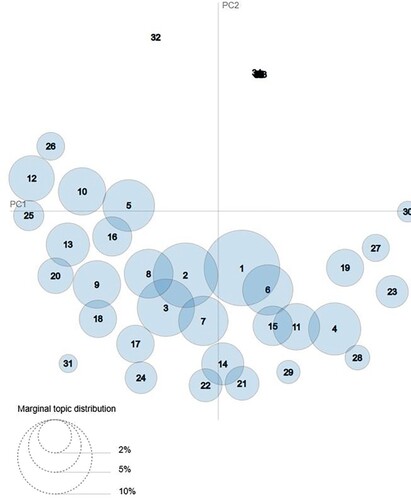
It is apparent from analyzing the results from and that the best choice is to have four or five topics. Having 50 or 14 topics gives the best results in , but shows this is not a good choice because the first spike of the curve is at fewer than ten topics. Furthermore, data visualization with 50 or 14 topics does not separate out the different topics efficiently. We can find confirmation of this by observing the intertopic distance maps of 14 topics and 50 topics (see Sievert & Shirley, Citation2014 and and ). The map represents the topics as spheres on a cartesian plane. The more distant the topics are from one another, the fewer words they have in common. The distance itself is found using the Jensen-Shannon divergence, which is able to distinguish between two or more distributions and is based on a combination of the findings from Jensen's inequality (Jensen, Citation1906) and Shannon's entropy (Shannon, Citation1948). The marginal topic distribution is the prevalence of the topic in the overall corpus, and the larger the sphere is, the more important the topic is as a percentage of the overall corpus.
Figure 2. Intertopic distance map – number of topics is 14. Data source: ECB.
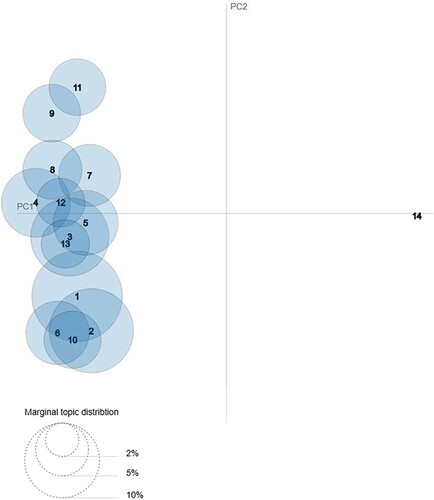
Figure 3. Intertopic distance map – number of topics is 50. Data source: ECB.
Finally, we estimate LDA models with and without TF-IDF ().Footnote6 We find at first that there is no particular difference between using four or five topics, but when we observe the model with bigrams and five topics, it is evident that it performs better than the model with four topics for perplexity, and the two models have almost the same results for the coherence scores. Furthermore, the LDA models with only bigrams perform much better for coherence scores than those with only unigrams. Finally, introducing TF-IDF slightly improves the perplexity score but does not particularly affect the coherence scores. Interestingly, Blei et al. (Citation2003) declare that LDA does not need TF-IDF.
Table 2. LDA with TF-IDF and Bigrams – scores.
However, Blei and Lafferty (Citation2009) affirm that the combination of TF-IDF and LDA can be helpful in reducing the vocabulary size and visualizing the topics. This reduction is already visible in the previous analysis of bigrams and trigrams, where TF-IDF analysis highlighted unigrams that can be eliminated in the pre-processing step without relevant bigrams being lost. In addition, there is no need to use trigrams, as we observed. Given these results, we employ an LDA model with bigrams and Gibbs Samplings, and we choose five as the number of topics.Footnote7 Data visualization of the topics can be seen in the Appendix 1 (Figure A1).
The results of the LDA method are used to create topic model indices with a similar approach to those of Thorsrud (Citation2020) and Gabrielyan et al. (Citation2019). Following their methods we select the 15 most frequent words from each topic extracted by LDA and compute the sum of the frequencies for each of these words for each topic and each day. In this way, we construct daily indices for every topic. Since the frequency of the speeches is irregular and not daily, we average the daily results by quarters to obtain quarterly indices.Footnote8 Following Gabrielyan et al. (Citation2019) the index can be described as:
(3)
(3) where
is a measure of frequency, or the frequency index of topic z at time t extracted with the LDA algorithm.
is the frequency of word w from topic z in document d. Each w corresponds to one of the 15 most frequently occurring words in topic z. The names of the topics are derived manually from the interpretation of the results and are later confirmed by observation of the results of the regressions, with a particular focus on distinguishing the two topics related to the monetary policy of the ECB. We also take account of the LDA analysis performed by Hartmann and Smets (Citation2018).
The names of the topics and the abbreviations for them are:
Financial Stability and the Banking System (FSBS)
Non-standard Monetary Policy (NMP)
Canonical Monetary Policy (CMP)
European Monetary Union and Growth (EMUG)
Financial Integration and the Payment System (FIPS)
3.2. Data and models
The indices are regressed by inflation, which is taken from the projections of the ECB and the quarterly one-year-ahead forecasts of the Survey of Professional Forecasters (SPF). The ECB forecasts are real-time and include the following calendar year projections for each quarter: the projections of the first quarter of 2000 for the year 2001, the projections of the second quarter for the year 2001, and so on. Real GDP growth is taken from the ECB’s website. We also introduce the control and financial variables used in Cour-Thimann and Jung (Citation2021b), such as the 3-quarter moving average M3 annual growth at t-2, the Fed Funds target at t-1, the 3-quarter moving average credit growth for euro area residents as a replacement for the M3 variable at t-2, and the oil price at t-1 as a further control variable.Footnote9 This first model is partially similar to that of Cour-Thimann and Jung (Citation2021b), which we term the CJ model. As a robustness check, we replace our ECB and SPF forecasts with the ECB and SPF data used by Cour-Thimann and Jung (Citation2021b). A full description of the data and the sources is available in Table A1 of Appendix I. All data are normalized using z-score normalization similar to that in Cour-Thimann and Jung (Citation2021b).
The formula of this model can be described as follows:
(4)
(4) where
is a group of variables that includes several forecast data for inflation, such as the inflation forecasts of the ECB (
), the inflation forecasts of the SPF (
), and the inflation forecasts of the ECB with the data from Cour-Thimann and Jung (Citation2021b).
represents various forecast data for real GDP growth, such as the forecasts of the ECB (
), the forecasts of the SPF (
), and the forecasts of the ECB with the data from Cour-Thimann and Jung (Citation2021b).
are the financial variables, either
or credit growth,
.
represents the FED funds target.
is the oil price and
is the error term. The lags are selected by considering when the information should be available to the ECB Board as in Cour-Thimann and Jung (Citation2021b), in our case, using quarters. To check for the eventual differences between the full sample, the pre-crisis period, and the pre-lower bound period, we apply the method suggested by Cour-Thimann and Jung (Citation2021b) to account for the periods before 2008 and 2014. However, it is unclear if the results are due to the low level of observations, as this can cause some issues in the estimations. To tackle this issue, we create two dummies: CRISIS and ZLB. For the CRISIS specifications, the quarters from Q4 2000-Q3 2008 are set at 0, and the subsequent ones are 1. For ZLB specifications the dummy is equal to 0 in periods between Q4 2000-Q2 2014. The following quarters are equal to 1.
Finally, we estimate the model proposed by Hartmann and Smets (Citation2018), which we term the HS model, replacing the short-term interest rate with our topic indices and including ECB projections with or without the SPF projections in the model. Moreover, the deviation of the projections from the inflation target of 1.81% estimated by Hartmann and Smets (Citation2018) and the deviation of the GDP growth projection from potential output growth are reflected by dummy variables. The dummy for inflation is equal to one if the deviation of projected inflation is larger than the predicted inflation target and zero otherwise. The dummy related to growth is equal to one if the deviation of projected GDP growth is greater than potential output growth and zero otherwise. The interactions of the deviations with the forecasts are also included in the model specificationsFootnote10, which are now as follows:
(5)
(5) where
is a group of variables representing the ECB’s forecasts for inflation (
) and real GDP growth (
).
describes a group of variables composed of the SPF’s forecasts for inflation (
) and GDP growth (
).
indicates the two deviation dummies, which are
and
.As mentioned above, we also include the dummies CRISIS and ZLB.
We expect that the variables in the Cour-Thimann and Jung (Citation2021b) model, like federal funds and credit growth, are very relevant for topics like FSBS and FIPS. The forecast over GDP should be more important for the EMUG topic, and the inflation forecast should be relevant for the topics on monetary policies. Furthermore, we know that M3 growth was very important in the early days of the euro area as a tool providing information for the board of the ECB. We expect this to be highlighted by topics such as CMP. The oil price should be relevant for monetary policy as well, especially for NMP, given the increased attention that this variable has received in recent years.
As for the HS model, the ECB forecast should, at least in general, be more relevant for the board of the ECB than the SPF forecasts are. In further analysis, we also aim to check for deviation from the inflation target and the output gap in the topics. In principle, deviation from inflation should be more relevant for topics such as CMP and NMP. Deviation from the output gap could be relevant for EMUG and FSBS.
4. Empirical communication reaction functions of ECB
4.1. Financial stability and the banking system
We report the results of the two different models. We describe the results of the full sample without the CRISIS and ZLB dummies of Cour-Thimann and Jung (Citation2021b) model, and the ones of the Hartmann and Smets (Citation2018) model. The results for the CJ model with SPF forecasts and with the dummies are presented in Appendix I. The results with the reduced subsamples and the robustness check for the CJ data are available upon request.
As highlighted by and as expected, the topic of Financial Stability and the Banking System occurs increasingly in the ECB speeches during the period of the financial crisis of 2008-2009 and after. These dynamics are related not only to the effects of the Great Recession but also to the creation of the European Banking Union, which assigned supervisory responsibilities to the ECB (Hartmann & Smets, Citation2018). The main results presented in show that for CJ models, the ECB’s forecasts for real GDP growth and the federal funds rate have negative and highly significant effects on the frequency of the topic in speeches by the ECB, while the results for credit growth are positive and significant. Not surprisingly, none of the variables related to monetary issues are significant in any of the four specifications of the model. The results are substantially the same when we replace the ECB forecasts with the SPF forecasts (see Table A2 in Appendix I). The only difference is for the inflation forecast, where there is a negative significance when credit growth is included in the specifications. Replacing our data with those of Cour-Thimann and Jung (Citation2021b) causes a loss of significance for the federal funds. The results for the forecasts of GDP and credit growth are the same.
Figure 4. Topic – Financial Stability and the Banking System (FSBS), Q4 2000–Q4 2019. Data source: ECB – normalized data.
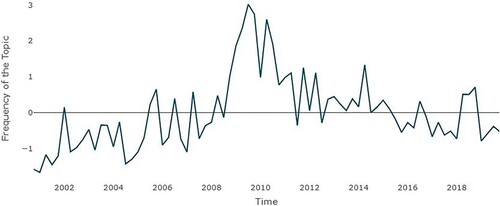
Table 3. CJ model – topic financial stability and the banking system.
When the CRISIS dummy is introduced (Table A3 in Appendix I), we can observe how the crisis affects the topic greatly. The dummy is extremely significant, and it has positive effects on the frequency of the topic. It can also be noted that the inflation forecasts affect the frequency of the topic positively, and M3 growth becomes significant after the dummy is introduced. The forecast for real GDP is still negative and significant. The correlation could arise from the effect of the Great Recession on the economies of the euro area, but this does not necessarily imply a causal relationship. However, the significance of the forecasts disappears when the credit growth variable replaces M3 growth in this framework. Introducing the ZLB dummy (Table A4 in Appendix I) does not affect the results of the baseline scenario.
The analysis of the HS model () shows that the ECB forecasts have significant, negative relationship with the real GDP in all specifications of the model. There are two other interesting findings besides this. Firstly, the deviation from potential output has a positive and strongly significant effect on the topic. Secondly, the crisis has a positive and significant level, even if at 10%, but it does not affect the significance of the forecasts of real GDP negatively.
Table 4. HS model – topic financial stability and the banking system.
4.2. Non-standard monetary policy
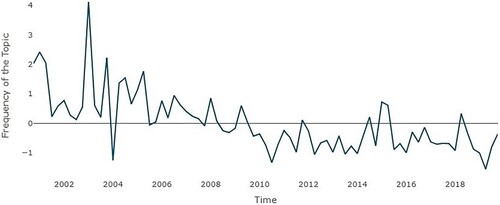
illustrates the dynamics of the non-standard monetary policy topic index. We can observe stable movement in the index until 2014, after which it appears that the topic becomes more common. Non-standard monetary policies have become more relevant in recent years since policies such as large-scale asset purchases and negative interest rates are employed (Hartmann & Smets, Citation2018). shows the negative significant relationships at 1% between the topic and the forecasts of ECB for inflation and at 5% with the oil price. The forecasts for GDP are only significant in the specification with M3 and the oil price. The results with the SPF forecasts (Table A5 in Appendix I) replicate the same results as for the ECB forecasts.
Figure 5. Topic – Non-standard Monetary Policy (NMP), Q4 2000–Q4 2019. Data source: ECB – normalized data.
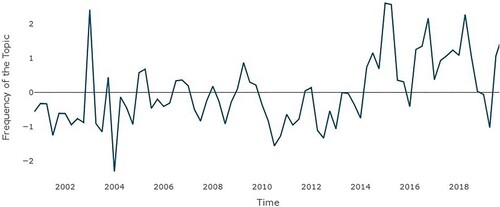
Table 5. CJ model – topic non-standard monetary policy.
Introducing the Cour-Thimann and Jung (Citation2021b) data does not affect the general results significantly. The CRISIS dummy is highly significant in almost all specifications and has a positive effect. The M3 growth is only significant at 10% in the first specification. Most importantly, the ECB forecasts remain significant, and the forecasts for real GDP growth become positive and significant (Table A6 in Appendix I). Introducing ZLB (Table A7) has a major effect on the topics. The oil price remains significant and positive, M3 growth is weakly significant, and the forecasts of the ECB lose significance.
In the HS model () we can still see the negative and significant results of the ECB inflation forecasts. However, when the SFP inflation forecasts are added, they become significant while the ECB forecasts become insignificant. Both dummies are significant and have positive effects on the topic of non-standard monetary policy. We can further observe that the interactions of the ECB’s inflation forecasts and real GDP growth forecasts and their corresponding deviations, target and potential output, are significant. Interestingly, potential output remains relevant even after the introduction of the ZLB dummy.
Table 6. HS model – topic non-standard monetary policy.
4.3. Canonical monetary policy
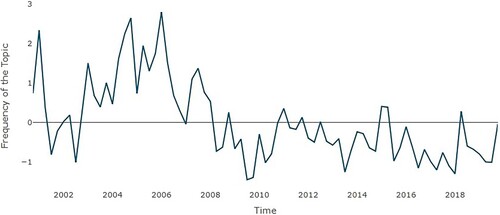
shows how interest in this topic, reflected by its frequency in the ECB speeches, declines after the crisis and stabilizes at a new level afterwards. As Hartmann and Smets (Citation2018) and Kaminskas et al. (Citation2021) report, the main goal of the ECB when it was established was to assert credibility for its price stability strategy. Consequently importance was given to the M3 aggregate in this period (Hartmann & Smets, Citation2018).
Figure 6. Topic – Canonical Monetary Policy (CMP), Q4 2000–Q4 2019. Data source: ECB – normalized data.
shows the results of the CJ models. The forecasts for real GDP by the ECB are significant at 5% and have a positive relationship with the canonical monetary policy topic, and so do M3 and credit growth. This changes when the ECB forecasts are replaced by the SFP forecasters (Table A8 in Appendix I). In this framework, the forecast data lose significance. However, M3 remains statistically significant with a positive effect on the topic, and federal funds are also significant in the specifications with M3 growth.Footnote11 With the Cour-Thimann and Jung (Citation2021b) data, the forecasts for GDP turn significant again, but only at 10%.
Table 7. CJ model – topic canonical monetary policy.
The introduction of the CRISIS dummy (Table A9) demonstrates how the dummy is extremely significant and how it neutralizes the significance of all the variables. The framework is quite different when we replace the CRISIS dummy with the ZLB dummy (Table A10). The ECB forecast for real GDP is positive and statistically significant at 1%, while the inflation forecast is significant at 10% when the credit is included in the specifications. ZLB is statistically significant at 1%, and as expected, it has negative effects because it was absent in the periods when canonical monetary policy was more relevant.
The HS model sheds further light on the communication reaction function of the topic of canonical monetary policy. Most model specifications result in forecasts of real GDP being statistically significant and positive. As expected, the deviation of GDP from the output gap and the interaction between the output gap and the forecast for GDP and the deviation in it are relevant. The latter is significant with both the dummies of the model ().
Table 8. HS model – topic canonical monetary policy.
4.4. The European monetary union and growth
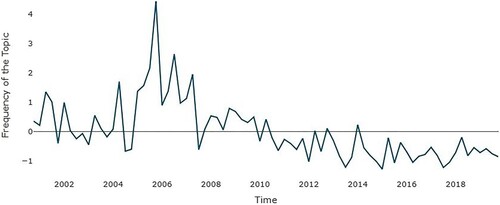
illustrates how the topic of the launch of the euro cash by the European Monetary Union (EMU) was very prominent in the years before it happened, but it had a lower frequency in ECB discussions in later years. However, the accession of new EU members with the 2004 enlargement kept the topic relatively visible until the Great Recession and the European sovereign debt crisis (Kaminskas et al., Citation2021). Structural and competitiveness issues were discussed before the financial crisis, as reported by Hartmann and Smets (Citation2018).
Figure 7. Topic – European Monetary Union and Growth (EMUG) (Q4 2000–Q4 2019). Data source: ECB – normalized data.
The results of the regression presented in show a positive and significant relationship between the topic and the forecasts for inflation and GDP, though the relationship with GDP is only significant at 10%. None of the other variables are relevant.
Table 9. CJ model – topic EMU and growth.
In the framework with the SPF forecasts (Table A11 in Appendix I), the relationship remains positive and statistically significant for inflation, though only at 10%. Introducing the Cour-Thimann and Jung (Citation2021b) data does not change the sign of the relationship or the significance of the inflation forecasts, but in some of the specifications, the GDP forecasts are already positively and statistically significant at 5%. The CRISIS dummy is significant, and when it is included, the M3 growth becomes negative and statistically significant at 10%. In the ZLB scenario (see Table A12), the GDP forecast is highly significant at either 5% or 1%. The ZLB dummy is negative and highly significant. Credit has a negative statistical significance at 5%.
In the HS models (), the forecasts of the ECB are significant and positively related with the topic in the simpler specifications of the model. The SPF forecasts are not, however, significant. Deviations from the inflation target and potential output are significant, with the inflation target highly significant and potential output weakly significant and negative. The interactions between the inflation target and the inflation forecasts are negative and significant at either 5% or 10%, depending on the specifications. Both the CRISIS and ZLB dummies are negative and significant. Introducing the ZLB dummy (Table A13) makes the GDP forecasts positive and significant and does the same for deviation from the inflation target.
Table 10. HS model – topic EMU and growth.
4.5. Financial integration and the payment system
Frequency analysis of the financial integration and payment system topic is presented in . It can be seen that it was especially popular between 2004 and 2008, but its popularity as a topic started to decline after 2010. Notably, the peak of popularity was reached in 2006 when the ECB communicated a lot about payment and settlements (Hartmann & Smets, Citation2018). The shift from the TARGET system to the TARGET-2 system kept the ECB talking about the topic for some years more.
Figure 8. Topic – Financial Integration and Payment System (FIPS), Q4 2000–Q4 2019. Data source: ECB – normalized data.
illustrates the importance of the growth in federal funds and credit in terms of their statistical significance at 5% with a positive sign. The inflation forecasts are weakly significant when M3 growth is included in the specifications, and the SPF forecasts have similar results to the baseline scenario (Table A14). When we replace our data with those from Cour-Thimann and Jung (Citation2021b), the only variable to maintain its significance is federal funds. Introducing the CRISIS (Table A15) dummy creates a significance of either 5% or 10% and a negative effect from ECB forecasts on real GDP. Federal funds are weakly positive and weakly significant at 10%. Inserting ZLB (Table A16) causes federal funds to become positive and significant again at 5%, while ZLB is negative and significant at 1%.
Table 11. CJ model – topic financial integration and payment system.
In the HS framework () there is some slight significance for the deviation from the potential output during the crisis and the interaction between forecast GDP and the deviation of potential output, as both are positive and significant at 5%. ECB forecasts of inflation are highly significant only in the simplest specification.
Table 12. HS model – topic financial integration and payment system.
4.6. Robustness checks
Communications in central banking are generally bound to have a certain degree of autocorrelation because central banks show internal coherence in their communication and forecasts.Footnote12 For this reason, we perform the same regressions with other specifications. First, we add one lag of the topics to the right side of the equations, as in Cour-Thimann and Jung (Citation2021b). Then, we estimate the same regressions with four lags to account for any possible seasonality resulting because there are periods with fewer speeches, essentially the Summer.
Finally, even though the total probabilities of our topics sum up to one in our time series, it is still possible that there is a certain degree of correlation between the topics.Footnote13 To check this, we run a multinomial probit model including one lag of the dependent variable, which is similar to the logic in Cour-Thimann and Jung (Citation2021b). To substitute the different levels of the interest rate that the authors use in constructing their categorical dependent variable, we select the highest topic probability for each document at each point of time in our time series. This way, we obtain a time index variable with a value between one and five. However, due to the low number of observations, it is possible to include in the estimations only two independent variables plus the topics' lag per specifications. In this sense, we limit our analysis only to the ECB inflation forecasts and GDP growth forecasts, given their greatest importance in both CJ and HS models.
4.6.1. Results of estimations with lags
The resultsFootnote14 show important differences from the baseline scenario. The first lag is significant in all the models that include only one lag, but the picture is more complex in the models with four lags. The FSBS topic in the CJ model with one lag reduces the statistical relevance of the ECB forecasts for GDP to 10%. Credit growth and the Fed target are still very significant even in this scenario. In the HS model with one lag, the ECB forecasts for GDP are still significant at 5% or 1% in most of the specifications, and the GDP deviation is significant at 1%. In the CJ model with four lags, the Fed targets only maintain their significance in half of the specifications. However, we can observe how only the first lag is statistically significant, while adding the other three lags does not particularly increase the R-squared of the estimations. In this sense, the model with four lags is most probably over-specified. The HS model shows a similar pattern, where the ECB forecast for GDP is significant at 10% only in the last specification, while the GDP deviation is significant at 5%. In this model, too, the first lag appears to be the only significant one, and adding others does not increase the explanatory power of the model itself.
The CJ model for the non-standard monetary policy topic with the first lag shows that the inflation forecast is significant at 5%, while the oil price maintains its significance. A similar situation is found in the model with four lags, though there is a decrease in significance for the ECB forecast for inflation. As with the previous topic, however, adding new lags does not increase the R-squared of the estimations. In the HS model with one lag, the ECB forecasts and the SPF forecast for inflation are still significant, while GDP deviation is significant at 5%. In the four-lags version of the model, the interaction between the ECB forecast for GDP and the deviation of GDP is significant at 10%. The only relevant lag is the first one, and adding all four lags only increases the R-squared by a few decimal points.
In the CJ model with one lag for canonical monetary policy, the significance of the ECB forecast for GDP and of M3 growth is reduced to 10%. Adding the four lags increases the R-squared of the OLS estimation considerably, but both the ECB forecasts and M3 growth lose significance, and Fed targets become significant at 10%. Moreover, the third lag is more important than the first lag in terms of statistical significance. In the HS model with one lag, the ECB forecast for GDP is positive and statistically significant, as is the interaction between the ECB forecast for GDP and the deviation of GDP. In the four-lags version of the model, the ECB forecast for GDP is only significant at 5% in one specification. The interaction between the ECB forecast for GDP and the deviation of GDP is significant at 10%. The third lag is again more relevant than the first lag.
In the CJ model for the European monetary union topic with one lag, no variable is significant. However, in the model with four lags, the third lag is significant at 1%, and Fed funds become statistically significant at between 5% and 10%. In the HS model with one lag, the ECB forecast for inflation is significant at 5% only in the first specification. Inflation deviation and the interaction between the ECB forecast for inflation and inflation deviation are significant at 5%, but the interaction is only so in one specification. The interaction between the ECB forecast for GDP and the deviation of GDP is significant at 10%. The first lag is the most relevant, even though the third lag is significant at 10% in some specifications. The HS model results in a similar picture, except that the interaction between the ECB forecast for inflation and inflation deviation decreases its significance from 5% to 10%.
The CJ model for the FIPS topic with one lag leads to only Fed funds being significant at 10% in only one specification. Adding the other three lags increases the R-squared from 0.45 to 0.55. The third lag is statistically significant, rather than the one lag version. The Fed funds are significant at 5% in the first specification and 10% in the second specification. However, in the HS model with one lag the ECB forecast for inflation is significant at 5% in the first specification and the interaction between the ECB forecast for GDP and deviation of GDP is significant at 10%. In the HS model with four lags, both the first and the third lags are highly significant. The only variable that is significant at 10% is the interaction between the ECB forecast for GDP and deviation of GDP.
4.6.2. Results of estimations of the multinomial probit model
The multinomial probit model employs the topic CMPFootnote15 as a base outcome to normalize the location of the latent variable. The results (Table A17) are, as expected, in terms of the significance of the first lag of the dependent variable on the NMP topic. The ECB forecasts for inflation have a negative and significant effect at 5% on the NMP topic. The ECB forecasts for GDP growth have weak negative significant effects on the topic FSBS at 10%. These results confirm the importance of the inflation forecast in the ECB communication reaction function and that extracting separate topics lets us analyze how each of these topics reacts to different variables.
5. Discussion of the results
Some of our results can be connected with the literature reviewed in the paper. The findings of Hartmann and Smets (Citation2018) for example at the variable level are that both the inflation forecasts and GDP forecasts are significant for determining the interest rate of the ECB. However, as we showed in this paper, the relevance depends on the topic under discussion. The significance and positive relationship with economic activity in the findings of Gerlach (Citation2007) can be connected with the results of the CMP topic. The output is indeed important for the ECB (Carstensen, Citation2006) but only for some particular topics, not in general. However, the weakness of the results from the robustness checks means that conclusive results cannot be drawn.
As demonstrated by Baranowski et al. (Citation2021), the decisions regarding interest rates and the communications issued by central banks can be regarded as interchangeable components. Consequently, it is clear that the content of central bank communications, including the topics covered, exhibits a relationship with the variables influencing their policy reaction functions. These communications serve as means by which central banks implicitly inform the private sector about their policy reaction functions, aiming to shape their expectations (Baranowski et al., Citation2021; Casiraghi & Perez, Citation2022).
Casiraghi and Perez (Citation2022) explicitly outlines how effective communication can elucidate the policy reaction function and policy frameworks for policymakers, ultimately enhancing the execution of monetary policy by the central bank. Examining whether the topics covered are indeed connected to the variables within the central bank's policy reaction functions underscores the European Central Bank’s adherence to sound practices proposed by Casiraghi and Perez (Citation2022), who emphasize that determining ‘what’ the central bank should communicate precedes considerations of ‘how’ it should be delivered and the policies implemented should be consistent with the communications of the central bank. Furthermore, Ehrmann et al. (Citation2022) reveal that akin to other central banks like the Federal Reserve, the central bank's policy function is an essential ‘topic’ to convey, alongside discussions of risk and uncertainty.
With the findings for specific topics, Paloviita et al. (Citation2020) similarly find two topics on monetary policy in ECB communication. We observe that financial stability is frequently mentioned in the speeches of the ECB, particularly in times of crisis. Although its relevance has decreased in other years, it remains a fundamental topic of discussion for the ECB. Not surprisingly, financial variables like credit growth gain increasing importance at the ECB when it is necessary to intervene on issues related to financial stability and the banking system. Additionally, the relevance and significance of the federal funds for certain topics confirm that the ECB follows closely the communication and the actions of the Federal Reserve. This is also shown in a recent paper by Priola et al. (Citation2020). It can be noticed that the increased relevance of non-standard monetary policies after the financial crisis confirms the findings of Bohl et al. (Citation2022). As expected, the oil price is important when we observe the topic of non-standard monetary policy, and it is the only variable that remains significant, when the ZLB dummy is introduced. Overall, the ZLB dummy is extremely important for all the topics except the topic of financial stability. The CRISIS dummy meanwhile is highly significant in all the topics. Not surprisingly, the ECB generally prefers its forecasts, as was also in Cour-Thimann and Jung (Citation2021b).
The results of the multinomial probit model confirm the importance of the ECB forecast for its monetary policy. This is in line with the primary mandate of the ECB to keep inflation stable. Our paper, along with the topic analysis, confirms that monetary policy and price stability remain a central part of ECB communication, but we also observe how secondary objectives and financial stability have become more important since the Great Recession and the European sovereign debt crisis, even if they remain subordinated to the primary objective. The importance of non-standard monetary policies in recent years is a consequence of this hierarchy. It is worth noting that the deviation from the inflation target appears to be more relevant for non-standard monetary policy, which has become more important in recent years than it is for canonical monetary policy. This is consistent with the mandate of the ECB, in broad terms, and its communications. Analyzing topic indices in this environment makes clear the kind of information that the ECB is collecting to address both its primary and secondary objectives. This detailed analysis would not have been possible without using topics extracted by the LDA process, since the effects of the different variables on different ECB topics would remain hidden in more comprehensive communication indices.
6. Conclusions
Our results show how the topic indices extracted from the speeches of the ECB can provide a more detailed analysis than studies based on discrete dependent variables or simple tone indices can. These indices also give new insights into the communication reaction functions of central banks. We highlight in our findings how some results can be masked if the communication function is estimated in a single or, at most, a double dimension. Instead, we make a positive contribution by extracting topic indices, which allows us to observe the impact of the significant variables on all the aspects of the communication reaction function.
We observe how certain topics, like NMP, are more impacted by external factors like oil prices and inflation. Conversely, other subjects, like FSBS, are more affected by other metrics, such as credit growth. We note that the ECB regularly discusses financial stability in its speeches, especially during the crisis. Even though the importance of the topic has diminished in the last few years, the ECB still discusses it as a key issue. Furthermore, the fact that federal funds are relevant and significant for specific topics validates that the ECB closely monitors the Federal Reserve's communications and activities. It is evident that non-standard monetary policies have become more relevant following the crisis. Our paper confirms that price stability continues to be central to ECB communication, but we also note that, even though they are still secondary goals, financial stability has grown in significance.
However, some limitations remain. It is not always straightforward to interpret the signs of coefficients, for instance. The positive relationship between credit growth and issues related to financial stability is clear, but explaining the sign of how GDP forecasts relate to the topic of financial stability is not easy. To explain this relationship, more financial variables need to be introduced. Some are suggested in Rivolta (Citation2018).
There is also a risk of misspecifications arising from the possible presence of nonlinearity, and asymmetry of the loss function of the ECB (Cour-Thimann & Jung, Citation2021b; Paloviita et al., Citation2020). Although our indices mean we do not have to work with ordered probit models as in Cour-Thimann and Jung (Citation2021b), we still estimate probit models in our robustness checks and find that identifying the most significant topic for each quarter can help in combining econometric methods and topic modelling and so tackle these issues to some extent.
Some statistical problems should be noted as well. Most of the indices do not pass the Dicky-Fuller test so there is a possible problem of non-stationarity. However, transforming the data by log-differencing could cause a loss of correlation between the indices and the independent variables, and it could also make the final results very complex to interpret.
It may finally be noted for the text mining aspects that using the LDA prototype method of Rieger et al. (Citation2020) could improve the method of choosing the number of topics, but combining that with the literature on economic indices (Gabrielyan et al., Citation2019; Thorsrud, Citation2020) requires more research and deeper analysis.
Supplemental Material
Download PDF (455 KB)Acknowledgements
We wish to thank Jaan Masso, Lenno Uusküla, Dmitry Kulikov, Alari Paulus, Karsten Staehr, Orsolya Soosaar, Michael Rose, and Anastasia Sinitsyna for their reviews and their valuable comments on previous versions of the paper. We are extremely grateful to the Research Division of the Bank of Estonia for the incredible help we received in completing this paper. We would also like to thank Shakshi Sharma and Rajesh Sharma for their contribution to solving important issues related to the paper. We are indebted to Philippine Cour-Thimann and Alexander Jung for sending us some of their data and providing very useful comments. Lastly, we want to thank our colleagues at the University of Tartu for their suggestions.
Disclosure statement
No potential conflict of interest was reported by the author(s).
Additional information
Funding
Notes on contributors
Luca Alfieri
Luca Alfieri is a PhD student at the university of Tartu and PostDoc at Politecnico di Milano. His research interests include forecasting, time series analysts, machine learning applications in macroeconomics, and remote working.
Diana Gabrielyan
Diana Gabrielyan is a PhD student at the university of Tartu. Her research interests include inflation forecasting, time series analysts and machine learning applications in macroeconomics.
Notes
1 The term n-grams in text analysis is used for two or more words that are consecutive and have a specific meaning in the texts. When n is 2, the sequence is called a bigram and when n is 3, the sequence is called a trigram.
2 The list is available upon request.
3 A typical score used in LDA as shown in Blei et al. (Citation2003). We specifically use the log-perplexity method provided by Python's gensim package.
4 As a coherence score, we employ the one suggested by Röder et al. (Citation2015). The perplexity score measures how well the natural language processing-based probability model can predict a sample. The perplexity score is the inverse probability of the test set normalized by the number of words in the same set. The lower the level of perplexity is, the better the model is. The coherence score meanwhile measures the degree of semantic similarity between the most important words in a specific topic, or in other words, how good a topic model is in generation topics that are coherent.
5 To construct we use the Mallet package in Python.
6 The models without TF-IDF use a standard document-term matrix with unigrams and bigrams (see ). The combination of LDA with the TF-IDF is tested to observe any possible increase in the precision of LDA in separating the topics.
7 More information on LDA can be found in Appendix 1.
8 Aggregating the speeches by quarter and directly creating quarterly indices leads to problems with the LDA in disentangling the topics, given the inferior number of documents available. Codes with the attempts at this approach are available on request.
9 We adapt the model to quarterly data. The differences in time arise from when the ECB gets new information on the independent variables.
10 The interactions are inserted in order to see potential asymmetries in the responses of ECB as observed in Hartmann and Smets (Citation2018). For the authors, the ECB appears to respond to anticipated slowdowns in growth by easing the monetary policy and anticipated inflation over its inflation target primarily by tightening the monetary policy.
11 Armelius et al. (Citation2020) show the importance of the FED as a ‘leading spillover generator’ among central banks through its communications. For Priola et al. (Citation2021) this leading role increased after the Great Recession.
12 See Mirkov and Natvik (Citation2016)
13 Pearson correlation estimations suggest a strong correlation between the EMUG and CMP topics (0.71). We observe that these topics were quite important in the same timeframe. Other variables have correlations smaller than 0.5. Results are available upon request.
14 Available upon request
15 Usually, the base outcome is the most frequent one. In our case, this is the CMP topic.
References
- Angelini, E., Lalik, M., Lenza, M., & Paredes, J. (2019). Mind the gap: A multi-country BVAR benchmark for the eurosystem projections. International Journal of Forecasting, 35(4), 1658–1668. https://doi.org/10.1016/j.ijforecast.2018.12.004
- Armelius, H., Bertsch, C., Hull, I., & Zhang, X. (2020). Spread the word: International spillovers from central bank communication. Journal of International Money and Finance, 103, Article 102116. https://doi.org/10.1016/j.jimonfin.2019.102116
- Baranowski, P., Doryń, W., Łyziak, T., & Stanisławska, E. (2021). Words and deeds in managing expectations: Empirical evidence from an inflation targeting economy. Economic Modelling, 95, 49–67. https://doi.org/10.1016/j.econmod.2020.12.003
- Bennani, H., Fanta, N., Gertler, P., & Horvath, R. (2020). Does central bank communication signal future monetary policy in a (post)-crisis era? The case of the ECB. Journal of International Money and Finance, 104, Article 102167. https://doi.org/10.1016/j.jimonfin.2020.102167
- Blei, D. M., & Lafferty, J. D. (2009). Topic models. Text Mining: Classification, Clustering, and Applications, 10(71), 34.
- Blei, D. M., Ng, A. Y., & Jordan, M. I. (2003). Latent dirichlet allocation. Journal of Machine Learning Research, 3(Jan), 993–1022.
- Bohl, M. T., Kanelis, D., & Siklos, P. L. (2022, February). How central bank mandates influence content and tone of communication over time. Center for Quantitative Economics (CQE), University of Muenster, Working paper n. 9622. Retrieved from https://www.wiwi.uni-muenster.de/me/sites/me/files/Veroeffentlichungen/working_paper_96_bohl_kanelis_siklos.pdf.
- Carstensen, K. (2006). Estimating the ECB policy reaction function. German Economic Review, 7(1), 1–34. https://doi.org/10.1111/j.1468-0475.2006.00145.x
- Casiraghi, M., & Perez, L. P. (2022, January). Central bank communications. IMF Monetary and Capital Markets Department – Technical Assistance Handbook – Monetary Policy Frameworks. Retrieved from https://www.imf.org/-/media/Files/Publications/Miscellaneous/English/2022/mcm-technical-assistance-handbook/central-bank-communications.ashx.
- Clarida, R., Galı, J., & Gertler, M. (1998). Monetary policy rules in practice: Some international evidence. European Economic Review, 42(6), 1033–1067. https://doi.org/10.1016/S0014-2921(98)00016-6
- Cour-Thimann, P., & Jung, A. (2021a, September). Does the ECB's Monetary Policy React to the Balance of Risks? SUERF Policy Brief, No 176.
- Cour-Thimann, P., & Jung, A. (2021b). Interest-rate setting and communication at the ECB in its first twenty years. European Journal of Political Economy, 70, Article 102039. https://doi.org/10.1016/j.ejpoleco.2021.102039
- Dieijen, M., & Lumsdaine, R. L. (2019). What say they about their mandate? A textual assessment of federal reserve speeches.
- ECB (2019). Speeches dataset. retrieved March 27, from https://www.ecb.europa.eu/press/key/html/downloads.en.html.
- Ehrmann, M., & Fratzscher, M. (2009). Explaining monetary policy in press conferences. International Journal of Central Banking, 5(2), 42–84.
- Ehrmann, M., Holton, S., Kedan, D., & Phelan, G. (2022). Monetary policy communication: Perspectives from former policymakers at the ECB. Journal of Money, Credit and Banking forthcoming. https://doi.org/10.1111/jmcb.13054
- El-Shagi, M., & Jung, A. (2015). Has the publication of minutes helped markets to predict the monetary policy decisions of the Bank of England's MPC? ECB Working Paper 1808, Frakfurt.
- Gabrielyan, D., Masso, J., & Uusküla, L. (2019). Mining news data for the measurement and prediction of inflation expectations. In International conference on time series and forecasting (pp. 253–271). Springer.
- Geman, S., & Geman, D. (1984). Stochastic relaxation, gibbs distributions, and the Bayesian restoration of images. IEEE Transactions on Pattern Analysis and Machine Intelligence, PAMI-6(6), 721–741. https://doi.org/10.1109/TPAMI.1984.4767596
- Gerlach, S. (2007). Interest rate setting by the ECB, 1999–2006: Words and deeds. International Journal of Central Banking, 3(3), 1–46.
- Gerlach, S., & Lewis, J. (2014). ECB reaction functions and the Crisis of 2008. International Journal of Central Banking, 10(1), 137–157.
- Gosselin, P., Lotz, A., & Wyplosz, C. (2008). The expected interest rate path: Alignment of expectations vs. Creative Opacity. International Journal of Central Banking, 4(3), 145–185.
- Griffiths, T. L., & Steyvers, M. (2004). Finding scientific topics. Proceedings of the National Academy of Sciences, 101(suppl 1), 5228–5235. https://doi.org/10.1073/pnas.0307752101
- Gu, C., Chen, D., Stan, R., & Shen, A. (2022). It is not just what you say, but how you say it: Why tonality matters in central bank communication. Journal of Empirical Finance, 68, 216–231. https://doi.org/10.1016/j.jempfin.2022.07.008
- Hanifi, R., Istrefi, K., & Penalver, A. (2022, December). Central bank communication of uncertainty. Bank of France, Working paper n. 898.
- Hansen, S., & McMahon, M. (2016). Shocking language: Understanding the macroeconomic effects of central bank communication. Journal of International Economics, 99(Suppl. 1), S114–S133. https://doi.org/10.1016/j.jinteco.2015.12.008
- Hansen, S., McMahon, M., & Tong, M. (2019). The long-run information effect of central bank communication. Journal of Monetary Economics, 108, 185–202. https://doi.org/10.1016/j.jmoneco.2019.09.002
- Hartmann, P., & Smets, F. (2018). The first twenty years of the European Central Bank: Monetary policy. ECB Working Paper 2219, Frakfurt.
- Hendry, S., & Madeley, A. (2010). Text mining and the information content of bank of canada communications. Bank of Canada Working Papers, Vol. 31, Ottawa. https://www.banqueducanada.ca/wp-content/uploads/2010/11/wp10-31.pdf.
- Jensen, J. L. W. V. (1906). Sur les Fonctions Convexes et les Inégalités entre les Valeurs Moyennes. Acta Mathematica, 30, 175–193. https://doi.org/10.1007/BF02418571
- Kaminskas, R., Stukas, M., & Jurksas, L. (2021). ECB communication: What is it telling us? Bank of Lithuania iscussion Paper Series 25, Vilnius.
- Klejdysz, J., & Lumsdaine, R. L. (2023). Shifts in ECB communication: A textual analysis of the press conferences (Vol 19, No. 2).
- Lehtimäki, J. O., & Palmu, M. (2019). Central bank communication and monetary policy predictability under uncertain economic conditions. Journal of Central Banking Theory and Practice, 8(2), 5–32. https://doi.org/10.2478/jcbtp-2019-0011
- Lin, J., Mei, Z., Chen, L., & Zhu, C. (2023). Is the People's Bank of China consistent in words and deeds?. China Economic Review, 78, Article 101919. https://doi.org/10.1016/j.chieco.2023.101919
- Mirkov, N., & Natvik, G. J. (2016). Announcements of interest rate forecasts: Do policymakers stick to them?. Journal of Money, Credit and Banking, 48(5), 901–920. https://doi.org/10.1111/jmcb.2016.48.issue-5
- Orphanides, A. (2001). Monetary policy rules based on real-Time data. American Economic Review, 91(4), 964–985. https://doi.org/10.1257/aer.91.4.964
- Orphanides, A. (2003). Historical monetary policy analysis and the Taylor rule. Journal of Monetary Economics, 50(5), 983–1022. https://doi.org/10.1016/S0304-3932(03)00065-5
- Orphanides, A. (2011). Monetary policy lessons from the Crisis. In Handbook of central banking, financial regulation and supervision (pp. 30–65). Edward Elgar Publishing.
- Orphanides, A., & Wieland, V. (2013). Complexity and monetary policy. International Journal of Central Banking, 9(1), 167–203.
- Paloviita, M., Haavio, M., Jalasjoki, P., & Kilponen, J. (2020). Reading between the lines-using text analysis to estimate the loss function of the ECB. Bank of Finland Research Discussion Paper 12, Helsinki.
- Priola, M. P., Lorenzini, P., Tizzanini, G., & Zicchino, L. (2020). Measuring central banks' sentiment and its spillover effects with a network approach. In International conference on applications of natural language to information systems. http://doi.org/10.2139/ssrn.3764004
- Priola, M. P., Lorenzini, P., Tizzanini, G., & Zicchino, L. (2021). Measuring central banks' sentiment and its spillover effects with a network approach.
- Rieger, J., Rahnenführer, J., & Jentsch, C. (2020). Improving latent dirichlet allocation: On reliability of the novel method LDAPrototype. In International conference on applications of natural language to information systems (pp. 118–125). NLDB. https://link.springer.com/book/10.1007/978-3-030-51310-8
- Rivolta, G. (2018). Potential ECB reaction functions with time-varying parameters: An assessment. Empirical Economics, 55(4), 1425–1473. https://doi.org/10.1007/s00181-017-1337-z
- Röder, M., Both, A., & Hinneburg, A. (2015). Exploring the space of topic coherence measures. In Proceedings of the eighth ACM international conference on web search and data mining (pp. 399–408). ACM.
- Salton, G., & Harman, D. (2003). Information retrieval. In Encyclopedia of computer science (pp. 858–863). John Wiley and Sons Ltd.
- Shannon, C. E. (1948). A mathematical theory of communication. The Bell System Technical Journal, 27(3), 379–423. https://doi.org/10.1002/bltj.1948.27.issue-3
- Sievert, C., & Shirley, K. (2014). LDAvis: A method for visualizing and interpreting topics. In Proceedings of the workshop on interactive language learning, visualization, and interfaces (pp. 63–70). Association for Computational Linguistics.
- Taylor, J. B. (1993). Discretion versus policy rules in practice. In Carnegie-rochester conference series on public policy (Vol. 39, pp. 195–214). Elsevier.
- Thorsrud, L. A. (2020). Words are the new numbers: A newsy coincident index of the business cycle. Journal of Business & Economic Statistics, 38(2), 1–17.
- Tobback, E., Nardelli, S., & Martens, D. (2017). Between hawks and doves: Measuring central bank communication. Working Paper Series 2085, European Central Bank.
- Zahner, J. (2021). Essays on natural language processing and central banking [PhD thesis]. University of Marburg. Retrieved from https://archiv.ub.uni-marburg.de/diss/z2021/0497/pdf/djz.pdf.