
Big data and machine learning updates

Some colleagues recently attended the PESA Python for Geoscience workshop https://pesa.com.au/events/pesa-qld-online-course-introduction-to-python-for-geoscience-2023/2023-08-15/. Sydney University’s Nathaniel Butterworth showed the (relative) ease with which users can now analyse enormous amounts of data. While traditional exploration and GIS programs can display many layers simultaneously, trying to spot intersecting areas of interest may be difficult. Machine learning, and it’s dreaded “data driven” models, can cut some of that time involved.
As we all juggle spreadsheets, a database or two, something for cross sections, a math programming language or specialist geochemistry plots, something to make a picture of drill holes in 3D and more and more, we all see the need to combine more aspects of geoscience.
The number of datasets publicly available is extraordinary and growing. Universities, state surveys, GA and CSIRO pump out mountains of company, research and government collected data each year. NCI/AuScope/ARDC 2030 Geophysics Data Collection Project at ANU spearheads the file types required for large scale analysis https://ardc.edu.au/project/2030-geophysics-collections/. Python opens the door to accessing this data all at once.
An appeal of the (free) Python high level programming language is that it inherently deals with file handling and text parsing and downloads extras (packages) allowing almost any data manipulation. The Panda package seamlessly transforms text and number columns for the NumPy package to crunch matrix operations. Web services allows Python to call data in from web sites on the fly so explorers can compare their geological setting with similar targets around the world.
Machine Learning then assesses the relationship strength between all layers with known occurrences () and pinpoints where more occurrences might be ().
Figure 1. Bar chart plot of most the significant input features associated with a mineral occurrence taken from Sydney Informatics Hub Python for the Geoscience 2023 Python workshop.
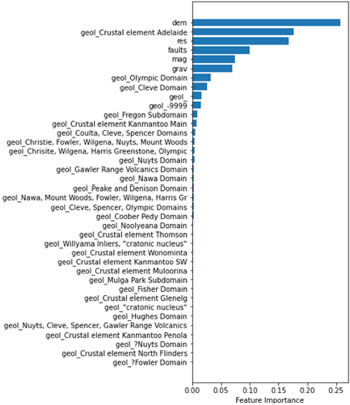
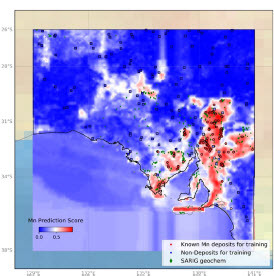
Figure 2. Heat map of graduated statistical affinity with known manganese occurrences, map courtesy of Gary Reed of Geological Survey of South Australia.
This is the oft maligned data driven version of machine learning (everything in) as opposed to knowledge driven (use chosen influences). But to paraphrase Sam Altman (CEO of OpenAI), engineers believe humans cannot see as much as electronic sensors, so let the algorithms paint their picture and critique their thinking https://www.youtube.com/watch?v=L_Guz73e6fw. Oz Minerals found this approach useful to question exploration bias due to classical deposit models https://www.youtube.com/watch?v=uLqKODrPsUU.
Why does elevation have the highest correlation with occurrences in South Australia? Probably because there have been nearly two centuries of exploration and fossicking in the close to home, well-populated Adelaide Geosyncline, instead of the hard-to-explore desert regions. But then, orogenies accumulate minerals and increase elevation. OK, can areas of past and present orogeny be visualised to illustrate expected similarities? This is why Oz Minerals called the process a game of geological Battleships™ testing ideas.
Coding is not everyone’s cup of tea, so workflows offered by the likes of ANU allow simpler loading and filtering https://opus.nci.org.au/display/DAE/Geophysics. No doubt Mr Altman’s ChatGPT could soon be commanded with “here is my exploration tenement, analyse for mineral exploration”.