
Abstract
Introduction
Spirometry is the gold standard for COPD diagnosis and severity determination, but is technique-dependent, nonspecific, and requires administration by a trained healthcare professional. There is a need for a fast, reliable, and precise alternative diagnostic test. This study’s aim was to use interpretable machine learning to diagnose COPD and assess severity using 75-second carbon dioxide (CO2) breath records captured with TidalSense’s N-TidalTM capnometer.
Method
For COPD diagnosis, machine learning algorithms were trained and evaluated on 294 COPD (including GOLD stages 1–4) and 705 non-COPD participants. A logistic regression model was also trained to distinguish GOLD 1 from GOLD 4 COPD with the output probability used as an index of severity.
Results
The best diagnostic model achieved an AUROC of 0.890, sensitivity of 0.771, specificity of 0.850 and positive predictive value (PPV) of 0.834. Evaluating performance on all test capnograms that were confidently ruled in or out yielded PPV of 0.930 and NPV of 0.890. The severity determination model yielded an AUROC of 0.980, sensitivity of 0.958, specificity of 0.961 and PPV of 0.958 in distinguishing GOLD 1 from GOLD 4. Output probabilities from the severity determination model produced a correlation of 0.71 with percentage predicted FEV1.
Conclusion
The N-TidalTM device could be used alongside interpretable machine learning as an accurate, point-of-care diagnostic test for COPD, particularly in primary care as a rapid rule-in or rule-out test. N-TidalTM also could be effective in monitoring disease progression, providing a possible alternative to spirometry for disease monitoring.
Introduction
According to the World Health Organisation in 2020, Chronic Obstructive Pulmonary Disease (COPD) was the third leading cause of mortality, accounting for 6% of global deaths [Citation1]. It is estimated that the prevalence of COPD is growing, with the number of people receiving a COPD diagnosis in the UK alone increasing by 27% in the past 10 years [Citation2]. This trend is only set to increase over the next decade [Citation3].
Currently a cure for COPD does not exist [Citation4]. Therefore, early diagnosis and treatment is key to prevent disease progression, improve quality of life, reduce exacerbations, and limit the economic burden associated with management of the disease [Citation5, Citation6]. Spirometry is the current gold standard for diagnosis and COPD severity determination, but it relies heavily upon a patient’s ability to exhale forcefully. There is also a widespread shortage of trained healthcare professionals able to perform quality-assured spirometry and its use remains limited in some areas due to the associated risk of an aerosol-generating cough. In addition, spirometry has been shown to be ineffective at screening for early cases [Citation7]. It has been estimated that in the UK, only between 9.4% and 22% of those with COPD have been diagnosed [Citation8], in part due to spirometry’s poor precision of only 63% [Citation9]. The global shortage of adequately trained staff and protracted waiting lists for spirometry have resulted in the Lancet Commission recognising that diagnostics must move beyond spirometry [Citation10].
Capnography is a widely used technique in critical care and anaesthesia. Previous work has demonstrated that the geometry of time and volumetric capnograms can be used to identify physiologic patterns associated with respiratory diseases such as COPD [Citation11, Citation12]. In particular, Abid et al. [Citation13] achieved an area under the receiver operating characteristic curve (AUROC) of 0.99 when differentiating COPD from healthy capnograms using classical machine learning techniques, while Murray et al. [Citation14] achieved an accuracy of 81% in differentiating COPD from congestive heart failure. Both studies used features derived from accurate mechanistic models of airflow fitted to the capnograms, to differentiate COPD from a single condition.
Furthermore, a previous study by Talker et al. [Citation15] showed that features derived from high-resolution time capnograms recorded using TidalSense’s N-TidalTM device can be used to accurately differentiate severe COPD from a variety of other lung conditions, achieving an AUROC of 0.99. This suggested that machine learning in conjunction with high-resolution time capnography could be an appealing alternative to spirometry for diagnosis. The COPD diagnosis element of the present study built upon the aforementioned analysis by adding patients with less severe COPD to the dataset, increasing the resulting model’s real-world applicability.
The objective of the present study was to apply interpretable machine learning techniques to capnography data recorded by the N-TidalTM device across five clinical studies and evaluate the performance of the diagnostic and severity classifiers. The primary aim was to construct a classifier that could distinguish capnograms of patients with varying severities of COPD (GOLD stage 1–4) from those without COPD. A secondary aim was to develop an alternative severity index to percentage predicted FEV1 that could be used as an aid by clinicians to quantify COPD severity. The potential advantages of using the N-TidalTM device in the context of COPD diagnosis include: the capture of CO2 data from tidal breathing for improved ease of use and absence of aerosol-generating cough; immediate transmission of data to the cloud via 2 G or 4 G; the speed of administration of the test (under five minutes); and an automated diagnostic output not reliant on specialist training [Citation15]. These advantages could extend to using the device for severity determination and could be helpful clinically in monitoring disease progression.
Methods
Studies
The capnography data used for this analysis were collected from five different longitudinal observational studies, namely CBRS, CBRS2, GBRS, ABRS and CARES. A summary of each of these studies containing their objectives, participant information and inclusion/exclusion criteria can be found in the supplementary material. These studies, and therefore the dataset used in this analysis, included patients with COPD (GOLD stage 1–4), asthma, heart failure, pneumonia, breathing pattern disorder, motor neuron disease, sleep apnoea, bronchiectasis, pulmonary fibrosis, tracheobronchomalacia, anaemia, lung cancer, long COVID-19, general upper airway obstruction, extrinsic allergic alveolitis, as well as healthy participants. The heterogeneity of diseases present in the dataset ensured the resultant model’s generalisability to a real-world diagnostic scenario, where patients would be expected to present with a variety of cardiorespiratory and other conditions that have similar initial symptoms.
In patients with COPD, diagnoses were made according to NICE guidelines. COPD severity (GOLD stage 1-4) was determined from the percentage predicted FEV1 of the subset of COPD patients where spirometry was available. Diagnostic criteria used for other conditions, including asthma, are in the supplementary material. Potential participants were identified in outpatient clinics, inpatient wards, primary care and secondary care clinics according to each study’s protocol before undergoing a screening process with the study team to assess their suitability.
Alongside the five studies noted above, capnography data was collected from 72 volunteers without any respiratory disease between December 2015 and May 2022. These healthy volunteers provided written informed consent and were screened by a doctor to ensure they did not have any confounding cardiorespiratory disease or other comorbidities. All subjects across the five studies gave informed consent, and their data was handled according to all relevant data protection legislation, including the EU/UK General Data Protection Regulation (GDPR).
Ethical approval was obtained from the South Central Berkshire Research Ethics Committee (REC) for GBRS and ABRS, the Yorkshire and the Humber REC for CBRS and CARES, and the West Midlands Solihull REC for CBRS2.
Procedure
In all studies, capnography data was collected using the N-TidalTM device, a CE-marked medical device regulated in the UK and EU. N-TidalTM has been designed to take accurate, reliable recordings of respired pressure of CO2 (pCO2) directly from the mouth. It is unique in its ability to accurately measure pCO2 from ambient/background CO2 to hypercapnic levels in exhaled breath through unforced tidal breathing with a fast response time, meaning that quick changes in the geometry of the pCO2 waveform are captured.
For all data, CO2 was sampled at 10 kHz and reported at 50 Hz providing a level of resolution not possible with alternative capnometers. This resolution was critical to the machine learning models’ ability to use subtle geometric features of the waveform to distinguish capnograms [Citation16].
Study participants were given an N-TidalTM device to take home after completing training on the correct operation and storage of the device. Capnography data was serially collected twice daily for varying lengths of time ranging from 2 weeks up to 12 months according to each study’s protocol. Following startup, the device performed a 60 s warm-up sequence that included a process to zero the output CO2 trace to the background level. Patients then performed normal tidal breathing through the N-TidalTM device for 75 s using a mouthpiece in an effort-independent process. A single episode of use (breath recording) produced a single capnogram, with each respiratory cycle (inspiration and expiration) forming a single waveform. In addition to capnometry data, the following data was also collected from the majority of participants on all five studies: basic demographics, spirometry, smoking history, comorbidities and medications. Some of this information was used in conjunction with capnography data in subsequent analysis. Other clinical and questionnaire data varied across studies (see supplementary material). Personal data was pseudonymised in accordance with GDPR. All analysis was performed retrospectively, after data collection for the studies had been completed.
Feature engineering
Raw pCO2 data collected in each breath recording was first denoised then separated into breaths, each of which was then segmented into its constituent phases. At this point, breaths that were anomalous and could not be processed were excluded from subsequent processing and analysis using a set of proprietary rules built into the N-TidalTM cloud platform. An overview of the preprocessing pipeline can be found in .
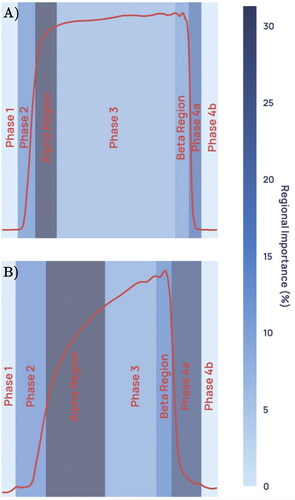
To generate features for machine learning classification, two categories of information were captured: geometric characteristics of the waveform associated with each breath (referred to as ‘per breath features’); and features of the whole capnogram, such as respiratory rate or maximum end-tidal CO2 (ETCO2), referred to as ‘whole capnogram features’. More information on the types of features calculated can be found in the supplementary material, and an example capnographic waveform with illustrated phases and angles can be found in .
Any breaths where the full feature set could not be calculated were also automatically excluded from analysis, and further checks were carried out manually to ensure that all condensation-compromised breaths had been excluded by automated methods.
Machine learning
Following pre-processing and waveform parameterisation, a reduced number of capnograms were randomly selected for each participant in the dataset such that the COPD and non-COPD cohorts had the same number of capnograms. Then, each machine learning model was trained and evaluated using a nested cross-validation scheme (see supplementary material for more information).
For the present study, the models selected were all simple classical machine learning algorithms, in contrast to the more complex deep-learning architectures used for many machine learning applications. The distinct advantage of many simpler algorithms is their interpretability, allowing direct visibility of the weights the model is assigning to each input feature. Interpretability in this context is defined as a measure of the transparency of an algorithm’s inner workings, and therefore the ability to understand cause and effect between individual features and the model output. This is imperative to ensure that the model is using characteristics of the waveform that have a plausible basis in respiratory physiology, without being influenced by possible confounding factors in the training data. ‘Black-box’ methods like neural-networks have been observed to produce models based largely on confounding data. For example, a neural-network developed to screen x-rays used information such as the scanner’s exact position relative to the patient to detect pneumonia [Citation17]. In this situation, having full visibility of the model’s inner workings may have allowed the developers to notice that the model’s most important features were not radiological features which would plausibly have been expected to be associated with pneumonia. Furthermore, in cases where patterns in the training data are fairly simple and features are pre-calculated, classical machine learning methods can be just as effective as deep-learning.
Furthermore, the ability to extract the model weight assigned to each input feature is useful in describing how the model made its decision to the end user – also known as explainability. This allows, for example, the visualisation of the phases of the capnograph that contributed most to each of the models’ decisions.
COPD diagnosis
N-TidalTM capnographic features were used to train three different machine learning algorithms: logistic regression (LR); extreme gradient boosted trees (XGBoost); and a support vector machine (SVM). LR and XGBoost were chosen as they are very different in their approach to training, yet similarly interpretable – they both provide direct visibility of the weights the model is using. SVM with radial basis function (RBF) kernel was chosen as the non-linear classical learning algorithm that is less interpretable but often maximises supervised performance.
Model performance was delineated into performance on each of the most commonly presenting diseases in the non-COPD class and each severity in the COPD class. The impact of the most prevalent comorbidities on model performance was assessed for participants with comorbidities in addition to COPD, to investigate the model’s analogy to a real-world use case where testing on patients with COPD and additional comorbidities is likely to be common. The most significant features driving model learning were extracted to understand which areas of the capnogram waveform were most predictive of COPD.
Severity determination
A proposed method for severity determination was to train a machine learning classifier to distinguish between participants with GOLD 1 and GOLD 4 COPD and use the probability of having GOLD 4 output by this model as an indication of COPD severity. This ‘severity index’ would indicate where on the spectrum between mild and very severe COPD a patient falls. When testing on unseen patients of all severities, the output probability distribution for GOLD 2 and GOLD 3 patients would be expected to fall in between the distributions for GOLD 1 and GOLD 4, and for a patient’s probability output (severity index) to steadily increase as their disease progresses.
Given the small number of patients available for this analysis and the predominance of comorbidities, especially among GOLD 1 patients (25/47 patients), this analysis was conducted after removing comorbid patients from the dataset. This was so the machine learning model would be able to more effectively infer the underlying signal of COPD severity without the potential confounder of comorbidities.
Following model training, the distribution of each COPD severity in the model’s probability output was investigated, and random waveforms from adjoining severity classes were inspected to explore the probability output’s efficacy as a tool for severity determination. To investigate the relationship between traditional spirometric methods and the proposed model probability severity indication, each patient’s severity model probability output was plotted against their paired percentage predicted FEV1 value and a correlation was calculated.
Results
Between 6 December 2015 and 8 December 2022, 115,053 capnograms were collected from 1114 patients. On average, each patient collected 103 capnograms over 57 days. Demographic data for the preprocessed and class-balanced machine learning dataset were collated ().
Table 1. Demographic information from the five studies and the separate healthy volunteer cohort. Categorical data are given as a number with its percentage of the total (n (%)). continuous data given as (median (Q1-Q3)). for the COPD classification dataset, smoking history and pack years were absent for 82 and 281 participants respectively. For the severity determination dataset, smoking history and pack years were absent for 2 and 16 participants respectively.
COPD diagnosis
All performance statistics were obtained using a decision boundary of 0.5 on the models’ probability outputs. In classifying COPD vs non-COPD participants, the support vector machine (SVM) marginally showed the best performance, with accuracy, AUROC, sensitivity, specificity, NPV and PPV at 0.811, 0.890, 0.771, 0.850, 0.792 and 0.834 respectively (). Model performance was consistent between iterations (); all three algorithms had a standard deviation of less than 0.03 in accuracy over the five folds. These metrics were produced from the aggregated predictions on all five unseen outer-loop test sets, while the standard deviation describes the variation of model performance between the five outer-loop test sets and gives an indication of model generalisability. As performance for all models was extremely similar, further analysis is only presented for the LR model, as it is the most interpretable. Receiver operating characteristic (ROC) and precision-recall curves for this model are shown in .
Table 2. Aggregated machine learning model performance on all 5 unseen outer-loop test sets, for each of the three models built: logistic regression (LR), extreme gradient boosted trees (XGBoost), and support vector machine (SVM) with an RBF kernel.
outlines LR model performance of the most commonly presenting primary diseases in the non-COPD class and each GOLD severity in the COPD class. The COPD (no severity label) category consisted of patients who were exhibiting symptoms, had received a diagnosis of COPD, but who were missing spirometry from their electronic health record. Therefore, GOLD stage for these patients could not be determined. Subjects with emphysema were diagnosed using spirometry and CT scans. Comorbid COPD patients have been included in the performance statistics for their respective COPD severity. Notably high performance was seen in classifying healthy participants and those with asthma, breathing pattern disorder, and GOLD 2-4 COPD, while lower performance was seen in those with heart failure and GOLD 1 COPD.
Table 3. Accuracy of COPD/non-COPD diagnosis for most commonly presenting disease groups and all COPD severities, over all five outer-loop test sets.
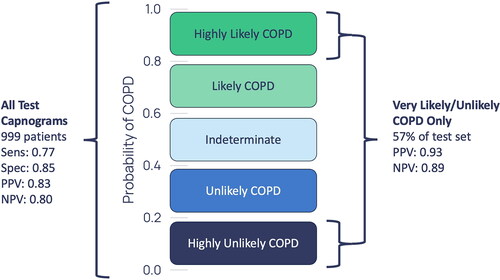
shows the diagnostic performance for the capnograms with a greater than 0.8 and less than 0.2 probability of COPD. These are capnograms that have been classified with high confidence by the model.
Figure 1. High-level overview of the data processing pipeline applied to the fast-response CO2 data collected through the N- TidalTM device.
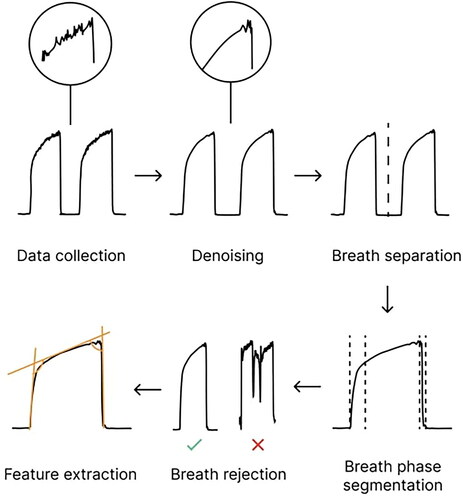
Figure 2. Illustration of a capnogram waveform and its phases and angles. Phase 1 is the inspiratory baseline, Phase 2 is the expiratory upstroke (representing the first phase of exhalation), Phase 3 is the expiratory plateau (representing the majority of exhalation), Phase 4a is the inspiratory downstroke (representing the first phase of inhalation), and Phase 4b is the inspiratory baseline. Note that the start of Phase 1 and the end of Phase 4b may technically be considered part of the same phase.
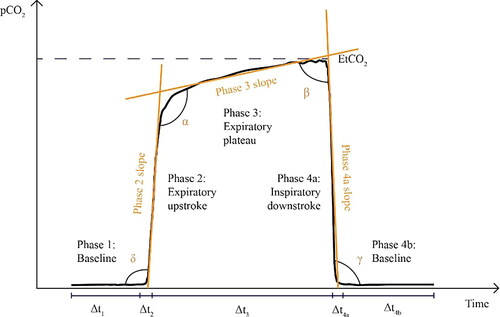
Figure 3. (A) Receiver operating characteristic (ROC) curve for the LR model, reported with results of a theoretical ‘random’ classifier with no predictive power. (B) Precision-Recall Curve for the LR model, reported with the results of a theoretical ‘random classifier’ and the average precision (AP).
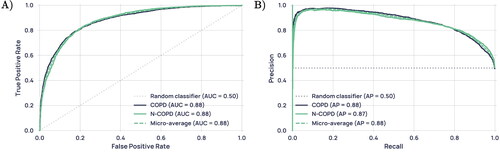
Figure 4. Diagnostic performance on the full test set and the highly confident regions only.
To investigate how comorbidities impacted the accuracy of COPD classification, COPD patients were grouped according to the most prevalent comorbidities and the performance was assessed for each of these groups ().
Table 4. Diagnostic accuracy and standard deviation across test-sets for the most prevalent COPD comorbidities. Comorbid COPD patients who had bronchiectasis/HF/long COVID/pneumonia and other lung conditions were placed in the COPD and other(s) category.
An evaluation of the predictive model was conducted to identify which capnogram features best distinguished patients with and without COPD. The relative feature importances for driving learning in the LR model were determined and the region of the capnogram waveform from which the features were extracted was used to construct the importance map for non-COPD and COPD waveforms in . The heatmap value of each region represents an average of the weighted feature importance for that region, across all features located in that region. The weighted feature importance is calculated as the standardised value for that feature multiplied by the average feature importance over all training folds. Features associated with the alpha region of the capnogram waveform as well as phase 4a (the inspiratory downstroke) were found to be the most important drivers of learning.
Figure 5. Average weighted feature importance by capnogram waveform region, where weighted features were calculated as the magnitude of the product of the standardised feature value and the feature importance. (A) shows an example for a non-COPD waveform, and (B) shows an example for a COPD waveform.
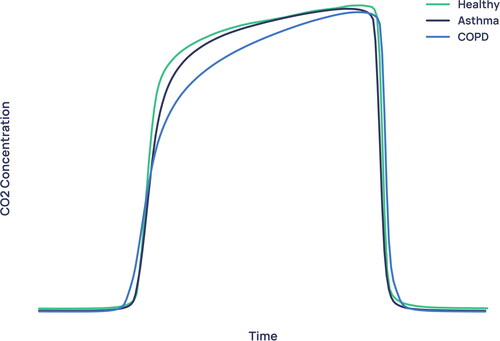
The average waveforms for healthy, asthma and COPD patients in the dataset (median of every viable breath recorded for that condition, normalised in CO2 concentration and time) are shown in . By far the greatest difference between healthy/asthma and COPD is in the alpha angle region, corroborating the result of .
Figure 6. Capnogram waveforms averaged across all healthy, asthma and COPD subjects in the dataset and normalised to equal width and height.
Severity determination
Classification was performed using only logistic regression in this analysis due to its simplicity, explainability and since logistic regression was shown in the COPD diagnostic task to be as accurate as non-linear models.
All performance statistics were obtained using a decision boundary of 0.5 on the models’ probability outputs. The classification model trained to distinguish GOLD 1 from GOLD 4 participants achieved an accuracy of 0.959 ± 0·039, an AUROC of 0.980 ± 0·013, a sensitivity of 0.958 ± 0·051, a specificity of 0.961 ± 0·045, NPV of 0.961 ± 0·047, and PPV of 0.958 ± 0·039, where the standard deviation describes the variability of performance on the unseen outer-loop test sets across the five folds.
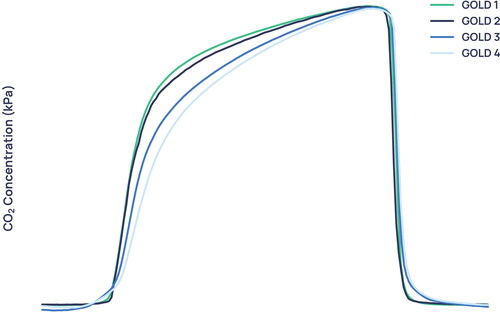
Manual inspection of the average capnogram waveform of each GOLD severity () demonstrates that greatest visual difference between severities is seen in the transition between the expiratory upstroke and expiratory plateau, along with marked differences in the beta region and in the phase 2/4a regions. In addition, it can be seen that the difference in the average waveform between the GOLD 1 and GOLD 2 waveforms is slight compared to the difference between GOLD 2 and GOLD 3.
The model that gave the median accuracy on the unseen outer-loop test set of the five folds was chosen for further analysis. It was used to output prediction probability for all GOLD 2 and GOLD 3 patients’ capnograms, the remainder of GOLD 1 and GOLD 4 capnograms belonging to patients who were unseen for this particular model, as well as all comorbid COPD patients whose severity could be inferred from percentage predicted FEV1. are the result of this process. shows the average waveforms of two GOLD 1 and two GOLD 2 capnograms. For each severity, one capnogram with probability close to or below the lower quartile was chosen and one capnogram with probability close to or above the upper quartile was randomly chosen.
Figure 7. Boxplot showing the distribution of each GOLD stage in the severity model’s probability output.
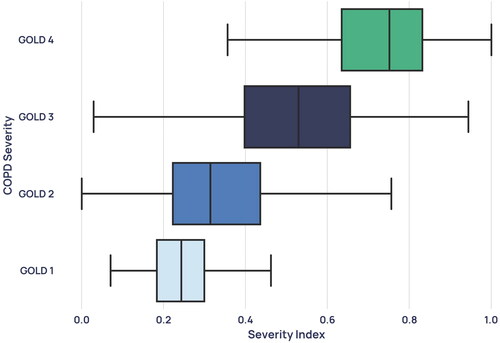
Figure 8. Average waveforms, where (A) and (B) are two GOLD 1 examples with the corresponding confidences and (C) and (D) show two GOLD 2 examples with the corresponding confidences. (A) and (C) are examples with low prediction confidence for their severity and (B) and (D) are examples with high prediction confidence for their severity.
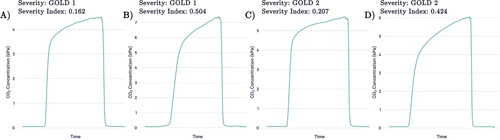
Figure 9. Capnogram waveforms averaged across all patients of each severity in the dataset and normalised to equal width and height.
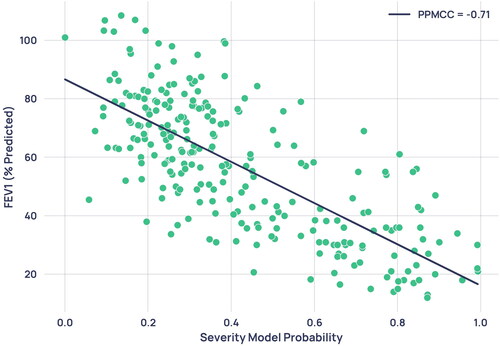
To understand the relationship between the standard spirometric indication for COPD severity and the severity index developed in this paper, the percentage predicted FEV1 for each participant was correlated with the severity model output probability for all 224 patients with paired spirometry (spirometry taken on the same day as a capnogram), unless the paired capnogram was used for training. This data was plotted in , where the linear relationship gave a Pearson’s product moment correlation coefficient (PPMCC) of −0.71.
Figure 10. Scatterplot of severity model output probability against percentage predicted FEV1 from paired spirometry data. Each point represents a single paired capnogram. The correlation coefficient was -0.71.
shows the distribution of each GOLD severity in the severity model’s probability output, including capnograms that were unpaired with spirometry. These unpaired capnograms were designated the severity given by the patient’s median percentage predicted FEV1 measurement.
Discussion
Model robustness
For the diagnostic task, the best performing model over the five unseen outer-loop test sets was the support vector machine (SVM), with a class-balanced AUROC of 0.811 ± 0·022 and positive predictive value (PPV) of 0·834 ± 0·015. The robustness of the diagnostic models was demonstrated through the similar performances of all three algorithms, showing a strong signal in the data itself; the small difference between training set and testing set diagnostic accuracy (0.819 vs 0.809 for logistic regression, for example); and the low variability of performance across different test sets, showing the model’s generalisability to a true clinical scenario. See supplementary material for more details.
Interpretability and waveform features driving learning
The identified features () contributing most to the logistic regression model’s decision were from the α angle region, which characterises the rate at which gas from the upper airways (CO2-poor) gives way to mixed alveolar gas from the lower airways (CO2-rich). A larger α angle corresponds to greater airway resistance, likely due to an obstructed bronchospastic airway or alveolar damage associated with emphysema. The most important features driving learning in both the diagnostic and severity models were identified to be features describing the geometry of the breath, such as angles, gradients, curvatures, and coefficients of non-linear fits to various capnographic phases. Features describing absolute values, such as the values of CO2 at various points on the breath and the durations of various capnographic phases, performed poorly by contrast.
shows the average waveforms across the entire diagnostic dataset for healthy, asthma and COPD subjects. The largest difference between the COPD waveform and both non-COPD waveforms can be seen in the alpha angle region, where the COPD waveform exhibits a more ‘shark-fin’ like appearance. This is a shape characterised by a large α angle and more slanted expiratory plateau. The shark-fin type waveform is known to arise both from differences in alveolar compliance causing different time constants of gas movement from the alveoli to the sensor, and from bronchial obstruction. The changes in compliance arise because of the airway remodelling that occurs in COPD. This changes the rate of transition of gas from alveoli to anatomical dead space (i.e. the expiratory upstroke). This physiological trait of COPD and its resulting effect on the alpha angle and expiratory upstroke explains why the models were driven primarily by features describing waveform geometry, as opposed to absolute values such as end-tidal CO2 or exhalation duration. Asthma exhibits a waveform that falls in between healthy and COPD subjects, with a larger alpha angle than healthy subjects but tighter curvature in the alpha angle region than in COPD. In much of the literature using low-resolution capnometers, asthmatic obstruction has been equally associated with the more rounded ‘shark-fin’ [Citation18]. We hypothesise that N-TidalTM can more accurately show differences between asthma and COPD capnograms due to its fast and accurate sampling, which is especially important in resolving differences between conditions in fast transition regions such as the alpha angle.
For severity determination, the high correlation of 0.71 between the model’s probability output and the current standard for spirometric severity determination, percentage predicted FEV1, indicates the physiological plausibility of the severity index in describing the progression of COPD pathology.
shows the average waveforms for each COPD severity. It is observed that the more severe forms of COPD exhibit an even stronger ‘shark-fin’ like shape. Notably, the average waveforms of GOLD 1 and GOLD 2 waveforms are extremely similar, with greater distinction between GOLD 2/GOLD 3, and GOLD 3/GOLD 4 waveforms. This similarity is reflected in the probability distributions of the mild and moderate severity groups (), which overlap more than severe and very severe patients do. One possible cause for the conflation of the two severities in our dataset is that GOLD 1 COPD in particular is heavily underdiagnosed using the current standard [Citation7], and rates of misdiagnosis are also high. Therefore, misdiagnosed GOLD 1 patients in the dataset who actually had a different obstructive lung condition could have distorted the resultant average waveform, and the patients who do truly have GOLD 1 COPD were likely to be on the more severe end.
There is a subset of mild COPD patients who exhibit a “shark-fin” like waveform that resembles more severe COPD - such as example B in . It is becoming more widely accepted that percentage predicted FEV1 alone does not effectively represent the functional impairment experienced by individual patients [Citation19], a fact that catalysed the introduction of GOLD’s ABCD and ABE systems of severity classification. It is therefore possible that high-resolution capnography is able to identify a severity signal in COPD that correlates more closely to clinical outcomes. This hypothesis would explain why GOLD 1 waveforms with “shark-fin” shapes, such as example B in , were given a capnographic severity index that was higher than most GOLD 2 and many GOLD 3 participants. To verify this hypothesis, further analysis would be required to examine the clinical outcomes of patients who are given a higher severity index than their GOLD status would suggest.
Diagnostic performance and model bias
Tidal breathing capnography has previously been used to good effect for the differentiation of COPD from healthy and congestive heart failure subjects [Citation12–14]. However, to the authors’ best knowledge, there has been no work from outside this research group on the use of tidal breathing capnography to differentiate COPD from a variety of ‘non-COPD’ conditions that could present with a similar set of clinical symptoms to COPD.
The classification performance for commonly presenting disease groups with suspicion of COPD and all COPD severities on the diagnostic task can be found in . The performance of various categories of comorbid COPD patients can be found in . A previous study by Talker et al. [Citation15] found that the highest performing cohorts had capnograms at the extremities of a square-shaped healthy waveform with smaller α angle and flatter expiratory plateau, or highly shark-fin-like waveforms with larger α angle and steeper expiratory plateau for COPD. These cohorts perform similarly well in this analysis, with the Healthy, GOLD 3 and GOLD 4 groups all scoring at or above approximately 90% in classification accuracy. While GOLD 2 COPD also performed well (0.815), the GOLD 1 COPD cohort performed significantly worse (0.616). Mean pack years for the misclassified and correctly classified GOLD 1 patients were 14.4 and 27.3 years respectively (Mann–Whitney U = 16152, p = 1 × 10⁻¹³, two-tailed), which could suggest that the rate of mislabelling in the misclassified cohort was much higher.
Other factors that may have contributed to this result include the high prevalence of confounding comorbidities in this group (25/47 GOLD 1 patients) and that the COPD signal is weaker in GOLD 1 patients and therefore more easily confused with other conditions. A lower performance than expected was also seen in the smaller COPD group that did not have spirometry from which severity could be inferred. Several factors may have contributed to this poorer performance. First, this cohort had the highest prevalence of comorbidities among all of the disease/severity groups (31/55 patients), which could have confounded classification. Second, the lack of spirometry data from these patients means that it cannot be definitely concluded that these patients were diagnosed with the aid of spirometry. This significantly increases the likelihood of noise in the disease labels for this cohort and could therefore explain lower diagnostic performance.
Notably, the classification accuracies of the asthma group (0.839) and the COPD & asthma comorbidity group (0.771) were both high, suggesting the model can effectively identify the COPD component in asthma-COPD overlap and distinguish it from pure asthma. While performance in classifying comorbid patients with COPD & Heart Failure was extremely high (0.971), performance in classifying pure Heart Failure as non-COPD was significantly lower (0.661). It is possible that a portion of cases labelled as pure Heart Failure were the result of undiagnosed COPD, which can cause right-sided heart failure by inducing pulmonary hypertension through low blood oxygen levels [Citation20]. The mean pack years of 16.2 in the pure Heart Failure group, significantly higher than the mean of 6.3 in the non-COPD cohort overall, corroborates this.
Reassuringly, there was no significant association between prediction accuracy and demographic features including age, birth sex, and body mass index (BMI) through non-parametric statistical testing (see supplementary material), indicating that there is no systematic bias in model performance with respect to demographic data collected on the studies. Further analysis to investigate the effect of BMI on COPD prediction probability and capnographic features of obstruction reinforced the earlier finding that it does not have a significant effect on COPD classification (see supplementary material). The weak correlation found between obstructive features and BMI in participants with COPD may support previous research postulating the so-called ‘obesity paradox’. This phenomenon refers to the clinical finding that BMI correlates positively with pulmonary function [Citation21], and that low BMI is a risk factor for accelerated lung function decline, whilst high BMI has a protective effect in COPD patients [Citation22]. However, a larger sample of patients with a high BMI would be required to more accurately investigate this signal in obstructive features captured on the N-TidalTM.
Potential clinical applications
When presented with the capnogram of a new patient, the diagnostic model presented above outputs a probability of COPD. Rather than relying on individual clinicians to interpret what is a novel, AI-derived diagnostic output, it could be clinically useful to create categories of model confidence (). For instance, those above a probability threshold of COPD of 0.8 could be said to be in a ‘highly likely’ category since the PPV associated with this group is 0.93 - patients within this group could potentially be immediately diagnosed with COPD and appropriate treatment initiated. Conversely, patients with a probability of under 0.2 could be said to be in a ‘highly unlikely’ category with an NPV of 0.89. Patients in this group could be said to have had COPD ‘ruled out’ and therefore alternative explanations for their presenting symptoms could be sought. Since the N-TidalTM device relies on 75 s of normal tidal breathing, this categorisation could be achieved at the point of care, in primary care.
Furthermore, the ability to rapidly identify those likely to have severe or very severe disease could ensure these patients receive prompt, intensive support (such as pulmonary rehabilitation or timely escalation of therapy as appropriate). The continuous severity index offered by N-TidalTM could also offer an alternative method to monitor disease progression. At a time when healthcare services even in high income countries can struggle to provide sufficient quality-assured spirometry to meet the clinical need, N-TidalTM could alleviate the demand for further lung function testing for COPD for a significant portion of patients. Widespread use would be contingent on a sufficient evidence base to warrant inclusion in clinical guidelines. In middle and low income settings where quality assured spirometry is likely to remain out of reach of the majority of the population, N-TidalTM could also be a potential solution.
Limitations and further scope for work
The analysis presented in this study has a number of limitations. First, simpler machine learning models were used in keeping with the National Health Service Artificial Intelligence recommendations regarding algorithmic explainability [Citation23]. This limitation will likely be exacerbated as the size of high-resolution capnography datasets increase and more opportunities to explore more complex fits to the data arise.
Second, ground-truth labels could only be obtained using current diagnostic pathways, known to have their shortcomings and inaccuracies. This is especially true for the less severe COPD patients that were included in this paper, whose rate of misdiagnosis is likely higher than GOLD 3 and 4 COPD patients. In addition, the GOLD severity labels used for this analysis were not provided by clinicians, but were inferred solely from percentage predicted FEV1 readings of patients with a diagnosis of COPD. In reality, other factors such as number of exacerbations per year, general respiratory symptoms and smoking history would likely also be taken into account when determining an overall impression of severity. For example, exacerbation frequency and symptom burden forms an integral part of GOLD’s ABE severity assessment tool. It is therefore possible that a misclassification or anomalous severity model output probability of a participant from one of the models presented in this article could be caused by mislabelling or misdiagnosis, particularly when considering the GOLD 1 COPD cohort.
The present investigation was purely focused on investigating the possible use of fast-response capnography alone to determine the presence or absence of COPD and, where present, establish its severity. It therefore did not factor symptoms, imaging data, smoking history or exacerbation frequency into the diagnosis or severity determination models (except for obtaining disease labels for training the models, according to the current diagnostic standard). It is possible that the inclusion of this data alongside capnography could improve general diagnostic performance as well as classification of worse-performing conditions such as GOLD 1 COPD and heart failure. Recent work has promoted the inclusion of imaging as well as symptoms, environmental exposure and spirometry in the definition of COPD [Citation24]. Inclusion of this data could also allow the severity determination method to give a more holistic picture of COPD severity, increasing its ability to predict exacerbation and mortality,. Future longitudinal studies using the N-TidalTM device will collect more detailed symptom, exacerbation, smoking and CT imaging data, which may allow these improvements to be made in diagnosis and severity determination.
The number of patients used to evaluate the diagnostic performance of comorbid patients () is small, and further testing is required to strengthen these findings. The small sample size of the severity determination cohort and resultant removal of comorbid patients is another limitation, and, alongside the probably significant rate of GOLD 1 misclassification, decreases certainty on the model’s practicability. It will be possible to build on this work by collecting capnography data from more COPD patients, alongside severity labels that have been provided by clinicians based on spirometry that has been contextualised by the rest of the patient’s clinical history and CT scans. This will enhance label accuracy. Further evidence will be gathered using an improved labelling method to investigate the effectiveness of capnography as an indicator of severity and predictor of deterioration in COPD patients – this will help determine if it can be used more widely used to assist in pharmacological and non-pharmacological treatment decisions.
Furthermore, it is possible that the variety of disease data collected over the five studies and volunteer healthy cohort may fail to cover the full heterogeneity of lung conditions that would be encountered in a real-world clinical setting, limiting generalisability.
Investigating patients who exhibit spirometric patterns (such as preserved ratio impaired spirometry, PRISm) that may predispose patients to later COPD diagnosis or higher mortality, would be an interesting avenue to explore. While the present investigation did not include any healthy participants who exhibited PRISm, planned studies will explore whether high-resolution capnography can detect a signal in patients with this spirometric pattern.
Finally, the widespread use of N-TidalTM in a real-world setting depends on its ability to offer health economic benefit in comparison to existing diagnostic practice. This data will be collected in subsequent work looking at the deployment of N-TidalTM in diagnostic pathways.
Regardless, the proposed methods managed to distinguish on capnography alone (without supplementary data such as smoking history), between participants with COPD and those with a range of plausible differential diagnoses for common symptoms of COPD (including healthy volunteers), demonstrating its potential clinical benefit.
In summary, we demonstrate that the N-TidalTM fast-response capnometer and cloud analytics pipeline can perform real-time geometric waveform analysis and machine-learning-based classification to diagnose all severities of COPD. In contrast to commonly used ‘black box’ machine learning methodologies, a set of interpretable methods were used that can provide traceability for machine diagnosis back to individual geometric features of the pCO2 waveform and their associated physiological properties suggestive of obstructive airways disease. In addition, the probability output of a separate machine learning model could be used as an alternative severity index for COPD using the N-TidalTM device, with the interpretability of the implemented machine learning techniques providing a picture of COPD patients’ capnographic progression from GOLD 1 through GOLD 4.
Ethics approval and consent to participate
All participants consented to participate. Further details can be found on the National Library of Medicine’s Clinical Trial website for CBRS (NCT02814253), GBRS (NCT03356288), CBRS2 (NCT03615365), ABRS (NCT04504838) and CARES (NCT04939558).
Declaration of interest
LT, CD, ABS, JCC, HB, RHL, GL, AXP are currently employed, or were employed/funded at the time of the research, by TidalSense Limited. GH and HFA are funded by the National Institute for Health Research (NIHR) Community Healthcare MedTech and In Vitro Diagnostics Co-operative at Oxford Health NHS Foundation Trust. The views expressed in this publication are those of the author(s) and not necessarily those of the NHS, the NIHR or the Department of Health and Social Care.
Supplemental Material
Download PDF (890.7 KB)Availability of data and materials
The datasets generated during and/or analysed during the current study are not publicly available for data protection reasons.
Additional information
Funding
References
- World Health Organisation. The top 10 causes of death, 2020.
- British Lung Foundation. Chronic obstructive pulmonary disease (COPD) statistics, 2012.
- Khakban A, Sin DD, FitzGerald JM, et al. The projected epidemic of chronic obstructive pulmonary disease hospitalizations over the next 15 years. a population-based perspective. Am J Respir Crit Care Med. 2017;195(3):1–14. doi: 10.1164/rccm.201606-1162PP.
- NHS UK. Chronic obstructive pulmonary disease (COPD) - treatment,2017.
- Peter MA, Calverley JA, Anderson B, et al. Salmeterol and fluticasone propionate and survival in chronic obstructive pulmonary disease 2007.
- American Lung Association. Copd trends brief - burden, 2019.
- Qaseem A, Snow V, Shekelle P, et al. Diagnosis and management of stable chronic obstructive pulmonary disease: a clinical practice guideline from the American College of Physicians. Ann Intern Med. 2007;147(9):633–638.
- Bednarek M, Maciejewski J, Wozniak M, et al. Prevalence, severity and underdiagnosis of COPD in the primary care setting. Thorax. 2008;63(5):402–407. doi: 10.1136/thx.2007.085456.
- Schneider A, Gindner L, Tilemann L, et al. Diagnostic accuracy of spirometry in primary care. BMC Pulm Med. 2009;9(1):31. doi: 10.1186/1471-2466-9-31.
- Stolz D, Mkorombindo T, Schumann DM, et al. Towards the elimination of chronic obstructive pulmonary disease: a lancet commission. Lancet. 2022;400(10356):921–972. doi: 10.1016/S0140-6736(22)01273-9.
- Jaffe MB. Using the features of the time and volumetric capnogram for classification and prediction. J Clin Monit Comput.2017;31(1):19–41. doi: 10.1007/s10877-016-9830-z.
- Mieloszyk RJ, Verghese GC, Deitch K, et al. Automated quantitative analysis of capnogram shape for COPD–normal and COPD–CHF classification. IEEE Trans Biomed Eng. 2014;61(12):2882–2890. doi: 10.1109/TBME.2014.2332954.
- Abid A, Mieloszyk RJ, Verghese GC, et al. “Model-based estimation of respiratory parameters from capnography, with application to diagnosing obstructive lung disease,” in IEEE Trans Biomed Eng. 2017;64(12):2957–2967. doi: 10.1109/TBME.2017.2699972.
- Murray EK, You CX, Verghese GC, et al. Low-order mechanistic models for volumetric and temporal capnography: development, validation, and application. IEEE Trans Biomed Eng. 2023;70(9):2710–2721. doi: 10.1109/TBME.2023.3262764.
- Talker L, Neville D, Wiffen L,, et al. Machine diagnosis of chronic obstructive pulmonary disease using a novel fast-response capnometer. Respir Res. 2023;24(1):150. doi: 10.1186/s12931-023-02460-z.
- Bate SR, Jugg B, Rutter S, et al. N-Tidal C: a portable, handheld device for assessing respiratory performance and injury. AJRCCM Conferences. 2018; A74 Respiratory health: Altitude, environmental exposures, and rehabilitation: A2371. doi: 10.1164/ajrccm-conference.2018.197.1_MeetingAbstracts.A2371.
- Cutillo CM, Sharma KR, Foschini L, et al. Machine intelligence in healthcare-perspectives on trustworthiness, explainability, usability, and transparency. NPJ Digit Med. 2020;3(1):47. doi: 10.1038/s41746-020-0254-2.
- Howe TA, Jaalam K, Ahmad R, et al. The use of end-tidal capnography to monitor non-Intubated patients presenting with acute exacerbation of asthma in the emergency department. J Emerg Med. 2011;41 (6):581–589. doi: 10.1016/j.jemermed.2008.10.017.
- Lange P, Halpin DM, O’Donnell DE, et al. Diagnosis, assessment, and phenotyping of copd: beyond fev1. Int J Chron Obstruct Pulmon Dis. 2016;11 Spec Iss(Spec Iss):3–12. Spec Iss)):
- Cardiovascular Institute of the South. COPD and heart failure: what are the symptoms and how are they related?. 2017.
- Wu Z, Yang D, Ge Z, et al. Body mass index of patients with chronic obstructive pulmonary disease is associated with pulmonary function and exacerbations: a retrospective real world research. J Thorac Dis. 2018;10(8):5086–5099. doi: 10.21037/jtd.2018.08.67.
- Sun Y, Milne S, Jaw JE, et al. BMI is associated with FEV1 decline in chronic obstructive pulmonary disease: a meta-analysis of clinical trials. Respir Res. 2019;20(1):236. doi: 10.1186/s12931-019-1209-5.
- Joshi I, Morley J. Artificial intelligence: how to get it right. putting policy into practice for safe data-driven innovation in health and care. 2019.
- Lowe KE, Regan EA, Anzueto A, et al. COPDGene® 2019: redefining the diagnosis of chronic obstructive pulmonary disease. Chronic Obstr Pulm Dis. 2019;6(5):384–399. doi: 10.15326/jcopdf.6.5.2019.0149.