
Abstract
To enlighten interactions between autologous, allogeneic or T-cells from patients after stem cell transplantation with leukaemia-derived-dendritic-cells containing dendritic cells or blast containing mononuclear cells (n = 21, respectively), we determined cytokine-concentrations (interleukin 2, 4, 6, 10, tumor-necrosis-factor-α, interferon-γ) in supernatants of mixed-lymphocyte-culture and in serum (n = 16) of 20 patients with acute myeloid leukaemia and three patients with myelodysplastic syndromes by cytometric-bead-assay. We correlated our data with lytic capabilities of stimulated T-cells in a fluorolysis-assay and clinical data:
Dendritic-cell-/mononuclear-cell-stimulation of T-cells resulted in increased cytokine-levels in culture-medium compared to serum. There were no significant differences between cytokine-patterns of cases with/without lytic T-cell-activity, response to immunotherapy (stem cell transplantation/donor-lymphocyte-infusion) or graft-versus-host-disease. However, some predictive cytokine-cut-off-values for antileukaemic T-cell-activity, patients’ response to immunotherapy and graft-versus-host-disease could be defined.
Cytokine-profiles alone, without functional assays, are no useful tool to predict antileukaemic T-cell-function, although they can indicate lytic T-cell-activity, patients’ response to immunotherapy and graft-versus-host-disease.
Introduction
Defective cell differentiation and clonal proliferation of myeloid precursor cells characterize acute myeloid leukaemia (AML) and Myelodysplastic Syndromes (MDS) (Giles et al. Citation2002). For both diseases, allogeneic stem cell transplantation (SCT) is the only potentially curative treatment option, although not successful in every case since relapses occur (Kolb et al. Citation2004). The success of SCT varies with leukaemia-related cytogenetic and molecular genetic changes, transplant sources (bone marrow, peripheral blood), donor types (matched related, unrelated), conditioning regimens (reduced-intensity, myeloablative), patients’ age and comorbidities etc. (Schmid et al. Citation2011; Savani et al. Citation2015). Meanwhile in AML, the outcome after allogeneic SCT from fully matched unrelated donors appears to be similar compared with allogeneic SCT from matched related donors. For example a long-term survival probability of 30% for AML patients with unfavourable cytogenetics receiving allogeneic SCT in first complete remission (CR) from matched unrelated donors and survival rates of 44% for allogeneic SCT from matched related donors have been published (Döhner et al. Citation2010). After reduced intensity SCT in AML in CR, relapse rates between 20% and 55% have been reported, being significantly higher than those observed after myeloablative conditioning (Schmid et al. Citation2011). Therapeutic donor lymphocyte infusions (DLI) applied in relapsed patients (pts) after SCT demonstrate the pivotal role of donor T-cells in anti-leukaemic reactions (Kolb et al. Citation1995; Schmid et al. Citation2006; Schmid et al. Citation2011; Schmetzer & Schmid Citation2012). However, graft-versus-host reactions (GVH) of donor T-cells directed against host tissue (e.g. HLA-) antigens can jeopardize the efficiency of SCT or relapse therapy (Kolb et al. Citation1995; Schmid et al. Citation2006; Ferrara et al. Citation2009; Schmid et al. Citation2011; Schmetzer & Schmid Citation2012). Since cytokines, interleukin-1 (IL-1), interleukin-2 (IL-2), interleukin-6 (IL-6), interleukin-10 (IL-10), tumor-necrosis-factor-α (TNF-α) and interferon-γ (IFN-γ) in particular, are a main part of the pathophysiology of GVHD, they can be monitored and/or used to develop therapeutic strategies (Ferrara et al. Citation2009).
An interesting immunotherapeutic option to treat cancer and leukaemia are dendritic cell (DC) based strategies (Claxton et al. Citation2001; Roddie et al. Citation2006). DCs are antigen presenting cells (APC) that stimulate a variety of cells both of the innate and adaptive immune systems (e.g. naive/CD4+ T- and B-cells). Moreover they are essential to stimulate CD8+ cytotoxic T-lymphocytes (CTL) (Brossart Citation2002; Galea-Lauri et al. Citation2002; Schmetzer & Schmid Citation2012). We and others could generate leukaemia derived DC (DCleu) by transforming leukaemic cells from every given AML-patient in vitro directly to mature APC co-presenting ‘DC’-typical antigens (DCA, e.g. CD40, CD86) using the best of three previously tested DC-generating methods (Choudhury et al. Citation1999; Stripecke et al. Citation2002; Kremser et al. Citation2010; Dreyßig et al. Citation2011; Schmetzer & Schmid Citation2012). Accordingly, we could show that autologous T-cells obtained from AML-pts or allogeneic donor T-cells can be stimulated by DCleu resulting in a very efficient lysis of naive blasts. However, T-cell stimulation with these DCleu-containing DC (‘DC’) and even more with blast-containing MNC (‘MNC’) can also result in anergic T-cells or in blast proliferation (Liepert et al. Citation2010; Schmetzer & Schmid Citation2012). This could be due to cellular – (e.g. suppressor- or regulatory T-cells (Treg)) or soluble factors influencing antileukaemic T-cell effects (Roncarolo et al. Citation2011; Schmetzer & Schmid Citation2012). Autologous as well as allogeneic T-cells can also fail to eliminate tumor cells in vivo. Reasons for this failure are several immune escape mechanisms that allow tumor cells to escape their elimination. Some mechanisms are masked or downregulated antigens, an inhibitory microenvironment (soluble factors, cellular mechanisms (e.g. Treg)), deregulated apoptosis etc. (Gastman et al. Citation1999; Tait, Citation2000; Salih & Nussler Citation2001; Alhamarneh et al. Citation2008). Soluble factors, e.g. cytokines, released from immunocompetent cells, stromal cells or other cells influencing the microenvironment of cells or from tumor cells are known to mediate the function of immunocompetent cells or to influence immune escape of tumor cells. Especially, T helper cells (TH) can trigger the function of effector cells towards a pro-inflammatory/anti-tumor-response by inducing a TH1 cell response, mediated by cytokines like IL-2, IFN-γ and Lymphotoxin-α or towards a T-cell tolerance or anergy by inducing a TH2 cell response, mediated by cytokines such as IL-3, IL-4, IL-5, IL-9, IL-10 and IL-13 (Mosmann Citation1992; Romagnani Citation1992; Belardelli Citation1995). A preponderance of TH1 or TH2 cell cytokine levels might correlate with certain T-cell actions after ‘DC’- or ‘MNC’-stimulation of T-cells.
Major sources of IL-2 are the TH1 subsets of CD4+ T-cells in response to antigenic stimulation and T cytotoxic 1 (Tc1) CD8+ T-cells. As a potent T-cell growth factor IL-2 augments the proliferation of T-cells in response to T-cell receptor (TCR) stimulation including the generation of both cytotoxic and suppressor T-cells (Smith Citation1989).
IL-4, primarily secreted by TH2 cells, promotes the differentiation of myeloid cells towards DCleu and TH1 and TH2 cell differentiation and growth of CD4+ T-cells by inducing differentiation into TH2 cells and inhibiting cytokine production of TH1 cells e.g. of IFN-γ and thus favouring the generation of TH2 cells (Peleman et al. Citation1989; Parronchi et al. Citation1992). As a classical cytokine for a TH2 response leading to T-cell tolerance or anergy, high IL-4 levels might correlate with anergic T-cells after ‘DC’-stimulation. Accordingly, injection of IL-4 treated DC was associated with a decrease of the number of CD8+ T-cells and an impairment of their cytolytic activity in a murine model (King et al. Citation2001).
Various cell types, including T-cells and monocytes, secrete IL-6. It plays an important regulative role in haematopoiesis (Kishimoto Citation2010). IL-6 promotes activation, growth and differentiation of T-cells. IL-6 also induces differentiation of CTLs from CD8+ cells in the presence of IL-2 and enhances cytotoxic T-cell functions (Houssiau & Van Snick Citation1992; Kishimoto Citation2010). For this reason, high concentrations of IL-6 might indicate lytic activity of ‘DC’- or ‘MNC’-stimulated T-cells.
IL-10 is produced by activated T-cells, mainly TH2 and Tc2, monocytes, macrophages, NK-cells and many other cell types. It is generally regarded as an immunosuppressive cytokine (Moore Citation1993). Accordingly, in T-cells IL-10 blocks proliferation, induces anergy and stimulates the generation of suppressor type cells (Groux Citation1996). IL-10 also directly inhibits proliferation, receptor expression and APC functions of DC and other antigen presenting cells as monocytes and macrophages (Mazzolini et al. Citation2007). Therefore, high IL-10 levels might correlate with anergic T-cells and might explain unsuccessful ‘DC’-stimulation and a lack of anti-tumor activity of T-cells (Keilholz Citation2002). However, there are also data indicating that IL-10 may also stimulate tumor immunity (Keilholz Citation2002).
TH1 subsets of CD4+ cells, the Tc1 subsets of CD8+ T-cells, NK-cells, monocytes, DC etc. secrete IFN-γ, a typical cytokine of TH1 cells. CD4+ cells differentiate into TH1 cells in the presence of IFN-γ (Szabo et al. Citation1997; Yang et al. Citation2005). On TH2 cells IFN-γ exerts a direct antiproliferative effect and inhibits IL-4 production by undifferentiated T-cells after antigenic stimulation (Gajewski & Fitch Citation1990). In addition, IFN-γ promotes immunogenicity of tumor cells by enhancing MHC class I antigen processing and presentation and thereby increases the sensitivity of tumor cells to CTL activity (Yang et al. Citation2005).
TNF-α is a central pro-inflammatory cytokine, which is expressed by many different cell types such as macrophages, monocytes, NK-cells and T-cells (Tracey et al. Citation1989). Accordingly, high levels of TNF-α as well as high levels of IL-6 might correlate with lytic activity of ‘DC’ or ‘MNC’-stimulated T-cells.
It was shown that a prospective monitoring of IFN-γ and TNF-α might help to predict the onset of acute and chronic graft-versus-host-disease after allogeneic stem cell transplantation and could contribute to identify relapsed pts after SCT who could benefit from DLI-therapy (Yamamoto et al. Citation2004; Yang et al. Citation2005; Ritchie et al. Citation2005).
The aim of the present study was to characterize T-cell response patterns in the context of their cytokine release profiles of pivotal T-cell cytokines IL-2, IL-4, IL-6, IL-10, IFN-γ and TNF-α. Cytokine release profiles in serum of AML- and MDS-pts in acute phases of their diseases as well as in mixed lymphocyte culture (MLC) supernatants of ‘MNC’- or ‘DC’-stimulated autologous, allogeneic T-cells or T-cells from patients after stem cell transplantation were investigated to enlighten the interactions between blasts or DC with T-cells and to explain or predict specific anti-leukaemic or non-anti-leukaemic T-cell reactions. With these examinations, we hope to contribute to the understanding of anti-leukaemia-directed immunoreactions in AML and MDS.
Material and methods
Patients’ characteristics, diagnostics and sample collection
A total of 23 pts with either AML or MDS in active stages of the disease were included in the study. In detail, 20 pts suffered from AML (5 at first diagnosis, 4 in persisting disease, 4 at relapse before stem cell transplantation and 7 at relapse after stem cell transplantation) and 3 from MDS (2 at first diagnosis and 1 with persisting disease, ). The median age of AML-pts was 52 years (range 12 – 68 years) and 57 years (range 52 – 66 years) in MDS-pts. The female:male ratio in AML-pts was 2:3 and 1:2 in MDS-pts (data not shown). According to the French-American-British (FAB) classification 5 AML-pts suffered from an undifferentiated leukaemia (M0: n = 2, M1: n = 3), 6 pts from an immature granulocytic leukaemia (M2: n = 6, M3: n = 0), 7 pts from a monocytic leukaemia (M4: n = 4, M4eo: n = 1, M5: n = 2), 1 pt from an erythroid leukaemia (M6: n = 1) and 2 of the 3 MDS-pts from a RAEB and 1 from a CMML (Bennett et al. Citation1976; Hayhoe Citation1988). Diagnostic data were acquired from accredited laboratories of the pts’ treating institution. Cells were obtained by aspiration of peripheral blood (PB) or bone marrow (BM), which was anticoagulated with heparin after pts’ or stem cell donors’ informed consent. Whereas blast rich samples served for the generation of DC (see below) autologous pts’ or matched allogeneic stem cell donors’ MNC served as source for T-cells. The cellular composition of pts’ samples used for the generation of DC in uncultivated samples was on average 9% (CD3+) T-cells (range 1–33), 5% (CD56+) NK-cells (range 1–17%), 4% (CD19+) B-cells (range 1–17%) and 5% (CD14+) monocytes (range 1–19%).
Table 1. Characteristics of AML-/MDS-pts (age, gender, FAB-type, stages of the disease and response to immunotherapy) and samples used as stimulator cells (blast containing MNC or DCleu containing DC) or as effector cells (T-cells: allogeneic, autologous, after SCT) in mixed lymphocyte cultures.
Infections in pts at sample collection might influence cytokine release. In our pts’ cohort 4 pts with (clinically not remarkable) infections were included: One patient with moderate increase of C-reactive protein and unknown focus of infection (pt 419) and two patients suffering from atypical fungal pneumonia with lower activity of infection compared to typical bacterial pneumonia in both cases were included (pts 561, 565). One patient suffered from chronic liver aspergillosis with low activity of infection at sample collection (pt 428). Since cytokine concentrations in samples of pts with/without infections did not differ significantly (p ≥ .1), we included all samples in our analysis.
Dendritic cell generation
DC were generated from blast rich mononuclear cells (MNC) separated from whole blood samples by density gradient centrifugation using Ficoll-Hypaque (Biochrom, Berlin, Germany) with the previously described converting methods MCM-Mimic, Ca-Ionophore and Picibanil as described by us (Kremser et al. Citation2010; Dreyßig et al. Citation2011). On average, 16 ± 8% DC (range 10–30%) and 10 ± 10% DCleu (range 5–29%) could be generated from MNC of AML/MDS-pts using the best of the above mentioned converting methods (Grabrucker et al. Citation2010). The criteria for a successful generation of DC and DCleu were percentages above 10% DC and 5% DCleu detected in the suspension after DC generation as postulated previously by us (Kremser et al. Citation2010; Dreyßig et al. Citation2011).
Mixed lymphocyte culture (MLC)
T-cell sources for mixed lymphocyte cultures were autologous T-cells from AML-pts (‘autologous’, n = 10), allogeneic T-cells from healthy stem cell donors (‘matched allogeneic’, n = 11) or pts’ T-cells with mixed chimerism obtained at relapse after stem cell transplantation (‘after SCT’, n = 4). Those T-cells (CD3+), lateron used as effector cells, were positively isolated by MACS-technology, as described (Grabrucker et al. Citation2010; Liepert et al. Citation2010). 1 × 10⁶ T-cells each were cultured in 1 ml RPMI-1640 medium (Biochrom, Berlin, Germany) containing 15% human serum (PAA, Pasching, Austria) and 50 U/ml IL-2 (Proleukin R5, Chiron), stimulated and restimulated twice (day 3 and 6 of culture) with either 2.5 × 10⁴ irradiated (20Gy) AML/MDS DCleu containing DC (‘DC’) or with the same amount of irradiated (20Gy) AML/MDS blast containing MNC (‘MNC’). Half medium exchange was performed on day 3 and 6 of culture. Cells were harvested after 10 days of co-culture and the cytotoxicity fluorolysis assay was carried out as described (Kremser et al. Citation2010; Grabrucker et al. Citation2010).
Flow cytometry
Flow cytometric analyses were accomplished with a panel of mouse monoclonal antibodies (moAbs) purchased from Immunotech/Beckman Coultera (Krefeld, Germany), Becton Dickinsonb (Heidelberg, Germany), Caltagc (Hamburg, Germany), Serotechd (Düsseldorf, Germany), Invitrogene (Karlsruhe, Germany) and R&Df (Wiesbaden-Nordenstadt, Germany) directly conjugated with fluorescein isothiocyanate (FITC), phycoerythrin (PE), tandem CY5-PE-conjugation (PC7) or allophycocyanin (APC) to evaluate and quantify amounts and phenotypes of leukaemic cells, DCs, B-cells and T-cells in PB/BM samples. As FITC conjugated moAbs we used CD1bb, CD80ab, CD83a, CD86c, CD25a, CD3a, CD39d, CD45ROa and CD122d. As PE-conjugated moABs used were CD80a, CD83a, CD86bc, CD206a, CD4a, CD8b, CD73b, CD154a and CCR4f. As PC7-conjugated moABs were chosen CD1aa, CD40c, CD3a, CD4a, CCR7b, CD14a, CD116a and 7AAD. CD34ac, CD117a, CD33a, CD1aa, CD40c, CD206a CD3a, CD8b, CD25e, CD28b, CD45ROe, CD45RAa, CD137Lb, CD62Lb and CD71b were used as APC-conjugated moAbs.
For analysis and quantification of lymphocytes, monocytes and leukaemic blasts before culture the total MNC fraction was gated. Proportions of positive events in defined gates compared with the isotype controls were calculated using Cell Quest software (Becton Dickinson, BD, Heidelberg, Germany). Quantification and characterization of DC and DCleu were performed by Flow cytometry according to our gating strategy already described by former groups (Schmetzer et al. Citation2007; Kremser et al. Citation2010; Liepert et al. Citation2010; Grabrucker et al. Citation2010; Dreyßig et al. Citation2011). Flow cytometric analyses were carried out on day 0 and 10 followed by a functional cytotoxic fluorolysis assay on day 10 as described below.
Cytotoxicity fluorolysis assay
The lytic activity of effector T-cells was measured by a fluorolysis assay by counting viable blast target cells, labelled with specific fluorochrome labelled antibodies, before and after effector cell contact as described (Grabrucker et al. Citation2010). ‘DC’- or ‘MNC’-stimulated T-cells from healthy matched donors (n = 11), from AML-pts (autologous n = 10) or AML-pts after SCT (after SCT n = 4) as well as unstimulated T-cells as a control were co-cultured with thawn blasts as target cells for 4 or 24 h, as described. Before culture blast-target cells were stained for 15 min with two FITC- and/or PE-conjugated blast specific antibodies and subsequently co-cultured with effector cells. As a control, target and effector cells were cultured separately and mingled with T-cells shortly before FACS analysis. To evaluate amounts of viable (7AAD−) target cells and to quantify the cell-loss after 24 h of incubation time, cells were harvested, washed in PBS and resuspended in a FACS flow solution containing 7AAD (BD, Biosciences Pharmingen) and a defined number of Fluorosphere beads (Becton Dickinson, BD, Heidelberg, Germany). Viable cells were gated in a SSC/7AAD− gate and afterwards viable cells were quantified co-expressing the patient-specific blast phenotype by taking into account defined counts of calibration beads as described. Cells were analysed in a FACS Calibur Flow Cytometer using CELL Quest software (Becton Dickinson, BD, Heidelberg, Germany). The percentage of lysis was defined as the difference between proportions of viable blast before and after effector cell contact (Grabrucker et al. Citation2010).
Cytometric bead assay (CBA) for cytokine analysis
Cytokines were quantified using the BD TH1/TH2-CBA-kit II (Becton Dickinson, BD, Biosciences) in serum samples (n = 16), in supernatants collected in MLC before the first (‘DC’-stimulated: n = 21; ‘MNC’-stimulated n = 21) and second restimulation (‘DC’-stimulated: n = 21; ‘MNC‘-stimulated n = 19) with ‘DC’ or ‘MNC’ and after cell harvest (‘DC’-stimulated: n = 12; ‘MNC’-stimulated n = 12). In detail, 500μl serum or supernatants each were taken and stored at −80 °C until analysis. The TH1/TH2-CBA-kit II with antibodies for IL-2, IL-4, IL-6, IL-10, TNF-α and IFN-γ was used for analysis of serum samples and MLC-supernatants. As a control cytokine levels in cell culture media (RPMI +15% human serum, Biochrom, Berlin, Germany) without cells added were measured. Concentrations of IL-2 were not measured in cell culture media because it was added lateron to the cell suspension at the beginning and at restimulation of MLC. The standard serial dilutions of positive and negative controls of the respective cytokines were included. 50μl mixed human TH1/TH2 cytokine capture beads and 50μl PE Detection Reagent were incubated with 50μl of each test sample in assay tubes (12 × 75mm, BD Falcon) for 3 hours at room temperature. After a washing step with 1ml Wash Buffer the assay tubes were centrifuged at 200g for five minutes, the bead pellets resuspended in 300μl Wash Buffer and analysed by flow cytometry. Each sample was tested once, as recommended. Cytokines measured in the samples were quantified using the standard curve. Minimum detection limits of cytokines were 2.6pg/ml for IL-2, 2.6pg/ml for IL-4, 3.0pg/ml for IL-6, 2.8pg/ml for IL-10, 2.8 pg/ml for TNF-α and 7.1pg/ml for IFN-γ according to manufacturer information.
Statistical methods
Statistical methods (mean, median, standard deviation, interquartile range and two-tailed t-test) were accomplished with a personal computer using Microsoft® Excel 2007. According to recommendations of our department for statistics test results that showed great variations were logarithmised to the base 10 for statistical analyses. In order to predict the lytic activity, response to immunotherapy or onset of GVHD, respectively, we created cut-off values that allow a separation of cases in two groups with higher or lower proportions of the particular cytokines.
Results
Cytokine levels in AML/MDS serum
We analysed cytokine release profiles of IL-2, IL-4, IL-6, IL-10, TNF-α and IFN-γ in serum samples from 16 AML/MDS-cases (pt 326, 328, 362, 428, 454, 460, 481, 502, 520, 545, 546, 561, 565, 618, 652, 655) in active stages of the disease by cytometric bead assay. We found low mean concentrations of 0.03pg/ml IL-2, 0.02pg/ml IL-4, 0.21pg/ml IL-6, 0.02pg/ml IL-10, 0.02pg/ml TNF-α and 0.06pg/ml IFN-γ per 106 cells in serum samples of AML/MDS-pts. There were no significant differences in median cytokine levels detectable between serum samples of AML-/MDS-pts with or without lateron demonstrated in vitro antileukaemic activity of T-cells (p = .4–.9), response to immunotherapy (p = .2–.8) or GVHD after ‘DC’- or ‘MNC’-stimulation (p = .3–.7). Moreover, cytokine patterns did not differ between male and female pts, various FAB-types or stages of the disease (data not shown).
Cytokine levels in serum or in MLC-supernatants after ‘MNC’- or ‘DC’-stimulation of T-cells
Stimulation of T-cells with ‘MNC’ and ‘DC’ from leukaemic patients resulted in an increased secretion especially of IL-6 and IFN-γ ()
Cytokine concentrations in serum, after the first and second restimulation with DCleu containing DC (‘DC’) or blast containing MNC (‘MNC’) and at the time point of cell harvest in MLC were examined (). Significantly increased concentrations of all six cytokines were detected in culture supernatants of MLC at first and second restimulation with ‘DC’ or ‘MNC’ and cell harvest compared to serum levels (p ≤ .1–.001). This was observed in cases with all T-cell subtypes pooled and in a differentiated analysis of ‘allogeneic’, ‘autologous’ and T-cells ‘after SCT’. The most significant increase in cytokine levels was detected between serum concentrations and concentrations at first restimulation with leukaemic ‘DC’ or ‘MNC’ (p ≤ .05–.001) in nearly all subgroups compared (). In samples of AML-/MDS-pts levels of nearly all six cytokines were higher after ‘DC’- than after ‘MNC’-stimulation of different T-cells.
Figure 1. Kinetic of cytokines in serum of AML-/MDS-patients and in MLC-supernatants of T-cells after ‘DC’-stimulation (results with autologous, allogeneic T-cells or T-cells after SCT pooled). Median cytokine concentrations in serum and during different phases of MLC after stimulation with ‘DC’ are given as box-and-whisker plot. The ends of the whiskers represent the minimum and maximum of all of the data. The ordinate is presented as logarithmic scale to the base 10. Z1: Serum (n = 16), Z2: first restimulation of MLC (n = 19), Z3: second restimulation of MLC (n = 19), Z4: cell harvest of MLC (n = 11).
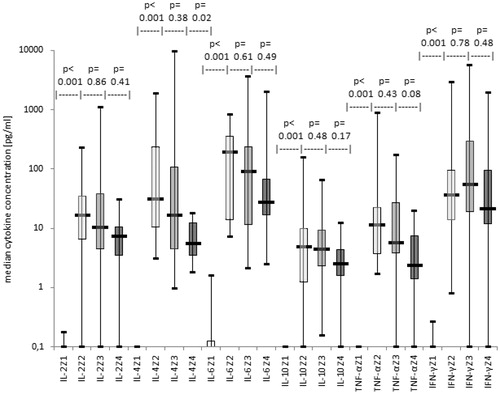
IL-6 was the cytokine with the highest concentrations detected with different T-cell sources and during the stimulation phases of MLC with ‘DC’ or ‘MNC’ (p ≤ .9–.0001) except of MLC with ‘autologous’ T-cells in which concentrations of IFN-γ were higher than those of all other cytokines at all points in time of MLC (p ≤ .9–.001). In particular, in all cases pooled after ‘DC’-stimulation a considerably higher amount of IL-4, IL-6 and IFN-γ than of IL-2, IL-10 and TNF-α was found (p ≤ .001–.5). However, after ‘MNC’-stimulation concentrations of IL-2, IL-6 and IFN-γ were clearly higher than those of the remaining cytokines (p ≤ .001–.1). Comparable cytokine proportions were observed in MLC supernatants with ‘allogeneic’, ‘autologous’ or with T-cells ‘after SCT’.
In summary, we could demonstrate that stimulation of T-cells with leukaemic ‘MNC’ and ‘DC’ in MLC resulted in an increased secretion of IL-2, IL-4, IL-10, TNF-α and especially of IL-6 and IFN-γ most notably between serum concentrations and concentrations at first restimulation with ‘DC’ or ‘MNC’.
Correlation of anti-leukaemic lytic T-cell activities with cytokine release patterns after stimulation of T-cells with ‘MNC’ and ‘DC’ ()
We evaluated the role of soluble factors at second restimulation of T-cells stimulated with ‘DC’ or ‘MNC’ and at cell harvest of MLC (Liepert et al. Citation2010; Grabrucker et al. Citation2010; Schmetzer & Schmid Citation2012). T-cell sources were either ‘allogeneic’, ‘autologous’ or from pts at relapse ‘after SCT’. We grouped cases in those in which T-cells acquired anti-leukaemic cytotoxic activity (‘lysis’) and those in which T-cells did not acquire lytic activitiy (‘no lysis’) and investigated cytokine release patterns of both groups ().
Figure 2. Correlation of anti-leukaemic T-cell activity with cytokine release patterns after stimulation with ‘DC’ (results with autologous, allogeneic T-cells or T-cells after SCT pooled). Median cytokine concentrations are given with cases subdivided in cases with or without gain of anti-leukaemic lytic activity after ‘DC’-stimulation as box-and-whisker plot. The ends of the whiskers represent the minimum and maximum of all of the data. The ordinate is presented as logarithmic scale to the base 10. (a) At second restimulation of MLC: cases with lysis (n = 7), cases with no lysis (n = 9), (b) At cell harvest of MLC: cases with lysis (n = 5), cases with no lysis (n = 3).
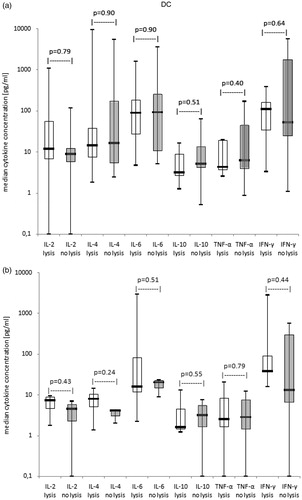
In general no significant results, although tendencies, in cytokine concentrations were detectable between cases with and without lytic T-cell activity after ‘DC’-/‘MNC’-stimulation: At second restimulation and at cell harvest of MLC median levels of IL-2 and IFN-γ were tendentially higher and median levels of IL-10 tendentially lower in the lytically active than in the lytically inactive group after ‘DC’-stimulation, whereas after ‘MNC’-stimulation results showed the opposite (data not shown). Results with different T-cell subtypes were comparable (data not shown).
In summary, our data show that although tendentially higher amounts of IL-2, IFN-γ and lower concentrations of IL-10 correlated with antileukaemic activity of ‘DC’-stimulated T-cells, (what could not been shown after ‘MNC’-stimulation) no clear correlations between cytokine levels and antileukaemic activity could be found.
Correlation of the clinical response to immunotherapy with cytokine release patterns after stimulation of T-cells with ‘MNC’ and ‘DC’ ()
Cytokine release profiles of T-cells after ‘MNC’- or ‘DC’-stimulation in MLC were correlated with the clinical response to the initiated immunotherapies. A complete remission in the following three months after allogeneic SCT/DLI therapy that persisted for at least nine months was defined as response to immunotherapy. Complete remission is characterized by a percentage of leukaemic blasts below 5% in bone marrow without both clusters and leukaemic phenotype of blasts, normal maturation of all cell lines in bone marrow, the absence of extramedullary disease, no need for transfusions of erythrocytes and neutrophile and platelet counts in PB of more than 1000 and 100,000/μl, respectively (Cheson et al. Citation2003; de Greef et al. Citation2005). Only cases were included, in that allogeneic T-cells or T-cells from pts after SCT were used as effector cells in SCT. Immunotherapy consisted in allogeneic SCT (n = 12) or DLI (n = 1; pt 538).
In MLC of responders (although not significantly), lower median concentrations of all six detected cytokines compared to non-responders were found (). This was especially true for IL-2 (). Differences became more distinct at cell harvest of MLC than at second restimulation of MLC with ‘DC’/‘MNC’.
Figure 3. Cytokine release patterns in MLC-supernatants in correlation with clinical response vs. non response to immunotherapy (results with allogeneic T-cells or T-cells after SCT pooled). Median cytokine concentrations in MLC-supernatants of T-cells after ‘DC’-stimulation in cases subdivided in cases with or without clinical response to immunotherapy are given as box-and-whisker plot. The ends of the whiskers represent the minimum and maximum of all of the data. The ordinate is presented as logarithmic scale to the base 10. (a) At second restimulation of MLC: responders to immunotherapy (resp. n = 8), non responders to immunotherapy (no resp. n = 5), (b) At cell harvest of MLC: responders to immunotherapy (resp. n = 4), non responders to immunotherapy (no resp. n = 2)
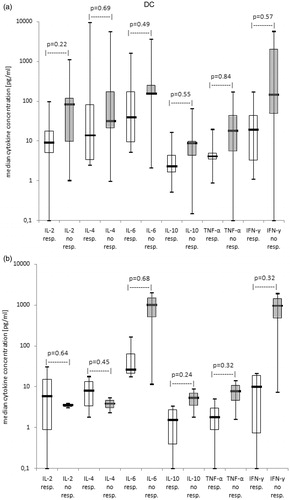
In summary, no correlations between cytokine levels in MLC-supernatants of T-cells after stimulation with ‘MNC’ or ‘DC’ with pts’ response to immunotherapy could be found, pointing to an inferior role of cytokine levels to predict response to clinical immunotherapy.
Correlation of the occurrence of GVHD with cytokine release patterns after stimulation of T-cells with ‘MNC’ and ‘DC’
A prospective monitoring of cytokine levels, e.g. of IFN-γ and TNF-α, might help to predict the onset of acute and chronic GVHD after allogeneic SCT (Yamamoto et al. Citation2004; Yang et al. Citation2005; Ritchie et al. Citation2005). GVH reactions are subdivided in acute and chronic graft-versus-host-disease (GVHD) depending on the occurrence before or after day 100 after transplantation (Ferrara et al. Citation2009). According to severity of symptoms GVHD is further classified in grade I (mild), II (moderate), III (severe) and IV (very severe) (Ferrara et al. Citation2009). Acute GVHD concentrates on skin, gastrointestinal tract and liver, whereas symptoms of chronic GVHD affect nearly all parts of the body including skin, nails, mouth, eyes, muscles, fascia, joints, female genitalia, gastrointestinal tract, liver, kidneys, heart, bone marrow and lungs (Ferrara et al. Citation2009). We analysed cytokine concentrations in cases with GVHD grade I-IV compared to those without GVHD.
The same pts’ cohort was included as studied for response to immunotherapy. All six cytokine release patterns of pts with GVHD were comparable to release patterns of responders to immunotherapy (data not shown). Higher median concentrations of most cytokines, particularly of IL-6 and IFN-γ, were found in MLC of all cases pooled without GVHD than in MLC of cases with GVHD after ‘DC’- and ‘MNC’-stimulation at second restimulation and at cell harvest of MLC, although these differences were not significant.
In summary, no correlations between cytokine levels in MLC-supernatants of T-cells after stimulation with ‘MNC’ or ‘DC’ with the occurrence of GVHD in pts after immunotherapy could be found, pointing to an inferior role of cytokine levels to predict GVHD.
Prognostic significance of secretion profiles ofT-cells after stimulation with ‘MNC’ or ‘DC’ ()
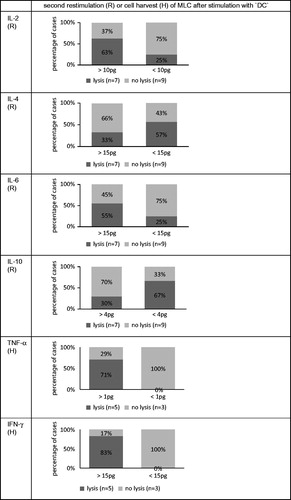
Biological markers are desirable tools for the daily clinical routine. Therefore, we evaluated cut-off values for levels of all six cytokines detected in MLC after ‘DC’-/‘MNC’-stimulation with all cases pooled (before or after SCT) and correlated data with the antileukaemic activity of ‘DC’-/‘MNC’-stimulated T-cells, with the pts’ response to immunotherapy or with the occurrence of GVHD. Whereas no cut-off values could be demonstrated for the separation of cases in those with/without antileukaemic activity of T-cells after ‘MNC’-stimulation (data not shown) we could detect predictive values of all six cytokine concentrations, that allowed a separation of cases with or without antileukaemic activity of ‘DC’-stimulated T-cells. In general cases gained lytic T-cell activity with a higher probability if more cytokines mediating a TH1 response (IL-2, IFN-γ) or inflammatory cytokines (TNF-α, IL6) and less of a TH2 response (IL-10, IL-4) were released: e.g. 83% of cases with more than 15pg IFN-γ in MLC supernatants achieved antileukaemic activity after ‘DC’-stimulation compared to no case with lower values (). Comparable cut-off values as for the pooled group were found studying allogeneic cases alone (data not shown). Cut-off-analyses could not be evaluated for all subgroups such as autologous cases and for cases after SCT due to the small number of pts.
Figure 4. Predictive values of cytokine concentrations for antileukaemic lytic capability of T-cells after stimulation with ‘DC’: cut-off analyses. Correlations of cytokine concentrations with antileukaemic lytic activities of T-cells are given at second restimulation (R) or at cell harvest (H) of MLC with ‘DC’, as available (results with autologous, allogeneic T-cells or T-cells after SCT pooled). All cases were separated in two prognostic groups evaluating a cut-off value for the best differentiation of cases into those with or without antileukaemic activity.
In addition, we could define cut-off values for some of the investigated cytokines to predict response/non-response to immunotherapy or GVHD. In general, cases were characterized by a lower probability to achieve a response to immunotherapy or a GVHD if higher amounts of TH2 cytokines (IL-4 and IL-10) were detected. Additionally, high levels of IL-2 and IFN-γ correlated with a higher chance of allograft tolerance (data not shown).
In summary, we were able to define cut-off values for concentrations of all six cytokines measured in MLC after ‘DC’-stimulation that correlated with antileukaemic T-cell activity and for some of the investigated cytokines after ‘DC’- as well as after ‘MNC’-stimulation that correlated with the clinical response to immunotherapy and the occurrence of GVHD. These observations could contribute to predict T-cells’ functionality in vivo or in vitro.
Discussion
Role of T-cells and DC in immunotherapy of AML and MDS
Allogeneic SCT is the only option of potentially curative treatment for AML- and younger MDS-pts (Kolb et al. Citation2004; Barrett & Savani Citation2006). Cytotoxic T-cells have been detected as crucial mediators of the graft-versus-leukaemia (GVL) reaction after SCT, although relapses occur (Kolb et al. Citation2004). DLIs can be applied therapeutically for treatment of relapse after SCT or prophylactically in order to stabilize remissions – indicating again the central role of T-cells (Roddie et al. Citation2006; Barrett & Savani Citation2006; Schmid et al. Citation2007). For an improvement of therapy of AML-/MDS-pts at relapse after SCT GM-CSF might be applied in the context of DLI in order to facilitate the generation of APC from leukaemic blasts and thereby to increase antileukaemic activities of donor T-cells against myeloid blasts, as already shown by others and us in ex vivo settings (Kufner et al. Citation2005; Kremser et al. Citation2010; Schmid et al. Citation2011; Dreyßig et al. Citation2011). We could already show that compared to ‘MNC’-stimulation stimulation of T-cells with ‘DC’/DCleu, as effective APCs presenting the complete leukaemic antigenic repertoire, gives rise to a better mediation of an antileukaemic T-cell response in vitro thereby potentially contributing to a better response to DLI after allogeneic SCT in vivo (Kufner et al. Citation2005; Kremser et al. Citation2010; Grabrucker et al. Citation2010; Dreyßig et al. Citation2011; Buhmann et al. Citation2016). Those ‘DC’-/DCleu-stimulated T-cells could be promising candidates for adoptive immunotherapies in selected pts (Schmetzer & Schmid Citation2012). However, our in vitro data show that a successful (‘DC’) stimulation of T-cells leading to specific anti-leukaemia directed cytotoxic T-cell activity is not possible in every case (Parronchi et al. Citation1992). The requirements to successfully induce an antileukaemic immune response in vivo are not completely understood as well. The focus of the present study was to evaluate the role of cytokines as soluble factors for the mediation of antileukaemic or leukaemia-stimulating reactions.
Cytokine release and significance of cytokines in clinical therapy
It is common knowledge that cytokines are released by many different cell types and are involved in many different biological processes. Therefore, it is very difficult to single out ‘specific’ characteristics and functions of single cytokines. The attempt to identify particular cytokine patterns in regard to the clinical context might be important since cytokine levels can be influenced by several clinical interventions such as chemotherapy, transfusions etc. and infections (Reikvam et al. Citation2013). However, in our study cytokine concentrations in samples of pts with/without infections did not differ significantly. An explanation could be that all pts included in our study showed only mild/moderate activity of infection or that cytokine release in these pts was not affected significantly.
Several studies have shown, that increased levels of IL-6 and TNF-α were observed in pts with untreated AML which decreased with disease control and clinical remission (Reikvam et al. Citation2013). Thus, cytokine levels may act as markers for successful treatment. Moreover, cytokine levels may be even used as prognostic markers after clinical therapy. For example it was observed that elevated levels of IL-2, IL4 and IL-10 and decreased levels of TNF-α were associated with clinical remission after intensive chemotherapy. High levels of IL-2 pointed to long-time-survival whereas high serum levels of TNF-α were associated with shorter long-time-survival (Reikvam et al. Citation2013).
Furthermore, cytokine levels may serve as early markers to predict adverse events after therapy such as GVHD, although results (for single markers) are heterogeneous. For both TNF-α- and IFN-γ-levels different results are reported in acute GVHD as explicated below. This might indicate that the use of cytokine patterns (potentially together with other mediators such as chemokines, adhesion molecules etc.) may be superior to the use of single cytokines as biomarkers (Reikvam et al. Citation2013).
Several cytokines are yet established in tumor therapy. For example IL-2 is an important cytokine in anti-tumor reaction and hence is applied in therapy of melanoma and metastatic renal cell carcinoma (Bedognetti et al. Citation2010). Moreover, it has been shown that the additional administration of immune modulators such as IL-2 seems to improve the clinical effectiveness of tumor vaccination (Bedognetti et al. Citation2010). Additionally, the investigation of cytokine levels might help to develop new therapeutic strategies. An interesting option to improve immunotherapy is the application of immune modulators such as growth factors and cytokines in combination with standard therapies in vivo in order to induce the generation of DCleu and/or of leukaemia-specific T-cells in vivo (Schmetzer & Schmid Citation2012, Freudenreich et al. Citation2016). Recently we could work out that the application of GM-CSF after DLI might be associated with a higher chance of response to immunotherapy in pts at relapse after SCT (Freudenreich et al. Citation2016).
To summarise, cytokine patterns of ‘selected’ cytokines, may serve as markers for prediction of TH1/TH2 responses, successful clinical therapy, pts’ prognosis, the occurrence of adverse events after therapy (particularly of GVHD) and for the development of new therapeutic options.
Cytokine kinetics in AML-pts’ serum orMLC-supernatants of T-cells stimulated with ‘MNC’ or ‘DC’
Recently our group has shown, that T-cell stimulation with ‘DC’ is more efficient than ‘MNC’-stimulation with respect to a gain of antileukaemic activity of those T-cells (Liepert et al. Citation2010; Grabrucker et al. Citation2010). Our data show, that compared to cytokine levels in AML-pts’ serum increased levels of all cytokines were found in MLC-culture supernatants of T-cells (independent whether autologous, allogeneic or harvested after SCT) stimulated either with ‘MNC’ or ‘DC’, pointing to induced T-cell activation and growth (Houssiau & Van Snick Citation1992; Kammula et al. Citation1999). We demonstrate a decrease of cytokine levels during MLC, implying a consumption of these cytokines during MLC. With respect to find the optimal point in time to harvest (autologous/allogeneic/after SCT) T-cells after stimulation further, especially functional investigations are necessary.
Cytokine release patterns in MLC supernatants in correlation with antileukaemic activity of ‘MNC’- or ‘DC’-stimulated T-cells
It has already been shown, that the release of certain cytokines correlates with the mediation of cytotoxic effector functions (Houssiau & Van Snick Citation1992; Kammula et al. Citation1999; Keilholz Citation2002; Yamamoto et al. Citation2004; Yang et al. Citation2005; Hehlgans & Pfeffer Citation2005). Our group has already shown, that T-cells stimulated with ‘DC’ or ‘MNC’ can gain efficient antileukaemic activity, but not in every case and that ‘DC’-stimulation is superior to ‘MNC’-stimulation in mediating T-cell induced leukaemia cytotoxicity (Liepert et al. Citation2010; Grabrucker et al. Citation2010). Therefore, we wanted to evaluate the role of soluble factors in these reactions:
The finding of higher median levels of IL-2 in MLC supernatants in the group of antileukaemically active ‘DC’-/‘MNC’-stimulated T-cells compared to the group of lytically inactive T-cells (at second restimulation and cell harvest) is consistent with the role of IL-2 in mediation of cytotoxic effector functions (Houssiau & Van Snick Citation1992; Keilholz Citation2002). In addition we could demonstrate the predictive potential of an IL-2 release for the antileukaemic reactivity of T-cells: 63% of cases with more than 10pg/ml IL-2 in MLC after ‘DC’-stimulation gained antileukaemic activity compared to only 25% of cases with levels below.
IFN-γ promotes immunogenicity of tumor cells by enhancing MHC class I antigen processing and presentation and thereby increases the sensitivity of tumor cells to CTL activity (Yang et al. Citation2005). Furthermore there are studies published showing that IFN-γ mediates efficient cytotoxic T-cell responses and antitumor immunity by direct stimulation of maturation of specific ‘DC’-lines (Kammula et al. Citation1999). Here, we show higher amounts of IFN-γ in MLC-supernatants after ‘DC’-stimulation in the group of antileukaemically active T-cells compared to the group of lytically inactive T-cells – although differences were not significant. These data indicate, that IFN-γ levels alone may not be apt as markers for cytotoxic T-cell activity in general, but may point to the inconsistent role of IFN-γ, especially in the mediation of antileukaemic T-cell functions: it has been shown, that an IFN-γ secretion needs not necessarily go along with a CD4+/CD8 + T-cell mediated anti-tumor activity, probably due to functional defects or altered signaling in anti-tumor T-cells (Keilholz Citation2002). In contrast, we could demonstrate the predictive potential of an IFN-γ release for the antileukaemic reactivity of T-cells: 83% of cases with more than 15pg/ml IFN-γ in MLC after ‘DC’-stimulation did gain antileukaemic activity compared to no case with levels below. That means that the role of IFN-γ in the mediation of (specific) anti-tumor responses has to be further elucidated.
As expected, we observed a lower median release of IL-10 in cases with antileukaemically active than in cases with lytically inactive T-cells after ‘DC’-/‘MNC’-stimulation. These observations might indicate that an inhibitory microenvironment can be overcome especially by ‘DC’-stimulation of T-cells. Moreover we could demonstrate the predictive potential of an IL-10 release for the antileukaemic reactivity of T-cells: 67% of cases with less than 4pg/ml IL-10 in MLC after ‘DC’-stimulation did gain antileukaemic activity compared to only 30% of cases with levels above.
Relatively high median concentrations of IL-6 were found in MLC-supernatants after ‘MNC’- as well as ‘DC’-stimulation of T-cells- independent of the antileukaemic functionality of stimulated T-cells. This observation is consistent with the induction of differentiation of CTLs from CD8+ cells by IL-6 and the enhancement of cytotoxic T-cell functions hereby (Houssiau & Van Snick Citation1992). Interestingly after ‘MNC’-stimulation median levels of IL-6 were higher, in cases after ‘DC’-stimulation slightly lower in cases with antileukaemic activity. This could be interpreted by the higher antileukaemic potential of ‘DC’-stimulated T cells, being at least in part independent of ‘prolytic factors’ like IL-6. However, we could evaluate predictive cut-off values for the antileukaemic reactivity of ‘DC’-stimulated T cells: 55% of cases with more than 15pg/ml IL-6 in MLC after ‘DC’-stimulation did gain antileukaemic activity compared to 25% of cases with levels below.
No differences were found in IL-4 or TNF-α cytokine levels in MLC culture supernatants resulting in antileukaemically active vs. inactive T-cells. Although we could evaluate predictive cut-off values for the antileukaemic reactivity of ‘DC’-stimulated T-cells: 57% of cases with less than 15pg/ml IL-4 in MLC after ‘DC’-stimulation did gain antileukaemic activity compared to only 33% of cases with levels above; 71% of cases with more than 1pg/ml TNF-α in MLC after ‘DC’-stimulation did gain antileukaemic activity compared to no case with levels below.
In summary, these findings suggest that SOME cytokine marker levels (IL-2, IFN-γ, IL-10) correlate directly with antileukaemic activity of stimulated T-cells, whereas the gain of cytotoxic T-cell activity is independent of cytokine levels of other cytokines (IL-4, IL-6, TNF-α) – although cut-off values to predict antileukaemic reactivity could be evaluated for all six cytokines.
Cytokine release patterns in correlation with response to immunotherapy and with the occurrence of GVHD
We and others could already demonstrate that T-cells can gain anti-tumor activity in vitro. Although in vitro anti-tumor activity often does not correlate with clinical response to immunotherapy (Keilholz Citation2002; Bedognetti et al. Citation2010), our group could work out cellular in vitro constellations after ‘DC’-stimulation (e.g. T cell proliferation rates, CD4:CD8- and CD45RO:CD45RA-ratios, rates of convertibility of blasts to DCleu and cut-off values of DC subtypes), that are predictive for pts’ clinical response to immunotherapy (Liepert et al. Citation2010; Grabrucker et al. Citation2010; Schmetzer & Schmid Citation2012). In the present study, we were able to define cut-off values for concentrations of IL-4 and IL-10 that were predictive for the response to immunotherapy indicating the central role of cytokines in this context.
According to their functions as classical TH2 cytokines higher median concentrations of IL-4 and IL-10 were detected in the group of non responders to immunotherapy compared to the responders’ group in all examined subgroups apart from the time point of cell harvest of MLC after ‘DC’-stimulation. This observation suggests that inhibitory factors might be overcome by ‘DC’-stimulation. According to our observation IL-6 and IFN-γ do not appear to be potential markers for clinical response to immunotherapy. Anti-tumor T-cells secreting IFN-γ without a clinical response to cancer vaccine therapy have already been reported in several studies (Kammula et al. Citation1999; Keilholz Citation2002; Bedognetti et al. Citation2010). One potential mechanism is a lack of IL-2 mRNA after vaccination (Keilholz Citation2002). Indeed the additional administration of immune modulators such as IL-2 seems to improve the clinical effectiveness of tumor vaccination indicating that other cofactors are required in vivo for the full activation of tumor-specific T-cells (Bedognetti et al. Citation2010).
It was already shown that a prospective monitoring of cytokine levels, e.g. IFN-γ and TNF-α, might help to predict the onset of acute and chronic GVHD after allogeneic SCT and could contribute to identify those relapsed pts after SCT who could benefit from a DLI-therapy (Yamamoto et al. Citation2004; Yang et al. Citation2005; Ritchie et al. Citation2005). For a long time, it was assumed that TH2 cytokines such as IL-4 and IL-10 induce T-cell anergy thereby promoting allograft tolerance, whereas TH1 cytokines such as IL-2 and IFN-γ are associated with graft rejection (Sayegh et al. Citation1995; Takeuchi et al. Citation1997). Indeed, in our study high median levels of IL-4 and of IL-10 were detected after ‘MNC’- and ‘DC’-stimulation in cases without GVHD. Moreover, we were able to define predictive cut-off values for concentrations of IL-4 and IL-10 for GVHD and allograft tolerance, respectively. However, in transplant rejection IL-10 plays a contradictory role (Hempel et al. Citation1997; Yamamoto et al. Citation2004; Yang et al. Citation2005). On the one hand, many studies demonstrate a protective effect of IL-10 on transplants against allograft rejection, on the other hand in allogeneic bone marrow transplantation, high IL-10 serum levels are associated with fatal outcome in pts, application of IL-10 accelerates graft rejection, possibly by increased CTL generation, and augments GVHD-induced mortality in mice (Zheng et al. Citation1995; Quian et al. Citation1996; Hempel et al. Citation1997; Furukawa et al. Citation1999). Our data confirm the former assumption.
In allo-SCT, TNF-α has been identified as a direct toxic cytokine to host tissues (Quian et al. Citation1996; Yamamoto et al. Citation2004). Recipient-derived TNF-α may increase allo-reactive donor T-cell expansion and thereby promote GVHD (Yamamoto et al. Citation2004). In contrast, a lack of TNF-α in donor cells accelerates GVHD in mice by augmenting anti-host CTL activity and host TNF-α secretion, indicating that donor-derived TNF-α may suppress GVHD in allo-SCT (Yamamoto et al. Citation2004). Indeed, in our study lower concentrations of TNF-α were detected in cases with GVHD compared to cases without GVHD and vice versa confirming the latter assumption.
In GVHD and GVL-reaction, IFN-γ plays an important regulatory role (Konieczny et al. Citation1998). Recent studies show that IFN-γ and IL-2 promote allograft acceptance in vivo (Konieczny et al. Citation1998; Wells et al. Citation1999). Accordingly, our data showed higher levels of IL-2 and IFN-γ in the group without GVHD compared to the GVHD group. We found, that IFN-γ-levels below 90 pg/ml per 106 cells after second ‘DC’-/‘MNC’-stimulation of MLC corresponded with GVHD. IFN-γ can protect allo-HCT recipients from GVHD by inhibiting both donor CD4+ and CD8+ T-cells, probably by inducing apoptosis of host-reactive donor T-cells. Moreover, IFN-γ seems to be able to selectively eliminate recipient lympho-haematopoietic cells and induce apoptosis of allo-reactive CD8+ T-cells. Another mechanism of IFN-γ to promote allograft tolerance is enhancing the suppressive effect of allo-antigen-specific Treg-cells (Yang et al. Citation2005). Thus, there are several ways how IFN-γ facilitates allograft tolerance, which may also partially play a role in tumor immunity.
Our data and also data of the literature point to the multifunctional role of several cytokines. We conclude that an evaluation of effector cells’ function should not be performed based on single cytokines only, but be interpreted in a context of functional assays.
Conclusion
We could demonstrate an increased cytokine secretion in MLC of autologous, allogeneic T-cells and T-cells from patients after stem cell transplantation after ‘DC’- and ‘MNC’-stimulation. No significant differences in cytokine release patterns were shown in cases with or without antileukaemic T-cell activity, pts’ response/non-response to immunotherapy or pts’ development of GVHD. However, we could detect predictive cut-off values for cytokine levels in all six cytokines that allow a separation of cases in those with a high/low probability to develop antileukaemic activity or to respond to initiated immunotherapy. These findings are important for further inclusion and application of cytokine assays for studying AML-pts’ in vitro or in vivo reactivities to initiated therapies.
However, the once clear distinction between TH1 und TH2 cells is hampered by findings of T helper cell diversity and plasticity especially of CD4+ T-cells (Nakayamada et al. Citation2012). Moreover, even the cytokine secretion of T helper cells is not as distinct as once thought. IL-10 for example is produced by TH1, TH2 and Tregs (O'Shea & Paul Citation2010)]. For this and other reasons, we recommend to always combine functional assays (e.g. RT-PCR or RNAseq) not only to expand data but also for a better evaluation of complex cytokine profiles. Regarding these different aspects, we assume that cytokine profiling contributes to correlate cellular activities of TH1, TH2 or inflammatory reactions with disease entities, to anticipate relapse or GVHD at early stages and to facilitate specific prophylactic immunotherapy.
Acknowledgements
The authors thank patients’ nurses and physicians on the wards for their support and Dr. Alexander Crispin (Department of Medical Informatics, Biometry, and Epidemiology, University of Munich) for statistical advices. Moreover, we thank the employees of the diagnostic laboratories for the patients’ diagnostic reports. The results presented in this manuscript were worked out in the doctoral theses of Christine Grabrucker, Anja Liepert, Marion Merle and Dorothea Fischbacher at the University Hospital Großhadern of the Ludwig-Maximilian-University Munich.
Disclosure statement
The authors report no declarations of interest.
References
- Alhamarneh O, Amarnath SM, Stafford ND, Greenman J. 2008. Regulatory T cells: what role do they play in antitumor immunity in patients with head and neck cancer? Head Neck. 30:251–261.
- Barrett AJ, Savani BN. 2006. Stem cell transplantation with reduced intensity conditioning regimens: a review of ten years experience with new transplant concepts and new therapeutic agents. Leukemia. 20:1661–1672.
- Bedognetti D, Wang E, Sertoli MR, Marincola FM. 2010. Gene-expression profiling in vaccine therapy and immunotherapy for cancer. Expert Rev Vaccines. 9:555–565.
- Belardelli F. 1995. Role of interferons and other cytokines in the regulation of the immune response (review). APMIS: Acta Pathologica, Microbiologica Et Immunologica Scandinavica. 103:101–179.
- Bennett JM, Catovsky D, Daniel MT, Flandrin G, Galton DA, Gralnick HR, Sultan C. 1976. Proposals for the classification of the acute leukaemias. French-American-British (FAB) co-operative group. Br J Haematol. 33:451–458.
- Brossart P. 2002. Dendritic cells in vaccination therapies of malignant diseases. Transfus Apher Sci. 27:183–186.
- Buhmann R, Yang T, Grabrucker C, Liepert A, Kremser A, Dreyßig J, Kroell T, Schmid C, Tischer J, Kaiser S, et al. 2016. (in preparation). Dendritic cells can act as amplifiers of leukaemia-lysis or leukaemia-stimulation: a contribution to a refined functional analysis of partners involved in the mediation of anti-leukemic reactions.
- Cheson BD, Bennett JM, Kopecky KJ, Büchner T, Willman CL, Estey EH, Schiffer CA, Doehner H, Tallman MS, Lister TA, et al. 2003. Revised recommendations of the international working group for diagnosis, standardization of response criteria, treatment outcomes, and reporting standards for therapeutic trials in acute myeloid leukemia. J Clin Oncol. 21:4642–4649.
- Choudhury A, Liang JC, Thomas EK, Flores-Romo L, Xie QS, Aqusala K, Sutaria S, Sinha I, Champlin RE, Claxton DF. 1999. Dendritic cells derived in vitro from acute myelogenous leukemia cells stimulate autologous, antileukemic T-cell responses. Blood. 93:780–786.
- Claxton DF, McMannis J, Champlin R, Choudhury A. 2001. Therapeutic potential of leukemia-derived dendritic cells: preclinical and clinical progress. Crit Rev Immunol. 21:147–155.
- de Greef GE, van Putten WL, Boogaerts M, Huijgens PC, Verdonck LF, Vellenga E, Theobald M, Jacky E, Löwenberg B. 2005. Criteria for defining a complete remission in acute myeloid leukaemia revisited. An analysis of patients treated in HOVON-SAKK cooperative group studies. Br J Haematol. 128:184–191.
- Döhner H, Estey E, Amadori S, Appelbaum FR, Büchner T, Burnett AK, Dombret H, Fenaux P, Grimwade D, Larson RA, et al. 2010. Diagnosis and management of acute myeloid leukemia in adults: recommendations from an international expert panel, on behalf of the European LeukemiaNet. Blood. 115:453–474.
- Dreyßig J, Kremser A, Liepert A, Grabrucker C, Freudenreich M, Schmid C, Kroell T, Scholl N, Tischer J, Kufner S, et al. 2011. Various 'dendritic cell antigens' are already expressed on uncultured blasts in acute myeloid leukemia and myelodysplastic syndromes. Immunotherapy. 3:1113–1124.
- Ferrara J, Levine J, Reddy P, Holler E. 2009. Graft-versus-host disease. The Lancet. 373:1550–1561.
- Freudenreich M, Schmid C, Kremser A, Dreyßig J, Kroell T, Tischer J, Kolb HJ, Schmetzer HM. 2016. (in preparation). Clinical relevance of in vitro generated dendritic cells in patients with AML or MDS.
- Furukawa Y, Becker G, Stinn JL, Shimizu K, Libby P, Mitchell RN. 1999. Interleukin-10 (IL-10) augments allograft arterial disease: paradoxical effects of Il-10 in vivo. Am J Pathol. 155:1929–1939.
- Gajewski TF, Fitch FW. 1990. Anti-proliferative effect of IFN-gamma in immune regulation. IV. Murine CTL clones produce IL-3 and GM-CSF, the activity of which is masked by the inhibitory action of secreted IFN-gamma. J Immunol. 144:548–556.
- Galea-Lauri J, Darling D, Mufti G, Harrison P, Farzaneh F. 2002. Eliciting cytotoxic T lymphocytes against acute myeloid leukemia-derived antigens: evaluation of dendritic cell-leukemia cell hybrids and other antigen-loading strategies for dendritic cell-based vaccination. Cancer Immunol Immunother. 51:299–310.
- Gastman BR, Atarshi Y, Reichert TE, Saito T, Balkir L, Rabinowich H, Whiteside TL. 1999. Fas ligand is expressed on human squamous cell carcinomas of the head and neck, and it promotes apoptosis of T lymphocytes. Cancer Res. 59:5356–5364.
- Giles FJ, Keating A, Goldstone AH, Avivi I, Willman CL, Kantarjian HM. 2002. Acute myeloid leukemia. Hematology. 1:73–110.
- Grabrucker C, Liepert A, Dreyßig J, Kremser A, Kroell T, Freudenreich M, Schmid C, Schweiger C, Tischer J, Kolb HJ, Schmetzer HM. 2010. The quality and quantity of leukemia-derived dendritic cells (DC) from patients with acute myeloid leukaemia (AML) and myelodysplastic syndrome (MDS) are a predictive factor for the lytic potential of DC-primed leukemia-specific Tcells. J Immunother. 33:523–537.
- Groux H, Bigler M, de Vries JE, Roncarolo MG. 1996. Interleukin-10 induces a long-term antigen-specific anergic state in Human CD4+ T cells. J Exp Med. 184:19–29.
- Hayhoe FG. 1988. Classification of acute leukaemias. Blood Rev. 2:186–193.
- Hehlgans T, Pfeffer K. 2005. The intriguing biology of the tumour necrosis factor/tumour necrosis factor receptor superfamily: players, rules and the games. Immunology. 115:1–20.
- Hempel L, Körholz D, Nussbaum P, Bönig H, Burdach S, Zintl F. 1997. High interleukin-10 serum levels are associated with fatal outcome in patients after bone marrow transplantation. Bone Marrow Transplant. 20:365–368.
- Houssiau F, Van Snick J. 1992. IL6 and the T-cell response. Res Immunol. 143:740–743.
- Kammula US, Lee KH, Riker A, Wang E, Ohnmacht GA, Rosenberg SA, Marincola FM. 1999. Functional analysis of antigen-specific T lymphocytes by serial measurement of gene expression in peripheral blood mononuclear cells and tumor specimens. J Immunol. 163:6867–6875.
- Keilholz U, Weber J, Finke JH, Gabrilovich DI, Kast WM, Disis ML, Kirkwood JM, Scheibenbogen C, Schlom J, Maino VC, et al. 2002. Immunologic monitoring of cancer vaccine therapy: Results of a workshop sponsored by the society for biological therapy. J Immunother. 25:97–138.
- King C, Mueller Hoenger R, Malo Cleary M, Murali-Krishna K, Ahmed R, King E, Sarvetnick N. 2001. Interleukin-4 acts at the locus of the antigen-presenting dendritic cell to counter-regulate cytotoxic CD8+ T-cell response. Nat Med. 7:206–214.
- Kishimoto T. 2010. IL-6: from its discovery to clinical applications. Int Immunol. 22:347–352.
- Kolb HJ, Schattenberg A, Goldman JM, Hertenstein B, Jacobsen N, Arcese W, Ljungman P, Ferrant A, Verdonck L, Niederwieser D, et al. 1995. Graft-versus-leukemia effect of donor lymphocyte transfusions in marrow grafted patients. European group for blood and marrow transplantation working party chronic leukemia. Blood. 86:2041–2050.
- Kolb HJ, Schmid C, Barrett A, Schendel DJ. 2004. Graft-versus-leukemia reactions in allogeneic chimeras. Blood. 103:767–776.
- Konieczny BT, Dai Z, Elwood ET, Saleem S, Linsley PS, Baddoura FK, Larsen CP, Pearson TC, Lakkis FG. 1998. IFN-gamma is critical for long-term allograft survival induced by blocking the CD28 and CD40 ligand T cell costimulation pathways. J Immunol. 160:2059–2064.
- Kremser A, Dreyßig J, Grabrucker C, Liepert A, Kroell T, Scholl N, Schmid C, Tischer J, Kufner S, Salih H, et al. 2010. Dendritic cells (DCs) can be successfully generated from leukemic blasts in individual patients with AML or MDS: an evaluation of different methods. J Immunother. 33:185–199.
- Kufner S, Fleischer RP, Kroell T, Schmid C, Zitzelsberger H, Salih H, de Valle F, Treder W, Schmetzer HM. 2005. Serum-free generation and quantification of functionally active leukemia-derived DC is possible from malignant blasts in acute myeloid leukemia and myelodysplastic syndromes. Cancer Immunol Immunother. 54:953–970.
- Liepert A, Grabrucker C, Kremser A, Dreyßig J, Ansprenger C, Freudenreich M, Kroell T, Reibke R, Tischer J, Schweiger C, et al. 2010. Quality of T-cells after stimulation with leukemia-derived dendritic cells (DC) from patients with acute myeloid leukemia (AML) or myeloid dysplastic syndrome (MDS) is predictive for their leukemia cytotoxic potential. Cell Immunol. 265:23–30.
- Mazzolini G, Atorrasagasti C, Rizzo M, Murillo O, Dubrot J, Tirapu J, Arina A, Alfaro C, Azpilicueta A, Berasain C, et al. 2007. Immunotherapy and immunoescape in colorectal cancer. World J Gastroenterol. 13:5822–5831.
- Moore KW, O’Garra A, de Waal Malefyt R, Vieira P, Mosmann TR. 1993. Interleukin-10. Annu Rev Immunol. 11:165–190
- Mosmann TR. 1992. T lymphocyte subsets, cytokines, and effector functions. Ann N Y Acad Sci. 664: 89–92.
- Nakayamada S, Takahashi H, Kanno Y, O’Shea JJ. 2012. Helper T cell diversity and plasticity. Curr Opin Immunol. 24: 297–302.
- O'Shea JJ, Paul WE. 2010. Mechanisms underlying lineage commitment and plasticity of helper CD4+ T cells. Science. 327:1098–1102.
- Parronchi P, De Carli M, Manetti R, Simonelli C, Sampognaro S, Piccinni MP, Macchia D, Maggi E, Del Prete G, Romagnani S. 1992. Il-4 and IFN (alpha and gamma) exert opposite regulatory effects on the development of cytolytic potential by Th1 or Th2 human T cell clones. J Immunol. 149:2977–2983.
- Peleman R, Wu J, Fargeas C, Delespesse G. 1989. Recombinant interleukin 4 suppresses the production of interferon gamma by human mononuclear cells. J Experiment Med. 170:1751–1756.
- Quian S, Li W, Li Y, Fu F, Lu L, Fung JJ, Thomson AW. 1996. Systemic administration of cellular interleukin-10 can exacerbate cardiac allograft rejection in mice. Transplantation. 62:1709–1714.
- Reikvam H, Fredly H, Kittang AO, Bruserud O. 2013. The possible diagnostic and prognostic use of systemic chemokine profiles in clinical medicine—the experience in acute myeloid leukemia from disease development and diagnosis via conventional chemotherapy to allogeneic stem cell transplantation. Toxins. 5:336–362.
- Ritchie D, Seconi J, Wood C, Walton J, Watt V. 2005. Prospective monitoring of tumor necrosis factor alpha and interferon gamma to predict the onset of acute and chronic graft-versus-host disease after allogeneic stem cell transplantation. Biol Blood Marrow Transplant. 11:706–712.
- Roddie H, Klammer M, Thomas C, Thomson R, Atkinson A, Sproul A, Waterfall M, Samuel K, Yin J, Johnson P, Turner M. 2006. Phase I/II study of vaccination with dendritic-like leukaemia cells for the immunotherapy of acute myeloid leukaemia. Br J Haematol. 133:152–157.
- Romagnani S. 1992. Induction of TH1 and TH2 responses: a key role for the 'natural' immune response? Immunol Today. 13:379–381.
- Roncarolo MG, Gregori S, Lucarelli B, Ciceri F, Bacchetta R. 2011. Clinical tolerance in allogeneic hematopoietic stem cell transplantation. Immunol Rev. 241:145–163.
- Salih HR, Nussler V. 2001. Commentary: Immune escape versus tumor tolerance: How do tumors evade immune surveillance? Eur J Med. Res6:323–332.
- Savani BN, Labopin M, Blaise D, Niederwieser D, Ciceri F, Ganser A, Arnold R, Afanasyev B, Vigouroux S, Milpied N, et al. 2015. Peripheral blood stem cell graft compared to bone marrow after reduced intensity conditioning regimens for acute leukemia – A report from the ALWP of the EBMT. Haematologica [online] Available at: http://www.haematologica.org/content/101/2/256.long. doi:10.3324/haematol.2015.135699. Accessed on 13 December 2015.
- Sayegh MH, Akalin E, Hancock WW, Russell ME, Carpenter CB, Linsley PS, Turka LA. 1995. CD28-B7 blockade after alloantigenic challenge in vivo inhibits TH1 cytokines but spares TH2. J Exp Med. 181:1869–1874.
- Schmetzer HM, Kremser A, Loibl J, Kroell T, Kolb HJ. 2007. Quantification of ex vivo generated dendritic cells (DC) and leukemia derived DC contributes to estimate the quality of DC, to detect optimal DC-generating methods or to optimize DC-mediated T-cell-activation procedures ex vivo or in vivo. Leukemia. 21:1338–1341.
- Schmetzer HM, Schmid C. 2012. The T-cells' Role in antileukemic reactions - Perspectives for future therapies. In: New advances in Stem Cell Transplantation, Demirer T (ed.). Chapter 4. Rijeka, Croatia: InTech, pp. 59–76.
- Schmid C, Schleuning M, Schwerdtfeger R, Hertenstein B, Mischak-Weissinger E, Bunjes D. 2006. Long-term survival in refractory acute myeloid leukemia after sequential treatment with chemotherapy and reduced intensity conditioning for allogeneic stem cell transplantation. Blood. 108:1092–1099.
- Schmid C, Labopin M, Nagler A, Bornhäuser M, Finke J, Fassas A, Volin L, Gürman G, Maertens J, Bordigoni P, et al. 2007. Acute leukemia working party: donor lymphocyte infusion in the treatment of first hematological relapse after allogeneic stem-cell transplantation in adults with acute myeloid leukemia: a retrospective risk factors analysis and comparison with other strategies by the EBMT acute leukemia working party. J Clin Oncol. 25:4938–4945.
- Schmid C, Labopin M, Nagler A, Niederwieser D, Castagna L, Tabrizi R, Stadler M, Kuball J, Cornelissen J, Vorlicek J, et al. 2011. Treatment, risk factors, and outcome of adults with relapsed AML after reduced intensity conditioning for allogeneic stem cell transplantation. Blood. 119:1599–1606.
- Smith KA. 1989. The interleukin 2 receptor. Annu Rev Cell Biol. 5:397–425.
- Stripecke R, Levine AM, Pullarkat V, Cardoso AA. 2002. Immunotherapy with acute leukemia cells modified into antigen-presenting cells: ex vivo culture and gene transfer methods. Leukemia. 16:1974–1983.
- Szabo SJ, Dighe AS, Gubler U, Murphy KM. 1997. Regulation of the interleukin (IL)-12R beta 2 subunit expression in developing T helper 1 (Th1) and Th2 cells. J Exp Med. 185:817–824.
- Tait BD. 2000. HLA class I expression on human cancer cells. Implications for effective immunotherapy. Hum Immunol. 61:158–165.
- Takeuchi T, Ueki T, Sunaga S, Ikuta K, Sasaki Y, Li B, Moriyama N, Miyazaki J, Kawabe K. 1997. Murine interleukin 4 transgenic heart allograft survival prolonged with down-regulation of the TH1 cytokine mRNA in grafts. Transplantation. 64:152–157.
- Tracey KJ, Vlassara H, Cerami A. 1989. Cachectin/tumour necrosis factor. Lancet. 1:1122–1126.
- Wells AD, Li XC, Li Y, Walsh MC, Zheng XX, Wu Z, Nunez G, Tang A, Sayegh M, Hancock WW, et al. 1999. Requirement for T-cell apoptosis in the induction of peripheral transplantation tolerance. Nat Med. 5:1303–1307.
- Yamamoto S, Tsuji T, Matsuzaki J, Zhange Y, Chamoto K, Kosaka A, Togashi Y, Sekikawa K, Sawada K, Takeshima T, et al. 2004. Unexpected role of TNF-alpha in graft versus host reaction (GVHR): donor-derived TNF-alpha suppresses GVHR via inhibition of IFN-gamma-dependent donor type-1 immunity. Int Immunol. 16:811–817.
- Yang YG, Wang H, Asavaroengchai W, Dey BR. 2005. Role of interferon-gamma in GVHD and GVL. Cell Mol Immunol. 2:323–329.
- Zheng X, Steele A, Nickerson P, Steurer W, Steiger J, Strom TB. 1995. Administration of noncytolytic IL-10/Fc in murine models of lipopolysaccharide-induced septic shock and allogeneic islet transplantation. J Immunol. 154:5590–5600.