
 ?Mathematical formulae have been encoded as MathML and are displayed in this HTML version using MathJax in order to improve their display. Uncheck the box to turn MathJax off. This feature requires Javascript. Click on a formula to zoom.
ABSTRACT
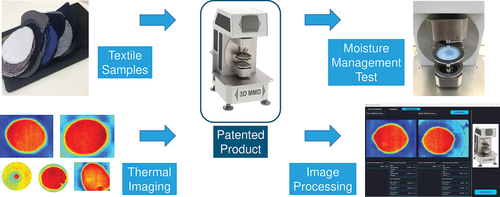
Today, expectations from textile products have increased and the comfort features of clothes have gained more importance, especially for leisure and sports clothes. Therefore, the liquid moisture transmission of clothes is quite important, which has a significant effect on the body's ability to cool itself and the user's feeling cold after sweating. A new test instrument “3D-MMD” (3 Dimension Moisture Mapping Device), that measures the liquid moisture transmission feature of the fabrics in multidirection is introduced in this paper. The developed system includes two thermal cameras that allow measurement below and above of the sample. When the test liquid is dropped on the sample, the heat transfer occurs and due to the heat transfer during the transmission of moisture, the surface temperature of wetted and non-wetted parts of the fabric changes. This change is detected in the form of infrared data with the help of thermal cameras and converted into an electronic image. The wet area can be easily created by processing the images of the color visuals coming instantly from the thermal camera. The patent for this new method has been registered by the Turkish Patent and Trademark Office (TR2020/21004). Meanwhile, the international patent application process continues (PCT/TR2021/051223).
GRAPHICAL ABSTRACT
摘要
如今, 人们对纺织品的期望越来越高, 衣服的舒适性也变得越来越重要, 尤其是休闲和运动服. 因此, 衣服的液体水分传输非常重要, 它对身体自我冷却的能力和使用者出汗后的寒冷感有着显著的影响.
本文介绍了一种新的测试仪器“3D-MMD”(三维水分测绘仪), 用于测量织物的液体水分多向传输特性. 开发的系统包括两个热像仪, 可以在样品的下方和上方进行测量. 当测试液滴在样品上时, 会发生热传递, 由于水分传输过程中的热传递, 织物润湿和非润湿部分的表面温度会发生变化. 这种变化在热像仪的帮助下以红外数据的形式被检测到, 并被转换成电子图像. 通过处理热像仪立即产生的彩色视觉图像, 可以轻松创建潮湿区域. 这种新方法的专利已由土耳其专利商标局注册(TR2020/21004). 与此同时, 国际专利申请程序仍在继续(PCT/TR2021/051223).
Introduction
Today, expectations from textile products have increased, and the comfort features of clothes have gained more importance. Users want these products to demonstrate high breathing capability, facilitate the removal of liquid sweat from the skin surface, and provide high thermophysiological comfort while allowing the body’s heat balance to be maintained (Fujii et al. Citation2017; Süpüren Mengüç et al. Citation2020).
Wetting, wicking, and moisture vapor transmission characteristics of textiles are the most important factors for evaluating the comfort performance (Palaniappan et al. Citation2023; Sampath and Senthilkumar Citation2009). Wetting is the first step before wicking. Wick ability is affected by surface tension, wettability of the fiber, yarn dimension, and the volume and quantity of capillary gaps created by the yarn and fabric (Lomax Citation2016; Palaniappan et al. Citation2023).
The term “moisture management” frequently refers to the removal of liquid and vaporized moisture from the body. In general, the faster wicking property covers more surface area which supports quick evaporation (Palaniappan et al. Citation2023; Senthilkumar, Sampath, and Ramachandran Citation2012).
This property has a significant effect on the body’s ability to cool itself and the user’s feeling cold after sweating. For this reason, the ability of fabrics to transmit liquid moisture is an issue that researchers and manufacturers focus on in terms of thermophysiological comfort (Fujii et al. Citation2017; Süpüren Mengüç et al. Citation2020).
Normally, the human body operating temperature is 37°C, whereas, during an activity, the metabolism of the body heat rises to the extent of 1000 W (Troynikov and Wardiningsih Citation2011; Soundri et al., Citation2022a). The human body attempts to maintain a body temperature of 37°C under various circumstances of body activities (Kumar, Boominathan, and Raj Citation2022) and it produces sweat to adjust its own temperature.
When the body movement is low and the environmental heat is at a normal level, a fixed moisture transfer occurs between the pores of the human body and the environment, as water vapor. However, if the produced heat cannot be removed, the body secretes more sweat to keep the internal temperature at 37°C. This sweat, which is generated in the liquid phase, is removed from the skin in the form of water vapor by taking heat energy from the body, and thus, the body temperature can be reduced. In addition, when the clothing is wet, the heat flow from the skin through the clothing is greater since water decreases the thermal insulation of clothing. This is because water has higher thermal conductivity than air (Crow and Osczevski Citation1998; Kanat et al. Citation2006; Namlıgöz, Çoban, and Bahtiyari Citation2010; Özdil et al. Citation2009; Simile Citation2004).
Since the heat in the body is removed during the evaporation of the liquid sweat from the skin or fabric surface (Hu et al. Citation2005), the spread of the liquid sweat in the clothing or its evaporation from the skin surface is another important issue. If the sweat formed evaporates from the skin surface, the body loses heat and the liquid sweat goes away with sudden heat loss, causing the user to feel cold (Süpüren et al. Citation2011; Zhou et al. Citation2007).
Especially for sports clothes, moisture management is one of the essential properties (Gupta Citation2011), since the body mechanism attempts to maintain the equilibrium by releasing the heat through sweat to extend of 2.5 L/hour (Kumar, Boominathan, and Raj Citation2021; Manshahia and Das Citation2014; Soundri, S, and Kumar B Citation2022b). The absorbed moisture by the fabric should be transferred to the outer layer as fast as possible (Onofrei, Rocha, and Catarino Citation2011; Soundri et al. Citation2022a). The fabrics used in this area, should be capable of instant absorption, quick moisture transportation, and fast drying (Kumar, Boominathan, and Raj Citation2021; Manshahia and Das Citation2014; Soundri, S, and Kumar B Citation2022a).
Sweat transmission and absorption properties of the clothing are influenced by fiber type, fabric structure, and surface coating of the fabric (Oner et al. Citation2013; Soundri et al. Citation2022b).
Since there is a need to dynamically and sensitively detect all stages of liquid transmission in textile materials, there are studies to measure it with also two patented devices for detecting how the water dripped on the fabric is spread on the front and the back. The first one is a device that has been used in the market for many years and makes measurements based on the principle of electrical conductivity (Hu, Li, and Wong Citation2003). In this test device, the moisture transmission properties of the fabric sample are performed using the fabric sample placed horizontally by means of a large number of concentrically placed conductive rods (pins). Some saline solution is given in the middle of the pins arranged in the form of concentric rings, and when this solution is absorbed and spread by the sample, it causes a change in the resistance value measured on the pins, as the solution contacts the concentric rings. By making use of this change, the spread of the solution can be monitored (Li et al., Citation2002). During the measurement, the fabric is held in a horizontal position by the upper and lower sensors under a certain pressure, and 0,15 g of test liquid is given onto the fabric (Hu et al. Citation2005).
The working principle of this device is based on high electrical resistance properties of textile products. The electrical resistance of textile products is usually very large when they are in a closed circuit. In this case, since no electric current is seen, the voltage across the 1 MΩ reference resistance is almost zero. However, when the fabric is wet or contains a certain amount of moisture, the resistance drops to the KΩ rate. A similar method is used to measure changes in moisture content on two different sides of textile surfaces (Hu et al. Citation2005).
There are many studies in the literature about the moisture transfer properties of textiles by using this device (Arabuli, Vlasenko, and Martinkova Citation2018; Ertekin Citation2017; Hu et al. Citation2005; Hussain et al. Citation2019; Khan et al. Citation2018; Matusiak Citation2019; Namlıgöz, Çoban, and Bahtiyari Citation2010; Özdil et al. Citation2009; Selli and Turhan Citation2017; Vidhya et al. Citation2022) that provides the comparison opportunity to choose the appropriate material for different clothes.
The 2nd device developed to determine the moisture transmission properties of fabrics has a measurement system based on image processing. In this device, the transmission of liquid moisture on the front and the back is examined by video recording made using a special camera and it is also stated that it is possible to measure both horizontally and vertically by rotating the platform the sample is placed (Teal et al. Citation2020).
In this system, high-resolution cameras are placed on both sides of the material sample to record the movement of moisture. These cameras provide full visibility of the test and allow measurements without being affected by the color or pattern of the sample. It uses ultraviolet and infrared light to obtain a clear view during testing. With the software specially prepared for the device, the spread of moisture on the fabric is recorded as a video. As a result of the test, data such as the maximum wetting area, the border of the wetted area, and spreading and absorption rate can be obtained (Heal Citation2023; James Heal, Citation2023b).
Presentation of the prototype moisture mapping device (3D-MMD)
The thermal energy emitted by the objects in the infrared spectrum varies depending on the temperature of the objects (Wong et al. Citation2009). While the water dripped on the surface of the fabric is transmitted by the fabric in the horizontal and vertical directions, heat transfer takes place and the temperature of the wetted areas changes. The developed device makes use of the heat energy differences in the invisible infrared spectrum to distinguish the wetted and nonwetted parts of the fabric. With the help of special thermal cameras integrated into the system, these infrared energy data are converted into an electronic image showing the surface temperature of the measured object, and these images are processed by the developed software, allowing the moisture transmission properties of the fabric to be determined quickly, objectively, sensitively and in a versatile way.
It uses special thermal imaging systems placed on both sides of the fabric to detect the change in the surface temperature of the wetted area. In this way, the test results are not affected by the fabric type, color, or pattern. In addition, there is no need for a special lighting system (UV and/or IR) to detect the wetting zone (Süpüren Mengüç et al. Citation2020).
For this reason, the ability of fabrics to transmit liquid moisture is an issue that researchers and manufacturers focus on in terms of thermophysiological comfort. The invention provides an objective measurement of the liquid moisture transmission property of fabrics by a different method.
The images of the developed prototype are shown in . The new designed moisture transmission property tester meets the requirements and brings some additional advantages to moisture management. In the developed system, a new measurement system was designed based on a very fast and simple physical measurement principle, which will enable the transmission of wetting and liquid moisture and also the determination of the drying properties of the fabric after wetting. The determination of the drying property after wetting with the invention is a new and unique feature that is not found in the previous techniques (Süpüren Mengüç et al. Citation2020).
Figure 1. (a) Picture of the prototype of the measurement device, (b) picture of the measurement area.

As seen in the developed system includes two thermal cameras that allow measurement of the top (top camera) and bottom (bottom camera) parts of the sample to be tested.
The resolution of the camera is 80 × 60 pixels and it captures 8.6 frames per second. The radiometric accuracy of the thermal camera is 5% at the highest gain and 10% at the lowest gain. The spectral range of infrared waves emitted by the camera is 8 µm to 14 µm. Dynamic temperature measuring range during measurement, high gain mode: −10°C to 140°C, low gain mode: −10°C to +400°C (at room temperature). Image Optimization: Factory configured and fully automatic. At the same time, the image is optimized by software.
The middle camera integrated into the system, acts as a control sensor and the task of this camera in the system is to determine the absorption time of the drop. Measurements taken with the middle camera are used to verify the property of absorbency of the drop from the surface. In this way, it is possible to examine the absorption state of the drop precisely.
The liquid used to perform the tests is defined as a test liquid, which can be distilled water; preferably salty water can be used to simulate liquid sweat and can be any chosen liquid to simulate body liquids including acidic and alkaline sweat solutions.
When the test liquid is dropped on the sample, the thermal camera images that come to the computer are evaluated with the computer software developed by using various image processing techniques. When the test liquid is dropped on the fabric sample, the dry and wet areas of the fabric are seen in different colors. Due to the heat transfer during the transmission of moisture, the surface temperature of the wetted and non-wetted parts of the fabric changes. This change is detected in the form of infrared data with the help of special cameras integrated into the system and converted into an electronic image showing the surface temperature of the fabric. In this image, dry areas are seen as shades of red and wet areas as shades of blue. Obtaining colors in different shades makes it possible to precisely determine the level of wetness (and if it is more or less wet). A separate camera system is used on both sides to measure the upper and lower parts of the fabric. The map of the wet area can be easily created by processing the images of the color visuals coming instantly from the thermal camera.
The software makes this evaluation by using techniques such as focusing, simplification, contouring, and area measurement on images. Thus, while the test liquid is spread on the sample, the moisture transmission properties of the fabric are determined by obtaining the desired data such as spreading speed, spreading direction, and absorption rate. The control card placed in the device is used as a communication center between the device and the computer program. The communication between the device and the computer is done with the serial port and the data is displayed in the software after being subjected to various calculations. The software generates the results online using the data from the control card and provides live information on the screen about the status of the tested sample.
One of the biggest advantages of this system is that it can also measure the drying properties of the fabric after wetting. Drying is the complete evaporation of water dropped on the fabric surface during measurement. When optionally the drying time is desired to be determined, this preference is specified in the software before the test starts, and when the test starts, the state of the fabric surface temperature until it reaches the reference point can be examined. Therefore, this property constitutes another unique aspect of the developed device. For the accelerated drying test, a small fan can be attached to the measurement area like the one used in the drying rate test.
The sample placement area on the device being movable makes it possible to perform the test in horizontal and vertical positions by simulating the wetting conditions in different parts of the cloth such as the back or armpit, as the measurement area can stand in both horizontal and vertical directions.
The dropper is used to deliver the test liquid in amounts predetermined in the software to the midpoint of the test area. This part guides the transmission of the test liquid pumped at a certain speed and ensures that the test liquid is delivered from the drip nozzle to the fabric surface. The amount of fluid, pumping time and test time can be changed according to preference.
The sample holder consists of two parts, one below and the other above the fabric sample. The sample holder upper part is fixed to the rotary holding unit of the machine. To place the fabric sample in the sample holder, the rotary unit rotates 180° with respect to the horizontal measurement position and is positioned so that the part of the sample holder that is fixed to the rotary unit remains at the bottom. After inserting the fabric sample, the sample holders are locked by using the locking piece, and the sample is ready for measurement. The fabric can optionally be measured in both horizontal and vertical directions. Preparation of the sample is given in .
Figure 2. (a) Preparation of the sample: (a) sample holder lower part, (b) cutting fabric sample, (c) placing fabric sample on the sample holder lower part.

Sample holder needles penetrate through the fabric sample and are positioned on the sample holder's lower part that serves to hold the fabric as it can be seen in .
It was aimed to measure even very thick textiles by this instrument. In order to keep the distance between the dropper and the fabric surface constant, the sample was placed from the bottom part. Illustrations of the device before and after placing the fabric are given in .
Figure 3. Test procedure: (a) appearance of the instrument (position before test) and (b) position before the sample placement (the rotary unit rotates 180°C with respect to the horizontal measurement position). (c) The fabric sample is placed in the sample holder and the sample holders are locked. (d) The rotary unit rotates 180°C with respect to the horizontal measurement position and the sample holder upper part is positioned above and the lower part is positioned below. (e) Instrument is ready for the measurement (dropper is positioned). (f) Wetted fabric appearance.

Figure 4. Measurement area front view (left) and side view (right).

Figure 5. Screen of the sample 1 test results.

The aperture on the side of the sample holder upper part allows the middle camera to take measurements precisely. The middle camera acts as a control sensor used to detect the moment when the test liquid dropped on the fabric sample placed in the horizontal direction is completely absorbed by the fabric. Therefore, the task of this camera in the system is to determine the absorption time of the drop. Measurements taken with the middle camera are used to verify the property of absorbency of the drop from the surface.
There are needles on the sample holder to make a successful clamping. For thin and thick fabrics, a sample holder with needles of different numbers and heights can be used. The ergonomic design of the sample holder also allows to reduce the restrictions caused by the thickness of the fabrics to be measured. The sample holder in the developed device is suitable for use on all fabrics up to 15 mm thick.
In addition, a protective layer is used to prevent the test liquid from passing under the fabric and dripping onto the bottom camera in case the fabric is too thin or very highly hydrophilic. It is placed on the protective layer holder fixed to the rotary unit.
Sampling and results measured by the new device
Sampling of 3D-MMD
Test specimens should be conditioned at 20°C and 65% RH for at least 24 h before the measurement. They should be cut by the “Circular sample cutter” with the exact surface area of 100 cm2.
Test results measured by the new device
A series of operations are applied to contour. First, the images taken from the camera were converted to grayscale with the cv2.COLOR_BGR2GRAY command. In this way, making calculations on the picture has become faster and easier. The grayscale image was then sharpened with the cv2.medianBlur command. The processes up to this stage have been applied to prepare the picture for thresholding. Performing these operations directly affects the image processing accuracy. In the next step, thresholding is applied on the image. By applying Adaptive thresholding with the cv2.adaptiveThreshold command, neighboring pixels were evaluated together. In this way, the moist region of the fabric has become more sensitively distinguishable from the dry region. In the last stage, the moist region was determined by using the cv2.findContours command (Bailke and Divekar Citation2022).
In order to control whether reproducible results were obtained from the developed device, the same person made measurements in the 10 consecutive days with the same fabric. Evaluation using Grubb’s method proved that the results were reproducible.
In order to verify the values of the new device, its results were compared with the results of the manual diameter measurements. Independent samples T-Test was performed to determine whether the difference between the results is significant. According to the statistical evaluation, the difference between the results of the device and manual measurements was found to be statistically insignificant.
Maximum wetted diameter
In the calculation of the maximum wetted diameter, the center of mass of the wetted region was found first. In finding the center of mass of the region, the relations in Hu’s Image Moment study in 1962 were used (Hu Citation1962).
With (x,y) being the positions of the pixels in the image, the raw image moment is defined as:
Central Moment µji is calculated as:
Here (,
) the center of mass is as follows:
The normalized center moments are calculated as:
After finding the center of mass of the wetted area, the maximum wetted diameter was calculated by the method introduced by Welzl (Welzl Citation1991).
This method has been implemented in the Python software language using the minEnclosingCircle function of the OpenCV computer vision software library.
Face maximum wetted diameter
By finding the largest wetting radius in the sample fabric images obtained from the top camera, the largest wetting diameter on the front face was calculated.
Back maximum wetted diameter
By finding the largest wetting radius in the sample fabric images obtained from the bottom camera, the largest wetting diameter on the back side was calculated.
Average wetted diameter
In the first step, the extreme points of the wetted area were found. These points are made in Python software language with the “Extreme Points” method suggested by the OpenCV computer vision software library. In the second step, lines were drawn from the points on the vertical and horizontal axis toward each other. The average wetted diameter value was obtained by dividing the sum of the lengths of the lines formed by the number of lines.
Face average wetted diameter
Using the sample fabric images obtained from the top camera, the average wetted diameter on the front of the sample was calculated.
Total wetted area
Green’s Theorem was used to calculate this area. As f(x,y) and g(x,y) are functions with continuous derivatives in the region D bounded by the closed curve C in the z = 0 plane, a special case of Stokes’ Theorem, Green’s Theorem is defined as follows:
Before this relation, g(x,y)=x, f(x,y) = 0, then g(x,y) = 0, f(x,y)=y. If the obtained relations are subtracted side by side, the area relation is obtained (Sirakov Citation2007).
With EquationEquation (6)(6)
(6) , the total wetted area was calculated from the wetted fabric images obtained from the top and bottom cameras.
Face total wetted area
The total wetted area on the front side of the sample was calculated by using EquationEquation (6)(6)
(6) in the sample fabric images obtained from the top camera.
Back total wetted area
The total wetted area on the back of the sample was calculated by using EquationEquation (6)(6)
(6) in the sample fabric images obtained from the bottom camera.
Maximum spreading speed
Maximum spreading speed is the ratio of the largest wetting diameter to the test duration (mm/s).
Face Spreading Speed (FMSS)
It is the ratio of the maximum wetting diameter obtained from the image taken from the top camera to the test duration.
Back Spreading Speed (BMSS)
It is the ratio of the maximum wetting diameter obtained from the image taken from the bottom camera to the test duration.
Minimum spreading speed
The lowest spread rate is the ratio of the minimum wetting diameter to the test time. In order to calculate the minimum wetted diameter, the center of the mass of the wetted region was calculated by means of EquationEquation (3)(3)
(3) . Thereafter, each pixel of the contour surrounding the wetting area was examined using a similar method used in the study of Yeo, Lee, and Lim (Citation2015) to calculate the “maximum inscribed circle” in their study. Then, the pixel closest to the center of mass was determined, and the lowest wetted radius was calculated. Based on the radius value obtained, the lowest wetted diameter was calculated.
Face Minimum Spreading Speed (FSS)
It is the ratio of the lowest wetted diameter obtained from the image taken from the top camera to the test duration.
Back Minimum Spreading Speed (BSS)
It is the ratio of the lowest wetted diameter obtained from the image taken from the bottom camera to the test duration.
Transfer speed
It is the ratio of the fabric thickness (d) to the time it takes until moisture transmission starts to appear on the back.
Drying speed
It is ratio of the maximum wetted diameter to the time from the moment the sample reaches the maximum wetting diameter to its complete drying.
Experimental
In order to indicate the performance of the instrument, three fabric samples were used in the experiment. Properties of the fabrics are given in .
Table 1. Properties of the fabrics.
Besides the basis of the measurement method using temperature differences on fabric surface, test temperature is also an important factor since its effects on the steam pressure inside the fabric during measurement. All testing occurred in standard atmosphere conditions at 20 ± 2°C and 65 ± 5% RH after conditioning. Twenty seconds of pumping time was selected. Test solution for simulating the liquid sweat can be distilled water, salty water, or any chosen liquid to simulate body liquids including acidic and alkaline sweat solutions. For this study, distilled water was preferred and was given onto the specimen’s surface automatically by the 3D-MMD instrument.
Hot liquid (liquid kept at room temperature) is used in thermal camera images so that the ambient temperature and the temperature of the liquid dripped onto the fabric do not mix.
Results and analysis
Measurement results are given in .
Table 2. Test results of the fabric 1.
Table 3. Test results of the fabric 2.
Table 4. Test results of the fabric 3.
As the wetted area shapes on both sides are analyzed, it can be seen that they are not in a circular form (). Since the instrumental results include both maximum and minimum spreading speeds and wetted diameter values, the test results comprise more details about the real wetting properties of the fabrics, which can change the evaluation of the fabric. According to the results, face max. wetted diameter of the first fabric is found to be 66,092 mm, while the min. wetted diameter is 54,329 mm. In the case of the back side, max. wetted diameter of the fabric is 61,782 mm, and the min. wetted diameter is 50.97 mm. The differences in the maximum and minimum values are mostly the result of the structural parameters related with the warp/weft density of the fabric. Determination of these maximum and minimum wetting parameters makes it possible to evaluate moisture management properties of the fabric more accurately and sensitively.
As the results of face and back sides were compared, it can be seen that there is a good moisture transport property from face to back sides. Total wetted area values on both face and bottom sides are additional results which give information about the spreading performance of the fabric, which were found to be 3086.1 and 2696.7, respectively.
These results indicate that Fabric 1 has the ability to transfer liquid moisture from the surface which is next to the skin to the opposite side of the fabric. It can spread quickly on both surfaces having a large wetted area, and it can evaporate into the environment. Such fabrics have quick-drying abilities.
As the results of Fabric 2 and Fabric 3 were analyzed, it can be determined that wetting shapes and areas are differentiated according to the moisture management properties of the fabrics. Fabric 3 has a hydrophobic surface and does not transport test liquid to the opposite side and cannot easily evaporate into the environment. Since it is in a drop form, its shape is like a circle. It has the minimum wetted area and spreading speed values among the tested fabrics.
In the case of Fabric 2, it is seen that it has the ability to transfer water from the surface next to the skin to the other side. However, the total wetted area and spreading speed were found to be lower than the results of Fabric 1 due to the treatment. Wetting shape is not circular, and the real wetted area shapes of the fabrics can be clearly observed and measured.
Due to the measurement approach and principle, the new test device analyzes the moisture transmission properties of the fabric accurately, and it is thought that the new test method and tester can help manufacturers and researchers to characterize and improve the moisture management properties of fabrics.
Conclusion
This paper introduces a new test device developed to measure the moisture management properties of fabrics. It performs liquid moisture transmission tests quickly and independently of the fabric type. It has unique features as follows:
This new innovative device uses thermography technique. Testing of the liquid moisture transmission by using the temperature change on the fabric surface is conducted by means of the thermal cameras.
The system does not need any light source during the test.
It is able to perform the tests sequentially without long waiting time between the measurements.
With the help of this instrument, determination of the drying speed of the wetted fabric is also possible.
Fabrics with thicknesses up to 15 mm can be tested by a specially designed sample holder. It enables the measurement of a wide range of fabrics.
All mathematical modeling of the software calculates the wetting parameters according to the original and real wetting shape. This supplies an important advantage to compare the fabrics in detail and it can change the selection preferences of the fabrics for different application areas.
Since the original and real wetting shapes were used in the calculations, the results of spreading speed and wetted diameter values consist of maximum and minimum values. This enables to compare the water transmission performance in different directions.
Three fabrics were tested with the new instrument, and the measurement results indicated that the wetted area on the fabrics can be in different shapes, which can be detected exactly, sensitively and accurately as it is. The opportunity of measuring small differences in moisture management properties of fabrics is significant in the selection preferences of the suitable fabrics for the apparel industry. It is not only important for the manufacture of the comfortable clothes but also for the development of textiles used in technical areas.
Since the results of max. and min. spreading speed and wetted diameter values are reported, application performance of different yarns, structural properties, or treatments on fabrics can be analyzed in detail.
Due to all these explained advantages, 3D-MMD instrument can be used and is suggested to characterize the moisture management properties of fabrics and garments.
Patent application for the introduced system has been registered by the Turkish Patent and Trademark Office (TR2020/21004). In addition, an international PCT application (PCT/TR2021/051223) has also been completed.
Author contribution statement
All authors contributed equally at all stages of the research.
Acknowledgments
The authors would like to thank Ege University Scientific Research Projects Coordination for the financial support. A patent application for the device developed within this project was filed in 2020 and was registered in 2022. Intellectual property rights related to the invention were transferred to the “PRO-SER Ltd. Company” via a signed protocol.
Disclosure statement
No potential conflict of interest was reported by the author(s).
Additional information
Funding
References
- Arabuli, S., V. Vlasenko, and L. Martinkova. 2018. “Liquid moisture transport performance of textiles.” Fibres and Textiles 2:3–15. http://vat.ft.tul.cz/2018/2/VaT_2018_2_1.pdf
- Bailke, P., and S. Divekar. 2022. “Real-Time Moving Vehicle Counter System Using Opencv and Python.” International Journal of Engineering Applied Sciences & Technology 6 (11): 190–194. https://doi.org/10.33564/IJEAST.2022.v06i11.036.
- Crow, R. M., and R. J. Osczevski. 1998. “The Interaction of Water with Fabrics.” Textile Research Journal 68 (4): 280–288. https://doi.org/10.1177/004051759806800406.
- Ertekin, G. 2017. “Analysis of Thermo-Physiological Comfort and Moisture Management Properties of Flat Knitted Spacer Fabrics.” Tekstil ve Konfeksiyon 27 (3): 241–250.
- Fujii, N., E. Aoki-Murakami, B. Tsuji, G. P. Kenny, K. Nagashima, N. Kondo, and T. Nishiyasu. 2017. “Body Temperature and Cold Sensation During and Following Exercise Under Temperate Room Conditions in Cold-Sensitive Young Trained Females.” Physiological Reports 5 (20): e13465. https://doi.org/10.14814/phy2.13465.
- Gupta, D. 2011. “Functional Clothing-Definition and Classification.” Indian Journal of Fibre and Textile Research 36:321–326. https://nopr.niscpr.res.in/handle/123456789/13225
- Heal, J. 10 March 2023a. WickView Moisture Management Tester. https://www.james-heal.co.uk/wp-content/uploads/2019/06/WickView-Flye2r.pdf.
- Hu, M. K. 1962. “Visual Pattern Recognition by Moment Invariants.” IRE Transactions on Information Theory 8 (2): 179–187. https://doi.org/10.1109/TIT.1962.1057692.
- Hu, J., Y. Li, A. Wong.2003. A New test method to measure liquid moisture management properties of textiles, The Fiber Society 2003 Spring Symposium, June 30-July 2, 2003, Loughborough, UK.
- Hu, J., Y. Li, K. W. Yeung, A. S. W. Wong, and W. Xu. 2005. “Moisture management tester: a method to characterize fabric liquid moisture management properties, Textile Res.” J 75 (1): 57–62. https://doi.org/10.1177/004051750507500111.
- Hussain, S., V. Glombikova, N. Akhtar, A. Mazari, T. Mansoor, and K. A. H. Khan. 2019. “Liquid moisture transportation properties of functional underwears: part 1.” AUTEX Research Journal 19 (2): 97–103. https://doi.org/10.1515/aut-2018-0030.
- James Heal Unveils New Moisture Management Tester. 10 March 2023b. https://www.technicaltextile.net/news/james-heal-unveils-new-moisture-managementtester-255004.html.
- Kanat, E., G. Süpüren, A. Çay, T. Gülümser, and I. Tarakçıoğlu. 2006. “Termofizyolojik konfor özellikleri geliştirilmiş lifler.” Tekstil ve Konfeksiyonda Görünüm 134:78–84.
- Khan, M. Z., S. Hussain, H. F. Siddique, V. Baheti, J. Militky, M. Azeem, and A. Ali. 2018. “Improvement of liquid moisture management in plaited knitted fabrics.” Tekstil ve Konfeksiyon 28 (3): 182–188.
- Kumar, S., S. K. Boominathan, and D. V. K. Raj. 2021. “Comparative Analysis on Thermo-Physiological Behavior of Eri Silk, Wool and Bamboo Knitted Fabrics Toward Sportswear.” Journal of Natural Fibers 19 (14): 7702–7713. https://doi.org/10.1080/15440478.2021.1958406.
- Kumar, S., S. K. Boominathan, and D. V. K. Raj. 2022. “Comparative Analysis on Thermo-Physiological Behavior of Eri Silk, Wool and Bamboo Knitted Fabrics Toward Sportswear.” Journal of Natural Fibers 19 (14): 7702–7713. https://doi.org/10.1080/15440478.2021.1958406.
- Li, Y., W. Xu, K. W. Yeung, and Y. Kwok. “Moisture management of textiles, US 6499338B2.”
- Lomax, G. R. 2016. “The Design of Waterproof, Water Vapour-Permeable Fabrics.” Sage Publications Sage CA: Thousand Oaks, CA 15 (1): 40–66. https://doi.org/10.1177/152808378501500105.
- Manshahia, M., and A. Das. 2014. “Moisture Management of High Active Sportswear.” Fibers and Polymers 15 (6): 1221–1229. https://doi.org/10.1007/s12221-014-1221-9.
- Matusiak, M. 2019. “Moisture Management Properties of Seersucker Woven Fabrics of Different Structure, FIBRES & TEXTILES in Eastern Europe.” Fibres & Textiles in Eastern Europe 27 (3(135)): 43–50. https://doi.org/10.5604/01.3001.0013.0741.
- Namlıgöz, E. S., S. Çoban, and M. İ. Bahtiyari. 2010. “Comparison of Moisture Transport Properties of the Various Woven Fabrics.” Tekstil ve Konfeksiyon 20 (2): 93–100.
- Oner, E., H. G. Atasagun, A. Okur, A. R. Beden, and G. Durur. 2013. “Evaluation of Moisture Management Properties on Knitted Fabrics.” The Journal of the Textile Institute 104 (7): 699–707. https://doi.org/10.1080/00405000.2012.752895.
- Onofrei, E., A. Rocha, and A. Catarino. 2011. “The Influence of Knitted fabrics’ Structure on the Thermal and Moisture Management Properties.” Journal of Engineered Fibers and Fabrics 6 (4): 10–22. https://doi.org/10.1177/155892501100600403.
- Özdil, N., G. Süpüren Mengüç, G. Özçelik Kayseri, and J. Pruchova. 2009. “A Study on the Moisture Transport Properties of the Cotton Knitted Fabrics in Single Jersey Structure.” Tekstil ve Konfeksiyon 19 (3): 218–223.
- Palaniappan, G., A. R. D, S. CB, S. Senthil Kumar, S. Kumar B, and D. E. 2023. “Studies on Thermal and Moisture Properties of Novel Eri Silk Knitted Structures.” Research Journal of Textile and Apparel, Vol. Ahead-Of-Print No. Ahead-Of-Print. https://doi.org/10.1108/RJTA-11-2022-0131.
- Sampath, M. B., and M. Senthilkumar. 2009. “Effect of Moisture Management Finish on Comfort Characteristics of Microdenier Polyester Knitted Fabrics.” Journal of Industrial Textiles 39 (2): 163–173. https://doi.org/10.1177/1528083709102922.
- Selli, F., and Y. Turhan. 2017. “Investigation of Air Permeability and Moisture Management Properties of the Commercial Single Jersey and Rib Knitted Fabrics.” Tekstil ve Konfeksiyon 27 (1): 27–31.
- Senthilkumar, M., M. B. Sampath, and T. Ramachandran. 2012. “Moisture Management in an Active Sportswear: Techniques and Evaluation—A Review Article.” Journal of the Institution of Engineers (India): Series E 93 (2): 61–68. https://doi.org/10.1007/s40034-013-0013-x.
- Simile, C. B.2004. Critical evaluation of wicking ın performance fabrics, Master Thesis, Georgia Institute of Technology
- Sirakov, N. M.2007. Monotonic Vector Forces and Green’s Theorem for Automatic Area Calculation, In 2007 IEEE International Conference on Image Processing, San Antonio, TX, USA, 16 September 2007 - 19 October 20074:IV-297-IV–300. https://doi.org/10.1109/ICIP.2007.4380013.
- Soundri, G. M., S. Kavitha, D. Senthilkumar Boominathan, V. Raj, and K. M. Patchiyappan. 2022a. “Comparative Moisture Management Studies of Single Jersey Knitted Soya Bean Fabrics.” Journal of Natural Fibers 19 (16): 12462–12472. https://doi.org/10.1080/15440478.2022.2072994
- Soundri, G. M., K. S, and S. Kumar B. 2022b. “Dimensional, Moisture, and Thermal Properties of Bi-Layered Knitted Fabric for Sportswear Application.” Research Journal of Textile and Apparel, Vol. Ahead-Of-Print No. Ahead-Of-Print 27 (4): 543–559. https://doi.org/10.1108/RJTA-05-2021-0074
- Süpüren Mengüç, G., M. Bilge, M. D. Bilge, E. Özkan, and F. Bozdoğan. 2020. “Kumaş Nem İletimi Ölçüm Cihazi ve Ölçüm Cihazinin Çalışma Yöntemi, TR2020/21004, PCT/TR2021/051223.”
- Süpüren, G., N. Oğlakcıoğlu, N. Özdil, and A. Marmaralı. 2011. “Moisture Management and Thermal Absorptivity Properties of Double-Face Knitted Fabrics.” Textile Research Journal 81 (13): 1320–1330. https://doi.org/10.1177/0040517511402122.
- Teal, A., B. Sage, I. Taylor, J. Pratt, N. Pryke, and H. Jones. 2020. “System and Method for Testing Wetting of Fabric Samples.” International Application Published Under The Patent Cooperation Treaty (PCT), International Publication Number WO 2020/161455 A1.
- Troynikov, O., and W. Wardiningsih. 2011. “Moisture Management Properties of Wool/Polyester and Wool/Bamboo Knitted Fabrics for the Sportswear Base Layer.” Textile Research Journal 81 (6): 621–631. https://doi.org/10.1177/0040517510392461.
- Vidhya, M., B. Parveen, D. Vasanth Kumar, C. Prakash, and V. Subramaniam. 2022. “Study on Single Jersey Knitted Fabrics Made from Cotton/Polyester Core Spun Yarns. Part Ii: Moisture Management Properties.” Tekstil ve Konfeksiyon 32 (1): 37–46. https://doi.org/10.32710/tekstilvekonfeksiyon.904228.
- Welzl, E. 1991. “Smallest Enclosing Disks (Balls and Ellipsoids).” In New Results and New Trends in Computer Science, Lecture Notes in Computer Science, edited by H. Maurer, 359–370. Vol. 555. New York: Springer. https://doi.org/10.1007/bfb0038202.
- Wong, W. K., P. N. Tan, C. K. Loo, W. S. Lim.2009. An Effective Surveillance System Using Thermal Camera, International Conference on Signal Acquisition and Processing, Kuala Lumpur, Malaysia, 03-05 April 2009, ICSAP. https://doi.org/10.1109/ICSAP.2009.12.
- Yeo, H. S., B. G. Lee, and H. Lim. 2015. “Hand Tracking and Gesture Recognition System for Human-Computer Interaction Using Low-Cost Hardware, Multimed.” Tools Appl 74 (8): 2687–2715. https://doi.org/10.1007/s11042-013-1501-1.
- Zhou, L., X. Feng, Y. Dua, and Y. Li. 2007. “Characterization of Liquid Moisture Transport Performance of Wool Knitted Fabrics.” Textile Research Journal 77 (12): 951–956. https://doi.org/10.1177/0040517507083518.