
 ?Mathematical formulae have been encoded as MathML and are displayed in this HTML version using MathJax in order to improve their display. Uncheck the box to turn MathJax off. This feature requires Javascript. Click on a formula to zoom.
ABSTRACT
Global warming could affect vegetation growth, while land surface temperature has exhibited an asymmetric warming pattern over the past 50 years. The Tibetan Plateau, known as “the roof of the world,” experiences the surface warming almost twice as high as the global average. However, previous research has largely overlooked the impacts of this asymmetrical warming on vegetation growth and the temporal changes in these impacts. In this study, we assess the effects of asymmetric warming on vegetation growth at regional and different vegetation types by using partial correlation analysis, and reveal the temporal changes of impacts strength using time moving window. The results showed that there had been a significant greening trend (1.01 × 10⁻³ yr−1, p < 0.01) in the Normalized Difference Vegetation Index (NDVI) during the growing season, as well as significant warming trends in both maximum temperatures (Tmax, 0.0354°C yr−1, p < 0.01) and minimum temperatures (Tmin, 0.0333°C yr−1, p < 0.01) during 2000–2021. Under the background of asymmetric warming, the grassland showed stronger impacts of Tmin than Tmax on NDVI, while the opposite effects were observed for forests. Over time, the response of NDVI to Tmax and Tmin has intensified. This study highlights importance of asymmetric warming in the projection of climate change on vegetation in similarly vulnerable ecosystems worldwide.
1. Introduction
Vegetation plays a pivotal role in terrestrial ecosystems, exerting significant influence over global and regional carbon cycles and energy balances (Forzieri et al. Citation2020; Ge et al. Citation2021; Piao et al. Citation2019). There are significant changes in vegetation cover due to the influences of climate change and human activities (Liu et al. Citation2023; Zhu et al. Citation2022). Over the past three decades, the trend of increasing vegetation greenness, referred to as “greening” has been observed (Chen et al. Citation2019; Ding et al. Citation2020; Piao et al. Citation2019). Model simulations suggest that the 70% of the global greening could be attributed to the fertilization of carbon dioxide (CO2) (Zhu et al. Citation2016). However, for high latitudes and the Tibetan Plateau, climate change remains a critical factor of vegetation greening, accounting for more than 28% of the global vegetation greening.
The global climate have showed warming trends in recent decades by using observation and reanalysis air temperature data (You et al. Citation2021; Zhang, Qin, and Zhai Citation2023) and remote sensing land surface temperature data (Sobrino, Julien, and García-Monteiro Citation2020; Y.-R. Wang et al. Citation2022), as well as the rate of warming on the Tibetan Plateau exceeds twice the global average (You et al. Citation2021). Widespread climate warming affected the vegetation growth on the Tibetan Plateau (Li et al. Citation2018; Wu et al. Citation2023; Xie et al. Citation2024; Zhang, Yang, and Long Citation2023). During 1982–2018, growing season temperature exerted the largest contribution to Normalized Difference Vegetation Index (NDVI) across the Tibetan Plateau (Li et al. Citation2022). Additionally, multiple vegetation indices revealed that the vegetation growth was dominated by temperature during 2000–2021 on the plateau (Wu et al. Citation2023). The eastern grassland is primarily limited by temperature, whereas the climatic constraint in the western is predominantly water availability the Tibetan Plateau (Xie et al. Citation2024). However, current research on vegetation growth often emphasizes the role of mean temperature, overlooking the influence of asymmetric warming on vegetation growth.
The recent study finds a reversal of the global daytime and nighttime warming pattern (Zhong et al. Citation2023). Furthermore, it was revealed that asymmetric warming showed different effects on vegetation growth and exhibited spatial heterogeneity (Du et al. Citation2019; Liu et al. Citation2023; Shen et al. Citation2016; Xu et al. Citation2023). For instance, in most moist and cool ecosystems of the Northern Hemisphere, NDVI demonstrated a positive correlation with daytime air temperature (the maximum daily temperature), and a negative correlation with nighttime air temperature (the minimum daily temperature) (Peng et al. Citation2013). Conversely, nighttime warming showed a positive effect on ecosystem productivity of grassland ecosystems in northern China based on air temperature (Du et al. Citation2019). On the Tibetan Plateau, nighttime warming has been found to positively affect summer NDVI in grasslands (Li et al. Citation2023; Shen et al. Citation2016). These studies focused on the effect of asymmetric warming on grasslands or regional scale. The Tibetan Plateau contains diverse vegetation types, ranging from broadleaf forests, to vast grasslands, and ultimately transitioning to deserts northward. However, the response of vegetation growth to asymmetric warming on the Tibetan Plateau among these varied vegetation types remains unclear. Furthermore, considering that growing season contributes significantly to vegetation growth and carbon sequestration (Liu et al. Citation2023), it is imperative to assess the impacts of asymmetric warming during the critical season and evaluate the differences among vegetation types.
Furthermore, many studies on the response of vegetation activity to asymmetric warming temperature have been stayed on static analysis (Xia et al. Citation2018; Xu et al. Citation2023). Indeed, the relationship between vegetation growth and temperature change is dynamic, evolving over time as a result of other environmental and human interventions. Research indicated a diminishing correlation in vegetation activity and temperature (Piao et al. Citation2014). Specially, the contribution of daytime temperatures was greater than that of nighttime temperatures in the weakening relationship between warming and vegetation growth in the temperate zone of the north of 30°N (Zheng et al. Citation2021b). Moreover, there are the different responses of temperature on vegetation activities in alpine meadows and steppes of the Tibetan Plateau as time changes (Cong et al. Citation2017). Therefore, changes in the vegetation growth responding to asymmetric warming over time need to be further investigated.
Above these studies, there are still gaps in understanding of how asymmetric warming impacts vegetation growth on the Tibetan Plateau and how these relationships between warming and vegetation growth change over time. Consequently, this study is centered around answering two questions: (1) whether the impact of asymmetric warming on vegetation growth varies among different vegetation types; (2) whether the intensity of asymmetric warming on the vegetation growth has changed over time.
2. Materials and methods
2.1. Study area
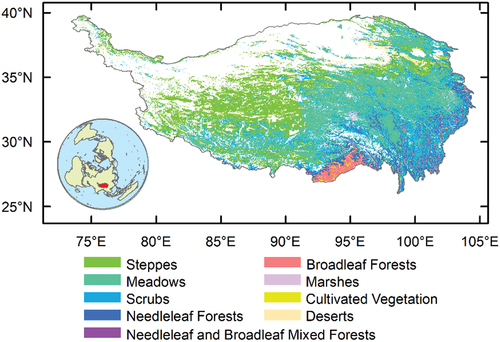
Tibetan Plateau is located in southwestern China and is known as “the third pole,” with an overall average altitude of over 4,000 meters and is the unique ecological units in the world (Yao et al. Citation2022). The vegetation types are complex and diverse. The natural vegetation is predominantly comprised by alpine grasslands (alpine steppes and meadows), which account for 50% of the plateau’s total area (). The horizontal belt of the plateau is characterized by forests, scrubs, grasslands and deserts spanning from southeast to northwest, and the vertical belt has changed from humid type in the south edge of Himalayas to the continental arid type in the interior of the plateau.
Figure 1. The vegetation types on the Tibetan Plateau. The blank region, identified by multiyear mean annual NDVI values below 0.10, was emblematic of sparse vegetation. The vegetation types was derived from vegetation map of the People’s Republic of China (1:1000000) (X. Zhang Citation2007).
2.2. Framework
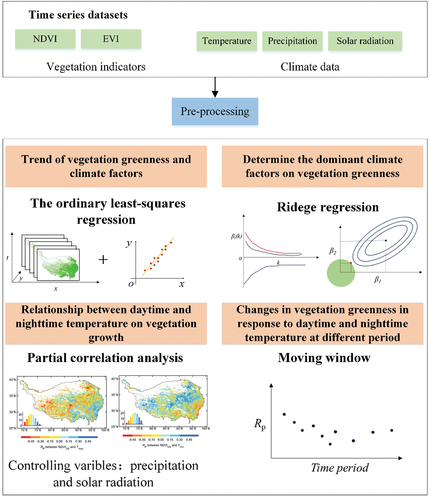
In this study, we first used the MODIS NDVI, EVI and reanalysis climate datasets to investigate the spatial and temporal variation of vegetation growth and climate factors during the growing season (May to September). To address the challenge posed by the high correlation and inter-feedback among climate factors, we employed the ridge regression method to determine the main driving factors of vegetation greenness. Given the dominance of temperature as a driving factor, we further explored the impact of daytime and nighttime temperature on vegetation growth using partial correlation analysis, which aims to examine the relationship between two variables and eliminate the influence of other variables. Furthermore, we assessed the impact difference of daytime and nighttime temperature on vegetation greenness among the different vegetation types. Finally, we investigated the changes in vegetation greenness in response to daytime and nighttime temperature at different period ().
Figure 2. Framework of the study.
2.3. Datasets
2.3.1. Vegetation greenness
The NDVI and EVI were quantified as vegetation greenness, which were sourced from MOD13A1 version 6.1, available at a spatial and temporal resolution of 500 m and 16 days (Didan Citation2021). We used the maximum value composition method to calculate the monthly NDVI to mitigate the effects of clouds and shadows (Cao et al. Citation2022). In this study, we excluded the pixels with mean annual NDVI values below 0.10 due to their sparse vegetation (Zhang et al. Citation2021). The growing season (May–September) mean NDVI as a proxy of vegetation growth (Liu et al. Citation2023). The EVI was calculated in the same ways.
2.3.2. Climate data
The climate data, including air temperature, precipitation, and solar radiation downward from 2000 to 2021, was extracted from the ERA5-Land dataset, with a temporal resolution of 1 hour and a spatial resolution of 0.1°. The ERA5-Land dataset has better performance in capturing inter-annual variability of temperature and precipitation (Jiao et al. Citation2021; Lv et al. Citation2024; Y. Peng et al. Citation2023). Then, we firstly calculated the maximum daily temperature (daytime temperature, Tmax) and the minimum daily temperature (nighttime temperature, Tmin) data by the hourly climate data, and then the monthly temperature was averaged by daily temperature per month from 2000 to 2021. The monthly precipitation and solar radiation downward data were calculated by cumulative way based on hourly data. Furthermore, we calculated the growing season Tmax and Tmin by mean ways during May to September per year, and growing season cumulative precipitation (Pre) and growing season cumulative solar radiation downward (Ssrd) were calculated by cumulative ways during May–September per year. Then, all the dataset were matched with the NDVI dataset using geographical coordinates.
2.3.3. Other data
The vegetation types data was derived from Vegetation Map of the People’s Republic of China (1:1000000) (Zhang Citation2007). The contiguous solar-induced fluorescence (CSIF) dataset was obtained from Zhang et al. (Citation2018) and then we calculated the growing season CSIF during 2000–2019 (Lv et al. Citation2023; Zhang et al. Citation2023). The soil moisture dataset with 0~5 cm depth was derived from Shangguan et al. (Citation2023) during 2001–2020, with a temporal resolution of 1 day and a spatial resolution of 1 km, matching with the NDVI dataset by using geographical coordinates and then we calculated the multiyear mean of soil moisture.
2.4. Analyses
2.4.1. Temporal changes in vegetation greenness and climate factors
For each pixel, the temporal trend of growing season NDVI from 2000 to 2021 was assessed by ordinary least squares regression (Peng et al. Citation2012; Zheng et al. Citation2021). To analyze the temporal change of climate factors, we also calculated the trends of growing season Tmax, Tmin, precipitation and solar radiation downward from 2000 to 2021 by the same ways.
2.4.2. Determine the dominant climate factors on vegetation greenness
To overcome the challenge posed by the strong correlation and mutual feedback among various climate factors, ridge regression is a robust method for parameter estimation for solving the covariance problem in multiple linear regression (Chen et al. Citation2020). This method enhances the reliability of regression coefficients by eliminating the biases inherent in the least squares method (Graham Citation2003). We used ridge regression to examine dominant climate factors between growing season NDVI and Tmax, Tmin, precipitation, and solar radiation downward. Furthermore, the dominant factor was identified based on the variable whose absolute value of the standardized regression coefficient was the highest.
2.4.3. Relationship between daytime and nighttime temperature on vegetation growth
Partial correlation analysis is a statistical method used to explore the relationship between two variables (such as variables X and Y) while considering the influence of the third variable (such as variables Z) on them. The formula as:
In the formula, r is the Partial correlation coefficient between variables X and Y and ,
,
are the simple correlation coefficient between variables X and Y, X and Z, Y and Z.
Therefore, we used partial correlation analysis to evaluate the impact of the Tmax of growing season (May to September) on NDVI controlling the Tmin, total precipitation and solar radiation downward of growing season (Shen et al. Citation2016). The impact of the Tmin on growing NDVI was calculated by the same ways. All the variables were detrended (Peng et al. Citation2013). The sensitivity of vegetation greenness to growing season Tmax and Tmin was quantified as its coefficient in a multiple regression analysis that assessed the impacts of growing season Tmax, Tmin, precipitation and solar radiation downward on NDVI. NDVI gradually reaches saturation and provides a poor estimate of vegetation parameters with high vegetation cover. Even if the ground vegetation continues to grow, the NDVI does not increase with the change or only changes slightly (Haboudane et al. Citation2004), while the EVI continued to exhibit sensitivity to canopy variations (Huete et al. Citation2002). We also test the robustness of results by using EVI datasets. We used the time moving window assess the change of impacts of Tmax and Tmin on NDVI during 2000–2021.
3. Results
3.1. Spatial-temporal variations in vegetation greenness and climate factors
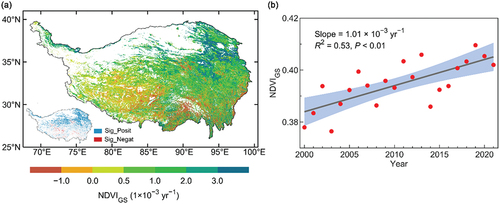
Most of study area experienced increasing trends in vegetation greenness during growing season (). We found that NDVI increased in 75.2% of all pixels during 2000–2021, particular in northeast, center and east, while a decreasing trend was observed in 24.8% of all pixels, mainly in the southwest and south (). In 30.1% and 2.2% of all pixels, NDVI showed a significantly increasing and decreasing trend (p < 0.05). In total, the growing season NDVI significantly increased by 1.01 × 10⁻³ yr−1 during 2000–2021 (p < 0.01, ). We found similar results when we used EVI, NIRv, LAI and SIF datasets (Lv et al. Citation2023).
Figure 3. (a) Spatial distribution of trends in growing season NDVI (NDVIGS) and (b) temporal variation in NDVIGS on the Tibetan Plateau during 2000–2021.
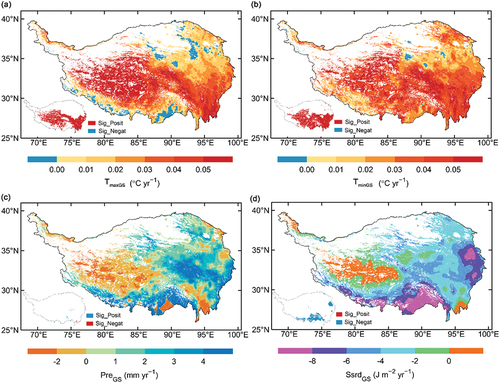
The increasing trends in regional averaged Tmin (0.0354°C yr−1, p < 0.01) were larger than that of Tmax (0.0333°C yr−1, p < 0.01) in growing season during 2000–2021. The regional average of precipitation showed an increasing trend, while the average solar radiation downward showed a decreasing trend, but neither trend was statistically significant. Spatially, growing season Tmax and Tmin increased in 93.5% and 99.1% of all pixels widespread in Tibetan Plateau, of which 49.5% and 59.1% were significant (p < 0.05, ). We further investigated the trends of growing season precipitation and solar radiation downward (). We observed 69.9% and 30.1% of all pixels displayed increasing and decreasing trends in growing season precipitation, of which 3.3% and 0.1% were significant at p < 0.05 level (). In contrast, the solar radiation downward showed decreasing trends in 88.2% of all pixels (12.7% significant).
Figure 4. Spatial distribution of trends in growing season (a) mean maximum temperature (TmaxGS), (b) minimum temperature (TminGS), (c) cumulative precipitation (PreGS), and (d) cumulative solar radiation downward (SsrdGS) during 2000–2021. The inset was trend of TmaxGS, TminGS, PreGS and SsrdGS at p < 0.05 level.
3.2. Response of daytime and nighttime temperature on the vegetation greenness
To quantify the proportion of the areas dominated by multiple drivers, we calculated the absolute value of the contribution of the explanatory variables by using ridge regression. The results showed that NDVI was dominated by Tmax, Tmin, precipitation and solar radiation downward in 28.7%, 28.8%, 19.9%, and 22.6% of the pixels (Fig. S1). The contributions of temperature (Tmax + Tmin) on NDVI were largest, exceeding half of the study area, mainly distributed in the southeast, center, east and some areas in west of the plateau. This implied that temperature dominates vegetation growth during the growing season. Due to the asymmetric warming, we further compared the partial correction between daytime and nighttime temperature and vegetation greenness.
During 2000–2021, for 42.2% of all pixels, the NDVI showed a positive correlation with Tmax (2.8% significant at p < 0.05), distributing in the southeast and south of the Tibetan Plateau (). A negative correlation between NDVI and Tmax was observed in 57.8% of all pixels (6.3% significant at p < 0.05), primarily concentrated in northwest, center and northeast regions. With regards to the Tmin, NDVI exhibited a positive correlation with Tmin in 58.8% of all pixels, with significance observed in 6.5% of the pixels, predominantly in northwest, center and northeast regions. The negative correlations between NDVI and Tmin were located in southeast, and the negative correlations were significant in 2.5% of the pixels (). To quantify the proportion of the areas dominated by Tmax and Tmin, we calculated synergistic effect of the explanatory variables (Fig. S2). During 2000–2021, the dominant factor influencing vegetation dynamics was the negative correlation between NDVI and Tmax alongside the positive correlation between NDVI and Tmin (Tmax-, Tmin+) was the dominant factor for 50.2% of all pixels, distributed in northwestern and eastern of alpine grasslands. For 33.6% of all pixels, NDVI exhibited a positive correlation with Tmax and a negative correlation with Tmin (Tmax+, Tmin-), mainly in southeastern and southern regions. Additionally, in 8.7% of all pixels, NDVI was positively correlated with both Tmax and Tmin in some areas in central plateau. NDVI was negatively correlated with Tmax and Tmin in 7.6% of the pixels in northwestern regions. We also found the NDVI exhibited stronger sensitivity to Tmin compared to Tmax ().
Figure 5. Spatial distribution of (a) and (b) partial correlation coefficient between growing season NDVI and maximum temperature (Tmax) and minimum temperature (Tmin), (c) and (d) sensitivity of growing season NDVI to Tmax and Tmin. variation in the proportion of pixels on partial correlation between growing season NDVI and (e) Tmax and (f) Tmin in different vegetation types (>5% of pixels). (g) variation (median: line; mean: solid circle) in changes in the partial correlation coefficient and (h) sensitivity between growing season NDVI and Tmax (the blue box) and Tmin (the orange box) in different vegetation types (>5% of pixels).
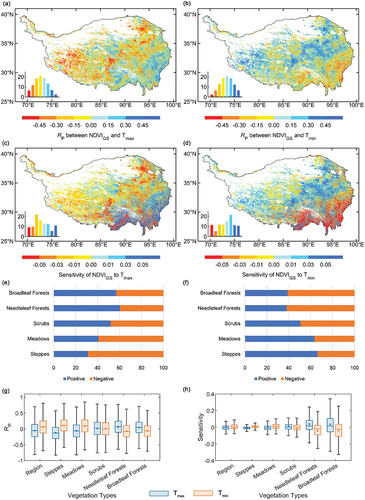
The proportion of pixels with a positive correlation between NDVI and Tmax was lowest in the steppes, followed by meadows, scrubs, needleleaf forests, and broadleaf forests. In contrast, more than 60% of the pixels in the steppe’s areas of exhibited a positive correlation between NDVI and Tmin, followed by meadows and scrubs, and forests were the lowest proportion of positive correlation between NDVI and Tmin. With the increase of vegetation cover, the proportion of pixels with a positive correlation between NDVI and Tmax increased, while Tmin showed a opposite distribution ().
Furthermore, the partial correlation coefficient and sensitivity of NDVI to Tmin were larger than that to Tmax among the entire region and different vegetation types, especially in alpine steppes and meadows regions, while, the partial correlation coefficient of NDVI to Tmax was larger than that to Tmin in the forest region (). These results suggested that Tmin had a more positive effect on grasslands than forests. The same result was also exhibited by using EVI dataset (Fig. S3).
In addition, we assessed the relationship between CSIF and Tmax and Tmin. To match NDVI dataset, the CSIF pixels (with 0.05° spatial resolution) were reserved that corresponding all NDVI pixels (with 500 m spatial resolution) have values. During 2000–2019, the CSIF was positively correlated with Tmin and negatively correlated with Tmax in grasslands and there was a reverse relation in forest (Fig. S4). This spatial pattern was similar to NDVI. Furthermore, we also examine the effect of CO2 to NDVI during 2000–2020 controlling with growing season Tmax, Tmin, precipitation and solar radiation downward. During 2000–2020, for 48.2% of all pixels, the NDVI was positively correlated with CO2 (3.6% significant), and the NDVI was negatively correlated with CO2 accounting for 51.8% of all pixels (4.1% significant, Fig. S5). The CO2 does not always have a positive impact on vegetation and even has a negative impact in most areas.
3.3. Changes in vegetation greenness in response to daytime and nighttime temperature at different period
We further investigated the response of NDVI to Tmax and Tmin across different periods (). We tested the changes of the partial correlation coefficients using moving window from 7 to 12 years. We identified the 9-year moving window as the most suitable for our analysis, given the significant changes observed in the partial correlation coefficients. We found that partial correlation coefficients between NDVI and Tmax decreased (p < 0 05) at an average rate of 0.056 yr−1 from 2000 to 2021 under the 9-year moving window (), and the partial correlation coefficients between NDVI and Tmin increased at an average rate of 0.060 yr−1 (p < 0.05, ). Over the past 20 years, there were significantly increasing trends in response of NDVI to both Tmax and Tmin on the Tibetan Plateau, and the magnitude of changes of the partial correlation coefficient between NDVI and Tmin was higher than that of Tmax but stabilized in recent years. Spatially, the relationship between NDVI and Tmax/Tmin experienced increases, mainly concentrated in the grassland areas in the northeastern, east-central and northwestern of the Tibetan Plateau (Figs. S6 and S7).
Figure 6. (a) Temporal variations in partial correlation coefficient between growing season NDVI and maximum temperature and (b) minimum temperature from 7-year–12-year moving window.
4. Discussion
4.1. Asymmetric effects of temperature in response to vegetation greenness on the Tibetan Plateau
From 2000 to 2021, the growing season Tmax and Tmin showed significantly increasing trends (p < 0.05) on the Tibetan Plateau, and there was an asymmetry warming that the rate of warming at nighttime was higher than that daytime. The findings align with the previous studies (You et al. Citation2016). In the grassland of the Tibetan Plateau, there was a higher proportion of pixels with a positive correlation between NDVI and Tmin compared to those with a positive correlation between NDVI and Tmax during the growing season (). Additionally, the partial correlation coefficient of NDVI on Tmin was observed to be higher than that on Tmax (). These findings suggested that Tmin had a greater impact on vegetation than Tmax in the grassland region of the Tibetan Plateau. Conversely, in the forest region, the opposite result was observed, where Tmax had a greater impact on vegetation than Tmin.
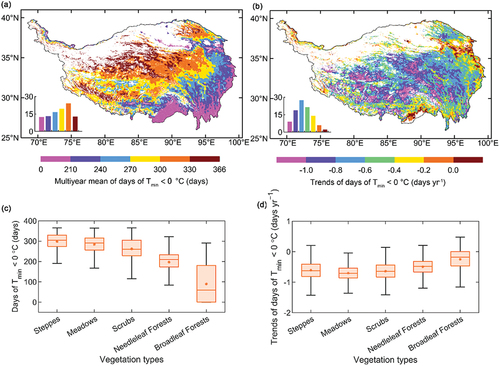
First, the warming of nighttime temperatures (Tmin) could reduce the risk of frost especially in grassland (Shen et al. Citation2016). The multiyear mean of the days of Tmin <0°C is more than 210 days in more than 75% of the region of the Tibetan Plateau and the number of days of Tmin <0°C increased from the southeast to the northwest (). Steppes have the highest number of Tmin <0°C at 298 days, following by meadows. The broadleaf forests show the smallest number of Tmin <0°C at 89 days (). During 2000–2021, the number of days with a minimum temperature below 0°C shows a decreasing trend in 96.9% of all pixels (56.8% significant, p < 0.05), widely distributed over most of the study area (). Fewer days below 0°C in grasslands than in forested areas (). Therefore, grassland areas are exposed to greater frost risk than forest areas. The nighttime warming reduces the frequency of low temperatures and protects vegetation against frost damage (S. Peng et al. Citation2013; Shen et al. Citation2016).
Figure 7. Spatial distribution of (a) multiyear mean of days of growing season mean minimum temperature (Tmin) < 0°C and (b) trends of days of Tmin < 0°C on the Tibetan Plateau during 2000–2021, (c) multiyear mean of days of Tmin < 0°C and (d) trends of days of Tmin < 0°C among different vegetation types (>5% of pixels).
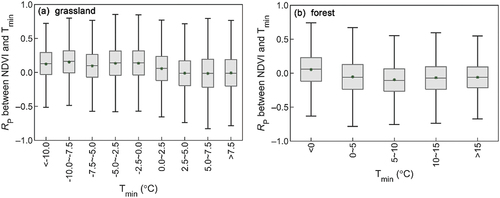
Secondly, vegetation growth in grasslands was still limited by low temperature in the Tibetan Plateau. We observed a positive correlation between NDVI and Tmin where Tmin was below 0°C in grasslands (), and vegetation growth might be limited by low Tmin. However, only 2.05% of forest areas have Tmin <0°C and the correlation between NDVI and Tmin is close to 0 (). At the same time, very low temperatures could damage the cell structure of the vegetation (Shen et al. Citation2016), therefore higher Tmin could promote vegetation growth by reducing the limitation of low temperature in grasslands than forests.
Figure 8. Variations of partial correlation coefficient (RP) between growing season NDVI and minimum temperature (Tmin) with minimum temperature in (a) grasslands (including steppes and meadows) and (b) forests (including needleleaf forests, broadleaf forests).
In addition, nighttime warming could enhance leaf respiration, leading to greater consumption of synthesized carbohydrates. This phenomenon may trigger a compensatory stimulation of photosynthesis in the following day (S. Peng et al. Citation2013; Zheng et al. Citation2022). Further, nighttime warming has been shown to be strongly associated with increased humidity and precipitation (Cox et al. Citation2020; Liu et al. Citation2023). Global asymmetry study suggested that nighttime warming was often accompanied by wetter climatic conditions, possibly due to changes in cloud cover (Cox et al. Citation2020). Thus, nighttime warming may lead to enhanced moisture effectiveness and promote vegetation growth.
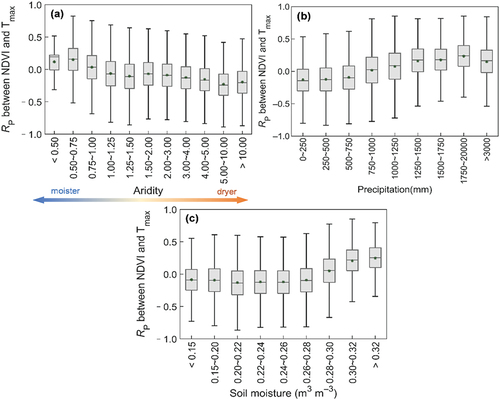
The negative effect of daytime temperature on NDVI in grassland areas may be affected by warming-induced drought stress. In this study, we found that grassland NDVI was positively correlated with Tmax when aridity < 1.00, then the NDVI correlation between NDVI and Tmax showed a negative value while the negative relation was stronger from −0.06 at aridity of 1.00 ~ 1.25 to −0.19 at aridity > 10.00 in drier areas (). Furthermore, NDVI was negatively correlated with Tmax in low growing season precipitation lower than 750 mm and the partial correlation coefficient changed to positive value and remained stable with the increase of precipitation. The variations of relation between growing season NDVI and Tmax with soil moisture showed same pattern as precipitation. This suggests that the aridity may be influenced by surface soil moisture. Warmer daytime temperatures enhance evapotranspiration from vegetation and reduce soil surface moisture (Peng et al. Citation2013), and at the same time, warmer daytime temperatures also lead to an increase in the water vapor pressure difference. The lack of water vapor pressure coupled with lower precipitation in the region may reduce the time of stomatal opening (Peng et al. Citation2013; Zheng et al. Citation2022), which may increase the drought stress and then affect the vegetation growth.
Figure 9. Variations of partial correlation coefficient between growing season NDVI and maximum temperature (Tmax) with (a) aridity, (b) multiyear mean of growing season precipitation during 2000–2021 and (c) multiyear mean of growing season soil moisture during 2001–2020 (due to data gaps in 2000 and 2021) on the Tibetan Plateau grasslands (including steppes and meadows).
In forest areas, Tmax has a greater effect on vegetation than Tmin. This is likely attributed to the prevailing temperatures not reaching the optimal temperature for vegetation growth (Chen et al. Citation2021). Moreover, the regions have sufficient precipitation, so daytime warming can effectively increase photosynthetic enzyme activities, soil nitrogen effectiveness, and thus increasing the rate of plant photosynthesis and thus growth (Melillo et al. Citation2002; Turnbull, Murthy, and Griffin Citation2002).
4.2. Changes in the effect of asymmetric warming on vegetation greenness on the Tibetan Plateau
Based on the results of partial correlation and least squares regression using a 9-year moving window, it has been found that Tmax has a negative impact on NDVI, whereas Tmin has a positive impact on NDVI in the Tibetan Plateau from 2000–2021 (). As time passes, there is a significant increasing trend for the response of NDVI to Tmax and Tmin of the growing season. It is worth noting that vegetation growth may be limited by low temperatures and frost risk (S. Peng et al. Citation2013; Shen et al. Citation2016). As nighttime temperatures increase, it becomes beneficial for vegetation to reduce temperature limitation and frost risk, which in turn promotes vegetation growth and leads to an increase in vegetation greenness. Consequently, this leads to an increase in the relation of NDVI to Tmin. However, higher daytime temperatures, possibly due to excessive evapotranspiration, coupled with precipitation below 600 mm in most regions of the Tibetan Plateau (Wang et al. Citation2020), would increase drought stress and slow down vegetation growth. This would eventually lead to an increase in the absolute value of the negative correlation coefficient of NDVI to Tmax. However, we also found the strength remained stable in recent years, which might be due to greater adaptability to temperature under warming conditions (Shi et al. Citation2015).
4.3. Uncertainties and prospects
In this study, we concentrated the impact of warming on vegetation growth using the ridge regression method to determine the main climate factors. However, the environmental and anthropogenic factors are complex. Vegetation growth is also affected by precipitation (Sun et al. Citation2019), nitrogen deposition (Yang et al. Citation2011), land use changes (Song, Feng, and Wang Citation2022) and human activities (Huang et al. Citation2022; Pan et al. Citation2017; Y. Wang et al. Citation2022; Yu et al. Citation2016). Since 2003, grazing separation by fencing has become a common practice on the Tibetan Plateau to grassland restoration. It has been reported that about one third of the northern Tibetan area was fenced between 2004 and 2012, and the fencing could increase the above-ground biomass of degraded grasslands (Y. Wang et al. Citation2022; Yu et al. Citation2016). In addition, reforestation have also increased the vegetation cover in the Tibetan Plateau (Song, Feng, and Wang Citation2022). In the future, we should reinforce the comprehensive evaluation of vegetation growth. Moreover, we also found the different response of asymmetric warming on vegetation growth between grasslands and forests. This could provide a foundation for improving performance of vegetation dynamic models.
5. Conclusions
In this study, we analyzed the vegetation greenness change of growing season response to daytime and nighttime warming during 2000–2021 by using ridge regression and partial correlation analysis method. Furthermore, we assessed the changes of relationship between vegetation greenness and asymmetric warming over time. The findings clearly indicate that vegetation greenness showed an increasing trend during 2000–2021 and is influenced by temperature in more than half of the Tibetan Plateau. The daytime and nighttime temperatures of growing season in the Tibetan Plateau showed a significantly increasing trend (p < 0.05), but the rate of nighttime warming was higher than that during the daytime. In the grassland region of the Tibetan Plateau, nighttime temperature has a stronger effect on vegetation growth than daytime temperatures, likely attribution to a reduction in low-temperature limit and frost risk by nighttime warming. The positive effect of daytime warming on vegetation limited by precipitation due to drought stress on grassland regions. In forest areas, higher daytime temperatures can promote photosynthesis in vegetation due to the abundance of precipitation. With global warming, there is a greater effect between daytime and nighttime temperature on vegetation.
20240422_Supplementary Figures.docx
Download MS Word (5.9 MB)Disclosure statement
No potential conflict of interest was reported by the author(s).
Data availability statement
All the data used for this study are publicly available online. MOD13A1 NDVI and EVI, https://lpdaac.usgs.gov/products/mod13a1v061/; ERA5-Land dataset, https://cds.climate.copernicus.eu/; Elevation data, https://lpdaac.usgs.gov/products/srtmgl1v003/; vegetation types data, https://www.plantplus.cn/dsite/zhibei/b12.html.
Supplementary material
Supplemental data for this article can be accessed online at https://doi.org/10.1080/15481603.2024.2348257.
Additional information
Funding
References
- Cao, R., Z. Xu, Y. Chen, J. Chen, and M. Shen. 2022. “Reconstructing High-Spatiotemporal-Resolution (30 M and 8-Days) NDVI Time-Series Data for the Qinghai–Tibetan Plateau from 2000–2020.” Remote Sensing 14 (15): 3648. https://doi.org/10.3390/rs14153648.
- Chen, L., H. Hänninen, S. Rossi, N. G. Smith, S. Pau, Z. Liu, G. Feng, J. Gao, and J. Liu. 2020. “Leaf Senescence Exhibits Stronger Climatic Responses During Warm Than During Cold Autumns.” Nature Climate Change 10 (8): 777–16. https://doi.org/10.1038/s41558-020-0820-2.
- Chen, A., L. Huang, Q. Liu, and S. Piao. 2021. “Optimal Temperature of Vegetation Productivity and Its Linkage with Climate and Elevation on the Tibetan Plateau.” Global Change Biology 27 (9): 1942–1951. https://doi.org/10.1111/gcb.15542.
- Chen, C., T. Park, X. Wang, S. Piao, B. Xu, R. K. Chaturvedi, R. Fuchs, et al. 2019. “China and India Lead in Greening of the World Through Land-Use Management.” Nature Sustainability 2: 122–129.
- Cong, N., M. Shen, W. Yang, Z. Yang, G. Zhang, and S. Piao. 2017. “Varying Responses of Vegetation Activity to Climate Changes on the Tibetan Plateau Grassland.” International Journal of Biometeorology 61: 1433–1444.
- Cox, D. T. C., I. M. D. Maclean, A. S. Gardner, and K. J. Gaston. 2020. “Global Variation in Diurnal Asymmetry in Temperature, Cloud Cover, Specific Humidity and Precipitation and Its Association with Leaf Area Index.” Global Change Biology 26 (12): 7099–7111. https://doi.org/10.1111/gcb.15336.
- Didan, K. 2021. MODIS/Terra Vegetation Indices 16-Day L3 Global 500m SIN Grid V061 [Data set]. NASA EOSDIS Land Processes Distributed Active Archive Center. https://doi.org/10.5067/MODIS/MOD13A1.061.
- Ding, Z., J. Peng, S. Qiu, and Y. Zhao. 2020. “Nearly Half of Global Vegetated Area Experienced Inconsistent Vegetation Growth in Terms of Greenness, Cover, and Productivity.” Earth’s Future 8 (10): e2020EF001618.
- Du, Z., J. Zhao, X. Liu, Z. Wu, and H. Zhang. 2019. “Recent Asymmetric Warming Trends of Daytime versus Nighttime and Their Linkages with Vegetation Greenness in Temperate China.” Environmental Science and Pollution Research 26 (35): 35717–35727. https://doi.org/10.1007/s11356-019-06440-z.
- Forzieri, G., D. G. Miralles, P. Ciais, R. Alkama, Y. Ryu, G. Duveiller, K. Zhang, et al. 2020. “Increased Control of Vegetation on Global Terrestrial Energy Fluxes.” Nature Climate Change 10: 356–362.
- Ge, W., L. Deng, F. Wang, and J. Han. 2021. “Quantifying the Contributions of Human Activities and Climate Change to Vegetation Net Primary Productivity Dynamics in China from 2001 to 2016.” Science of the Total Environment 773: 145648.
- Graham, M. H. 2003. “Confronting Multicollinearity in Ecological Multiple Regression.” Ecology 84 (11): 2809–2815. https://doi.org/10.1890/02-3114.
- Haboudane, D., J. R. Miller, E. Pattey, P. J. Zarco-Tejada, and I. B. J. R. S. O. E. Strachan. 2004. “Hyperspectral Vegetation Indices and Novel Algorithms for Predicting Green LAI of Crop Canopies: Modeling and Validation in the Context of Precision Agriculture.” Remote Sensing of Environment 90 (3): 337–352. https://doi.org/10.1016/j.rse.2003.12.013.
- Huang, Y., Z. Xin, T. Dor‐Ji, and Y. Wang. 2022. “Tibetan Plateau Greening Driven by Warming‐Wetting Climate Change and Ecological Restoration in the 21st Century.” Land Degradation & Development 33 (14): 2407–2422. https://doi.org/10.1002/ldr.4319.
- Huete, A., K. Didan, T. Miura, E. P. Rodriguez, X. Gao, and L. G. J. R. S. O. E. Ferreira. 2002. “Overview of the Radiometric and Biophysical Performance of the MODIS Vegetation Indices.” Remote Sensing of Environment 83 (1–2): 195–213. https://doi.org/10.1016/S0034-4257(02)00096-2.
- Jiao, D., N. Xu, F. Yang, and K. Xu. 2021. “Evaluation of Spatial-Temporal Variation Performance of ERA5 Precipitation Data in China.” Scientific Reports 11 (1). https://doi.org/10.1038/s41598-021-97432-y.
- Liu, Y., C. Wu, X. Wang, and Y. Zhang. 2023. “Contrasting Responses of Peak Vegetation Growth to Asymmetric Warming: Evidences from FLUXNET and Satellite Observations.” Global Change Biology 29 (8): 2363–2379. https://doi.org/10.1111/gcb.16592.
- Li, X., K. Zhang, and X. Li. 2022. “Responses of Vegetation Growth to Climate Change Over the Tibetan Plateau from 1982 to 2018.” Environmental Research Communications 4 (4): 045007.
- Li, X., K. Zhang, and X. Li. 2023. “The Minimum Temperature Outweighed the Maximum Temperature in Determining Plant Growth Over the Tibetan Plateau from 1982 to 2017.” Remote Sensing 15: 4032.
- Li, L., Y. Zhang, L. Liu, J. Wu, Z. Wang, S. Li, H. Zhang, J. Zu, M. Ding, and B. Paudel. 2018. “Spatiotemporal Patterns of Vegetation Greenness Change and Associated Climatic and Anthropogenic Drivers on the Tibetan Plateau During 2000–2015.” Remote Sensing 10 (10): 1525. https://doi.org/10.3390/rs10101525.
- Lv, J., W. Yang, M. Shen, E. Liang, Y. Jiang, J. Chen, X. Chen, et al. 2024. “Winter Greening on the Tibetan Plateau Induced by Climate Warming Over 2000-2021.” Forest Ecology & Management 558: 121796. https://doi.org/10.1016/j.foreco.2024.121796.
- Lv, J., W. Zhao, T. Hua, L. Zhang, and P. Pereira. 2023. “Multiple Greenness Indexes Revealed the Vegetation Greening During the Growing Season and Winter on the Tibetan Plateau Despite Regional Variations.” Remote Sensing 15 (24): 5697. https://doi.org/10.3390/rs15245697.
- Melillo, J., P. Steudler, J. Aber, K. Newkirk, H. Lux, F. Bowles, C. Catricala, A. Magill, T. Ahrens, and S. Morrisseau. 2002. “Soil Warming and Carbon-Cycle Feedbacks to the Climate System.” Science 298 (5601): 2173–2176. https://doi.org/10.1126/science.1074153.
- Pan, T., X. Zou, Y. Liu, S. Wu, and G. He. 2017. “Contributions of Climatic and Non-Climatic Drivers to Grassland Variations on the Tibetan Plateau.” Ecological engineering 108:307–317. https://doi.org/10.1016/j.ecoleng.2017.07.039.
- Peng, Y., A. Duan, C. Zhang, B. Tang, and X. Zhao. 2023. “Evaluation of the Surface Air Temperature Over the Tibetan Plateau Among Different Reanalysis Datasets.” Frontiers in Environmental Science 11: 11. https://doi.org/10.3389/fenvs.2023.1152129.
- Peng, J., Z. Liu, Y. Liu, J. Wu, and Y. Han. 2012. “Trend Analysis of Vegetation Dynamics in Qinghai–Tibet Plateau Using Hurst Exponent.” Ecological Indicators 14 (1): 28–39. https://doi.org/10.1016/j.ecolind.2011.08.011.
- Peng, S., S. Piao, P. Ciais, R. B. Myneni, A. Chen, F. Chevallier, A. J. Dolman, et al. 2013. “Asymmetric Effects of Daytime and Night-Time Warming on Northern Hemisphere Vegetation.” Nature 501 (7465): 88–92. https://doi.org/10.1038/nature12434.
- Piao, S., H. Nan, C. Huntingford, P. Ciais, P. Friedlingstein, S. Sitch, S. Peng, et al. 2014. “Evidence for a Weakening Relationship Between Interannual Temperature Variability and Northern Vegetation Activity.” Nature Communications 5: 1–7.
- Piao, S., X. Wang, T. Park, C. Chen, X. Lian, Y. He, J. W. Bjerke, et al. 2019. “Characteristics, Drivers and Feedbacks of Global Greening.” Nature Reviews Earth and Environment 1: 14–27.
- Shangguan, Y., X. Min, and Z. Shi. 2023. “Inter-Comparison and Integration of Different Soil Moisture Downscaling Methods Over the Qinghai-Tibet Plateau.” Journal of Hydrology 617:129014. https://doi.org/10.1016/j.jhydrol.2022.129014.
- Shen, M. G., S. L. Piao, X. Q. Chen, S. An, Y. S. H. Fu, S. P. Wang, N. Cong, and I. A. Janssens. 2016. “Strong Impacts of Daily Minimum Temperature on the Green-Up Date and Summer Greenness of the Tibetan Plateau.” Global Change Biology 22 (9): 3057–3066. https://doi.org/10.1111/gcb.13301.
- Shi, P., D. Xiong, X. Yang, Z. Liu, M. Xu, F. Ge, Y. Sun, G. Zhou, Q. He, and N. J. C. E. R. I. C. Li. 2015. “Impacts and Its Adaptation of Global Change Li, Wenhua.” In Contemporary Ecology Research in China, edited by W. Li, 469–496. Springer, Berlin, Heidelberg. https://doi.org/10.1007/978-3-662-48376-3_16.
- Sobrino, J. A., Y. Julien, and S. García-Monteiro. 2020. “Surface Temperature of the Planet Earth from Satellite Data.” Remote Sensing 12 (2): 218. https://doi.org/10.3390/rs12020218.
- Song, W., Y. Feng, and Z. Wang. 2022. “Ecological Restoration Programs Dominate Vegetation Greening in China.” Science of the Total Environment 848:157729. https://doi.org/10.1016/j.scitotenv.2022.157729.
- Sun, J., T. Zhou, W. Du, and Y. Wei. 2019. “Precipitation Mediates the Temporal Dynamics of Net Primary Productivity and Precipitation Use Efficiency in China’s Northern and Southern Forests.” Annals of Forest Science 76 (3). https://doi.org/10.1007/s13595-019-0876-1.
- Turnbull, M. H., R. Murthy, and K. L. Griffin. 2002. “The Relative Impacts of Daytime and Night-Time Warming on Photosynthetic Capacity in Populus Deltoides.” Plant, Cell & Environment 25 (12): 1729–1737. https://doi.org/10.1046/j.1365-3040.2002.00947.x.
- Wang, J., X. Chen, Q. Hu, and J. Liu. 2020. “Responses of Terrestrial Water Storage to Climate Variation in the Tibetan Plateau.” Journal of Hydrology 584:124652. https://doi.org/10.1016/j.jhydrol.2020.124652.
- Wang, Y.-R., D. O. Hessen, B. H. Samset, and F. Stordal. 2022. “Evaluating Global and Regional Land Warming Trends in the Past Decades with Both MODIS and ERA5-Land Land Surface Temperature Data.” Remote Sensing of Environment 280:113181. https://doi.org/10.1016/j.rse.2022.113181.
- Wang, Y., W. Lv, K. Xue, S. Wang, L. Zhang, R. Hu, H. Zeng, et al. 2022. “Grassland Changes and Adaptive Management on the Qinghai–Tibetan Plateau.” Nature Reviews Earth and Environment 3 (10): 668–683. https://doi.org/10.1038/s43017-022-00330-8.
- Wu, K., J. Chen, H. Yang, Y. Yang, and Z. Hu. 2023. “Spatiotemporal Variations in the Sensitivity of Vegetation Growth to Typical Climate Factors on the Qinghai–Tibet Plateau.” Remote Sensing 15 (9): 2355. https://doi.org/10.3390/rs15092355.
- Xia, H., A. Li, G. Feng, Y. Li, Y. Qin, G. Lei, and Y. Cui. 2018. “The Effects of Asymmetric Diurnal Warming on Vegetation Growth of the Tibetan Plateau Over the Past Three Decades.” Sustainability 10 (4): 1103.
- Xie, J., G. Yin, D. Ma, R. Chen, W. Zhao, Q. Xie, C. Wang, S. Lin, and W. Yuan. 2024. “Climatic Limitations on Grassland Photosynthesis Over the Tibetan Plateau Shifted from Temperature to Water.” Science of the Total Environment 906:167663. https://doi.org/10.1016/j.scitotenv.2023.167663.
- Xu, B., J. Li, X. Pei, and H. Yang. 2023. “Decoupling the Response of Vegetation Dynamics to Asymmetric Warming Over the Qinghai-Tibet Plateau from 2001 to 2020.” Journal of Environmental Management 347:119131. https://doi.org/10.1016/j.jenvman.2023.119131.
- Yang, Y., J. Guo, G. Wang, L. Yang, and Y. Yang. 2011. “Effects of Drought and Nitrogen Addition on Photosynthetic Characteristics and Resource Allocation of Abies Fabri Seedlings in Eastern Tibetan Plateau.” New Forests 43 (4): 505–518. https://doi.org/10.1007/s11056-011-9295-3.
- Yao, T., T. Bolch, D. Chen, J. Gao, W. Immerzeel, S. Piao, F. Su, et al. 2022. “The Imbalance of the Asian Water Tower.” Nature Reviews Earth and Environment 3 (10): 618–632. https://doi.org/10.1038/s43017-022-00299-4.
- You, Q., Z. Cai, N. Pepin, D. Chen, B. Ahrens, Z. Jiang, F. Wu, et al. 2021. “Warming Amplification Over the Arctic Pole and Third Pole: Trends, Mechanisms and Consequences.” Earth Science Review 217:103625. https://doi.org/10.1016/j.earscirev.2021.103625.
- You, Q., J. Min, Y. Jiao, M. Sillanpää, and S. Kang. 2016. “Observed Trend of Diurnal Temperature Range in the Tibetan Plateau in Recent Decades.” International Journal of Climatology 36 (6): 2633–2643. https://doi.org/10.1002/joc.4517.
- Yu, C., X. Zhang, J. Zhang, S. Li, C. Song, Y. Fang, S. Wurst, and J. Wu. 2016. “Grazing Exclusion to Recover Degraded Alpine Pastures Needs Scientific Assessments Across the Northern Tibetan Plateau.” Sustainability 8 (11): 1162. https://doi.org/10.3390/su8111162.
- Zhang, X. 2007. Vegetation Map of the People’s Republic of China, (1:1 000 000). Vol. 1. Beijing: Geology Press.
- Zhang, Y., J. Joiner, S. H. Alemohammad, S. Zhou, and P. Gentine. 2018. “A Global Spatially Contiguous Solar-Induced Fluorescence (CSIF) Dataset Using Neural Networks.” Biogeosciences 15 (19): 5779–5800. https://doi.org/10.5194/bg-15-5779-2018.
- Zhang, C., D.-H. Qin, and P.-M. Zhai. 2023. “Amplification of Warming on the Tibetan Plateau.” Advances in Climate Change Research 14 (4): 493–501. https://doi.org/10.1016/j.accre.2023.07.004.
- Zhang, L., M. Shen, N. Jiang, J. Lv, L. Liu, and L. Zhang. 2023. “Spatial Variations in the Response of Spring Onset of Photosynthesis of Evergreen Vegetation to Climate Factors Across the Tibetan Plateau: The Roles of Interactions Between Temperature, Precipitation, and Solar Radiation.” Agricultural and Forest Meteorology 335:109440. https://doi.org/10.1016/j.agrformet.2023.109440.
- Zhang, L., M. Shen, C. Shi, F. Shi, N. Jiang, Z. Yang, and Z. Ji. 2021. “Local Climatic Factors Mediated Impacts of Large-Scale Climate Oscillations on the Growth of Vegetation Across the Tibetan Plateau.” Frontiers in Environmental Science 9:597971. https://doi.org/10.3389/fenvs.2021.597971.
- Zhang, G., F. Yang, and H. Long. 2023. “Save the Life-Sustaining Mattic Layer on the Qinghai-Tibetan Plateau.” The Innovation 4 (3): 100418. https://doi.org/10.1016/j.xinn.2023.100418.
- Zheng, L., D. Li, J. Xu, Z. Xia, H. Hao, and Z. Chen. 2022. “A Twenty-Years Remote Sensing Study Reveals Changes to Alpine Pastures Under Asymmetric Climate Warming.” Isprs Journal of Photogrammetry & Remote Sensing 190:69–78. https://doi.org/10.1016/j.isprsjprs.2022.06.001.
- Zheng, L., Y. Qi, Z. Qin, X. Xu, and J. Dong. 2021. “Assessing Albedo Dynamics and Its Environmental Controls of Grasslands Over the Tibetan Plateau.” Agricultural and Forest Meteorology 307:108479. https://doi.org/10.1016/j.agrformet.2021.108479.
- Zheng, Z., Y. Zhang, J. Zhu, and N. Cong. 2021b. “Daytime Temperature Contributes More Than Nighttime Temperature to the Weakened Relationship Between Climate Warming and Vegetation Growth in the Extratropical Northern Hemisphere.” Ecological indicators 131: 108203.
- Zhong, Z., B. He, H. W. Chen, D. Chen, T. Zhou, W. Dong, C. Xiao, et al. 2023. “Reversed Asymmetric Warming of Sub-Diurnal Temperature Over Land During Recent Decades.” Nature Communications 14 (1): 7189.
- Zhu, Z. S. Piao, R. B. Myneni, M. Huang, Z. Zeng, J. G. Canadell, P. Ciais, et al. 2016. “Greening of the Earth and Its Drivers.” Nature Climate Change 6: 791–795.
- Zhu, B., Z. Zhang, J. Tian, R. Kong, and X. Chen. 2022. “Increasing Negative Impacts of Climatic Change and Anthropogenic Activities on Vegetation Variation on the Qinghai–Tibet Plateau During 1982–2019.” Remote Sensing 14 (19): 4735.