
 ?Mathematical formulae have been encoded as MathML and are displayed in this HTML version using MathJax in order to improve their display. Uncheck the box to turn MathJax off. This feature requires Javascript. Click on a formula to zoom.
ABSTRACT
This paper proposes a methodology for the optimal design of series of sewer pipes including pumping stations. It employs a Shortest Path Algorithm to select the optimal combination of pipe diameters and invert elevations, as well as the optimal pumping features such as the number of pumps, location, and pumping head. The methodology is intended to be applied to the design of any sewer series. Although these are uncommon in real infrastructure, the study allows an analysis of the effect of pipe roughness, inflows, and pipe length on the total cost of the system and pumping features. The methodology was tested in theoretical series of 10 and 20 pipes as well as in a real series that is part of the sewer system of Bogotá, Colombia. The resulting designs suggested that using smooth pipes and reducing the pumping flow rate would decrease the cost of sewer systems in flat terrain.
1. Introduction
Despite significant progress in recent years, universal access to sanitation is a persistent issue for humanity today. According to estimates from the United Nations, if current rates of progress continue, by 2030 an estimated 2.8 billion people will lack access to safe sanitation (UN Citation2022). One of the main contributing factors to this problem is the lack of funding for the construction of adequate sewer systems.
In order to achieve Goal 6 of the Sustainable Development Goals, which aims to ensure access to water and sanitation for all, it is crucial to develop methodologies to minimize the cost of sewer system designs, which is the objective of the hydraulic design. The hydraulic design problem focuses on finding the lowest-cost combination of pipe diameters and invert elevations that complies with all necessary hydraulic and commercial constraints for a given layout or a series of pipes.
In literature, many authors have proposed different approaches to solve the optimal hydraulic design problem. For example, multiple methodologies are based on mathematical programming (MP), such as linear programming (Safavi and Geranmehr Citation2016; Swamee and Sharma Citation2013), nonlinear programming (Alfaisal and Mays Citation2021; Swamee Citation2001) and dynamic programming (Duque et al. Citation2020; Duque, Duque, and Saldarriaga Citation2016; Li and Matthew Citation1990). Particularly, Duque et al’.s methodologies models pipes and manholes with graph theory and finds the optimal solution through a Shortest Path Algorithm. However, due to the high computational resources required for MP, various authors have employed metaheuristics such as ant colony optimization (M. H. Afshar Citation2010; Moeini and Afshar Citation2012, Citation2017), particle swarm optimization (Ahmadi, Zolfagharipoor, and Nafisi Citation2018), simulated annealing and tabu search (Haghighi and Bakhshipour Citation2015; Steele et al. Citation2016; Yeh, Chang, and Lin Citation2013), cellular automata (M. H. Afshar, Zaheri, and Kim Citation2016; Zaheri, Ghanbari, and Afshar Citation2019) and genetic algorithms (GA) (M. H. Afshar Citation2012; M. Afshar et al. Citation2006; Haghighi and Bakhshipour Citation2012; Palumbo et al. Citation2013). Thanks to the versatility of GA, multiple combinations with hydrologic and hydraulic models (Cozzolino et al. Citation2015), heuristic programming (Hassan, Jassem, and Mohammed Citation2017) and quadratic programming (Pan and Kao Citation2009) have also been proposed.
However, when the sewer system is located in flat terrains, the hydraulic design becomes a more complex problem because pumping stations may be required to comply with hydraulic constraints and excavation limits. The reason for this is that gentle terrain slopes lead to high excavation depths, which can cause problems with low velocities and difficulty meeting the minimum shear stress in pipes. Nevertheless, the addition of pumping stations to the sewer design significantly increases the cost of the system due to their construction and operation costs. Therefore, the location and pump head should be considered in the hydraulic design problem to minimize the total cost of the system.
In existing literature, different features of pumping stations in sewer systems have been studied. For example, Ibrahim et al. (Citation2011) used a Multi-Criteria Decision Making technique, fuzzy theory and Geographical Information System to find the best location for pumping stations in a sewage system, Cabral et al. (Citation2018) constructed a cost function with statistical analysis to estimate the construction cost of such structures, and Wilcoxson and Crane (Citation2013) proposed an operational control method for pumping stations that reduces energy demands.
Furthermore, some authors have studied the addition of pumping stations in sewer systems design. Li and Matthew (Citation1990) solved the hydraulic design problem with discrete differential dynamic programming considering the effect of online pump stations and concluded that the optimal design resulted when a balance between excavation depth and the number of on-line pumping stations was achieved. Similarly, Zeferino et al. (Citation2009) used the simulated annealing algorithm including pump stations to lift wastewater when it resulted unfeasible or uneconomic to drain it by gravity. The use of GA has also been present. Pan and Kao (Citation2009) developed a model based on GA combined with quadratic programming where pumping station locations were included as decision variables, while Haghighi and Bakhshipour (Citation2012) used an adaptative GA including sewer diameters, slopes, and pumping stations. Additionally, Rohani and Afshar (Citation2014) proposed a hybrid model of the GA and the general hybrid cellular automata algorithm (GHCA) to optimally design a fixed layout, where the GA defines both pumping station locations and/or pumping heads and the GHCA determines the rest. Recently, Atiyah and Hassan (Citation2021) also proposed the implementation of an adaptative GA for the design of a fixed layout solving for the optimal location of pump stations, pipe diameters, and slopes.
Although several studies have been developed on the incorporation of pumping stations in hydraulic design, none of the proposed methodologies guarantees optimality of the designs cost. Hence, the present study aims to propose a methodology for the optimized design of pipe series, including pumping stations, which is especially relevant in flat terrain to minimize excessive excavation. To this end, the proposed methodology is based on the approach of Duque et al. (Citation2016) for the design of pipe series, in which a Shortest Path Algorithm is used to identify the optimal combination of diameters and invert elevations.
In addition to optimize the diameters and invert elevations, the current paper seeks to find the optimal number of pumping stations, their location, and their pumping flow rate and head. Moreover, a cost equation is proposed to model the cost of pumping stations, which includes the cost of construction and operation. The current work also includes a sensitivity analysis to determine the influence of material roughness, inflow per manhole, and pipe length on the total cost of the series and their pumping features.
As mentioned above, the current study focuses on the design of series of pipes, which are sets of pipes located one behind the other that do not require a layout selection since they do not have a tree-like structure. The optimal design of series of pipes is relevant specially in large cities where the sewer network principally consists of main sewer lines. Furthermore, this design approach is applicable when it is required to extend an existing sewer system. The present study serves as a tool for optimizing these applications, specifically in flat terrains.
2. Methods
2.1. Optimal design of series of pipes
The methodology here proposed is based on the work of Duque et al. (Citation2016). In their approach, the known data for the problem are the inflow to each manhole, the spatial location and ground elevation of the manholes and the outfall, and the order of the manholes from upstream to downstream; that is, the order of the pipes in the series is defined.
Considering the known information, the hydraulic design is modelled as a directed graph composed of nodes and arcs. The nodes represent all possible combinations of available diameters and discrete invert elevations at each manhole. This means that every manhole has as many nodes as possible combinations of diameters and invert elevations. As for the arcs, they represent the diameter and invert elevation of a particular pipe by connecting two nodes from the upstream and downstream manhole of the pipe. Each arc has an associated cost that depends on the invert elevations of the nodes that joins, and the diameter of the downstream node.
shows an example of the nodes and arcs in the hydraulic design model. The circles represent the nodes, each of them with its respective diameter and invert elevation. The different sizes of the circles represent the available diameters for pipes. In this example, there are only four possible diameters, but in the model any number of diameters could be used. The grey horizontal rectangles represent the discrete invert elevations; the figure presents only four invert elevations, but in the actual model could be more. Finally, the grey arrows represent the feasible arcs, and the black nodes and arc are those selected as optimal by the Shortest Path Algorithm.
Figure 1. Example of nodes and arcs in hydraulic design model.
Note that in the end nodes of the arcs have the same or a greater diameter that the start nodes; this is a usual constraint in sewer systems. The same applies to the invert elevations, the end nodes have the same or a deeper invert elevation than its start nodes. These constraints allow for a feasible sewer design and avoids blockages in pipes.
The hydraulic design problem defines the diameter and invert elevation of the sewer pipes. In order to find the optimal combination of these features, the Bellman-Ford algorithm is used. This is a Shortest Path Algorithm, which evaluates the arcs of the hydraulic design graph that represent the feasible combinations of diameters and invert elevations and selects the path of arcs with the lowest cost. This corresponds to the minimum cost design.
The Bellman-Ford algorithm finds the shortest path between a source node and all other nodes in the graph. It is a label-correcting algorithm, which means that it modifies the cumulative cost of nodes as the algorithm progresses. This algorithm starts by setting the cumulative cost at the source node to zero and at all other nodes to infinity. Subsequently, the algorithm evaluates all outgoing arcs from each node as follows: if the cumulative cost of
is greater than the sum of the cumulative cost at
and the cost of the arc between
and
, then
is set to the value of
. After repeating this process with all the outgoing arcs from each node in the graph, the path of arcs that represent the lowest cost design is obtained.
Using a Shortest Path Algorithm to find the optimal design is very valuable considering the size of the problem solution space. Taking into account that the spatial location of the manholes and the outfall is given, if each pipe is considered to have D possible diameters and S possible slopes, the number of alternatives for designing a series of pipes is expressed in EquationEquation (1)(1)
(1) , where n is the number of pipes in the series. Following this equation, if, for example, there are 10 diameters, 10 slopes in a series of 10 pipes, the possible alternatives would be
.
2.2. Methodology adapted for flat terrains
In flat terrains, sewer system designs tend to require important excavation depths, which increases its construction cost. As a result, with this type of topography, it is critical to include pumping stations to raise the water level so it can flow by gravity without requiring excessive excavation depths.
Pumping stations have a single inlet from which water is collected and transferred to a pump. The pump raises the water to an outlet that is at a higher level than the inlet. The water discharged from the station is then routed to a downstream manhole. depicts a pump station with the above-mentioned components.
Figure 2. Structure of a pumping station.
To include pumping stations in the methodology for the optimal design of series of pipes, the present work proposes the addition of a new type of arc in the directed graph of the hydraulic design model. This new type of arc has a vertical direction and connects two nodes located in the same manhole. This means that any manhole of the series could be a pumping station if the Shortest Path Algorithm decides so. Also, for the type of arcs that represent the pumping stations, the upstream node must have a deeper invert elevation than the downstream node to represent the pumping of water. In this way, the length of the arc represents the pumping head.
By incorporating arcs that represent the pumping stations into the directed graph of the hydraulic design, the Shortest Path Algorithm includes these new arcs into its path selection process. Consequently, the algorithm considers the potential inclusion of pumping stations in the sewer design, leading to an increase in the number of arcs evaluated compared to the methodology that do not include pumping stations.
If we consider the possibility that each manhole can be as either a pumping station or not, the original solution space EquationEquation (1)(1)
(1) would multiply by
, where
represents the number of manholes in the series. In addition, each pumping station has multiple possible pumping heights that depends on the elevation at which the inlet pipe enters the pump, further increasing the solution space.
In order to reduce the requirement for computational resources, the arcs that model the pumping stations were created every 0.2 m in the invert elevation. This way the algorithm will not have to exhaustively evaluate all the possible pumping heads that could exist in each manhole but will instead evaluate the pumping heads every 0.2 m, which is considered an adequate precision for construction while also reducing the number of arcs that the algorithm must evaluate.
presents an example of how pumping stations are modelled in a manhole. In the figure, the inner rectangles represent the possible invert elevations. The difference between each elevation is equal to 0.2 m, as mentioned above. Note that the number of possible elevations depends on the minimum and maximum head allowed for pumping stations. The circles represent the nodes; in this case, only one diameter is illustrated to simplify the figure, but in the model, there could be as many diameters as desired. Finally, the arrows represent the possible pumping heads.
Figure 3. Example of arcs that represent pumping stations in a manhole with its respective invert elevations.
To summarize, with the proposed methodology, the hydraulic design problem is modelled as a directed graph composed of nodes and two types of arcs. The first type of arcs represents pipes, while the second type represents pumping stations. Each arch has an assigned weight that corresponds to the cost of the structure it represents. The Shortest Path Algorithm evaluates all the combinations of arcs and selects the path of arcs with the lowest cost, which is the solution of the hydraulic design. This solution includes information of the pipe diameters, upstream and downstream invert elevations of the pipe, the number and location of pumping stations, and the head and flow rate of the water being pumped by the stations.
To illustrate the described methodology, presents an example of the arcs selected by the Shortest Path Algorithm in a series of pipes. As in , the circles in the manholes represent the nodes with its respective diameters and invert elevations, the black circles are the selected nodes, and the black arrows indicate the path generated by the optimal combination of diameters and elevation of the pipes. Additionally, manhole 2 represents a pumping station with its respective vertical arc that illustrates the pumping head.
Figure 4. Example of the optimal path in a series of pipes with pumping stations.
It is important to note that, as the arcs that represent the pumping stations are different from the arcs that represent pipes, the costs associated with these two types of arcs are different. While the cost of the original arcs depends on the diameter and average excavation depth of the pipe, the cost of the new arcs represents the cost of installing a pumping station, which involves the construction and operational costs.
To calculate the construction cost of pumping stations, EquationEquation (2)(2)
(2) was used, which is the one presented by Cabral et al. (Citation2018) multiplied by 1000 €/k€ and 1.1 USD/€ to convert cost units from k€ to USD. In the equation,
represents the building cost [USD], and
represents the power [kW].
EquationEquation (3)(3)
(3) is proposed for the operational cost of pumping stations, where
is the operational cost [USD],
is the pump efficiency [-],
is the energy cost [USD/kW*h],
is the time of operation [h],
is the fraction of the day that the pump is in operation [-], and
is the power [kW].
The values used for parameters ,
,
, and
are 0.8, 15.3 USD$/kW*h 35,040 h, and 0.8, respectively.
Regarding the cost of the pipes, the cost function proposed by Maurer, Wolfram, and Anja (Citation2010) shown in EquationEquation (4)(4)
(4) was used, where
is the cost of the pipe [USD],
is the diameter of the pipe [m],
is the average excavation depth of the pipe [m],
is the length of the pipe [m], and
,
,
, and
are constants equal to 110 USD/m3, 1200 USD/m2, 127 USD/m2, and −35 USD/m, respectively.
The cost functions do not affect the methodology, that is, any cost function that represent the cost of pipes, and pumping stations could be used.
The methodology was tested in series of 10 and 20 pipes varying the material, the inflow per manhole and the length of pipes. Each variable was held constant in each series, i.e. in a series, all pipes were the same length and material, and each manhole had the same inflow. This was done to evaluate the impact of changes in these variables on the system’s cost and pumping requirements. In the 10-pipe series, three materials, four lengths, and ten inflows were tested; while in the 20-pipe series, three materials, four lengths, and one inflow were tested. Taking everything into account, a total of 120 designs of 10-pipe series and 12 designs of 20-pipe series were completed.
The materials used are: smooth material that produces hydraulically smooth turbulent flow (roughness is null), rough material (roughness = m), and very rough material (roughness =
m). The lengths of pipes that we used are: 50, 100, 150, and 200 [m]. Finally, the inflows we used in the 10-pipe series are: 0.01, 0.02, 0.035, 0.05, 0.07, 0.1, 0.15, 0.2, 0.25, 0.3 [m3/s]. In the 20-pipe series, only an inflow of 0.2 m3/s was used.
Additionally, the ground elevation is the same throughout the series to represent a flat terrain, except for the two manholes closest to the outfall. The later have an additional 2 metres of elevation, which simulates a high-water level at the final pipe which could be a wastewater treatment plant or a receiving water body.
Furthermore, to test the proposed methodology in a real-world context, a series of pipes that is part of the real sewer system in Bogotá, Colombia, was designed with the three materials mentioned. The series is part of the sewer network Chicó that was first used as a case study by Duque et al. (Citation2020). It is composed of 28 pipes of different lengths. To simulate the increment in population, the original inflows of the series were duplicated, achieving a total flow rate of 0.754 m3/s. Additionally, to promote the requirement of pumps, the ground elevation of the last manhole and the outfall were raised 4 meters. An illustration of the series, as well as the lengths of pipes and inflows per manhole, can be found in the supplementary material.
To guarantee an adequate operation of the series of pipes, hydraulic constraints must be complied. presents the constraints used for the pipes, which are proposed by Li and Matthew (Citation1990).
Table 1. Hydraulic constraints for pipes.
As for the pumping constraints, the minimum and maximum pumping head was 2.5 m and 15 m, and the invert elevation increment was 0.2 m. Regarding the excavation constraints, the minimum depth allowed was 1.2 m, and the maximum depth allowed was 5 m for the 10-pipe series, 6 m for the 20-pipe series, and 5.8 m for the series of Bogotá. These excavation constraints are evaluated in the downstream end of each pipe. In addition, the list of diameters used was the following: {0.2, 0.25, 0.3, 0.35, 0.38, 0.4, 0.45, 0.5, 0.53, 0.6, 0.7, 0.8, 0.9, 1.0, 1.05,1.20, 1.35, 1.4, 1.5, 1.6, 1.8, 2.0,2.2, 2.4} [m].
3. Results and discussion
3.1. Results of the 10-pipe series
summarizes the results achieved for the 10-pipe series. The figure is divided into four graphs, each representing the costs obtained with the different pipe lengths. Note that the materials are represented by their initials in the legend of the figures: S for smooth, R for rough, and VR for very rough.
Figure 5. Total cost of the 10-pipe series.
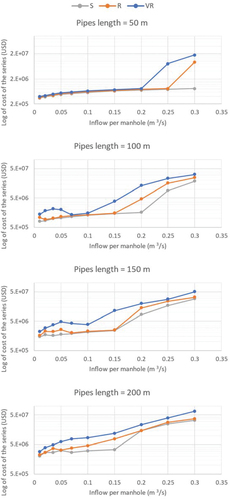
Longer lengths and higher roughness in pipes imply higher energy losses, resulting in the need for larger diameters or more pumping (more pumping head or more pumping stations) to comply with hydraulic and commercial constraints. Consequently, the costs of the series are greater when the length or roughness increases, as shown in . This figure also shows that the cost of the series increases as the inflow per manhole does, which is probably due to the requirement of greater diameters in pipes and the increase in the pumping flow rate.
Considering that the cost of pumping stations corresponds between 20% and 95% of the total cost of the series in the results obtained, it is relevant to analyse the pumping in the designs. To this end, illustrates the number of pumping stations in the designs. Recall that the pipe materials are represented as: S for smooth, R for rough, and VR for very rough.
Figure 6. Number of pumps in the 10-pipe series.
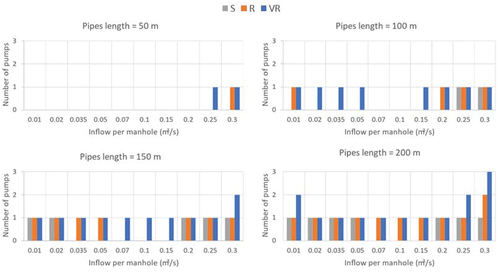
shows that the requirement for pumps increases with pipe length and roughness. As mentioned in , the increment in pipe length and roughness is related to higher costs. The above implies that the increase in the cost of the series is due to the need for pumping stations in the design. On the other hand, demonstrates that the number of pumps in the designs is not very sensitive to the inflow per manhole.
To continue with the analysis of pumping in the design, was done. This figure depicts both the power and the flow rate of the pumping stations. Note that the columns with diagonal stripes correspond to the power of the pump in kW, and this information should be interpreted with the left axis. Also, the columns filled with a solid colour correspond to the pumping flow rate in m3/s, which should be interpretated with the right axis. In cases where there is more than one pump in the design, the power and pumping flow rate correspond to the sum of these parameters in the pumps of the design.
Figure 7. Pumping power and flow rate in the 10-pipe series.
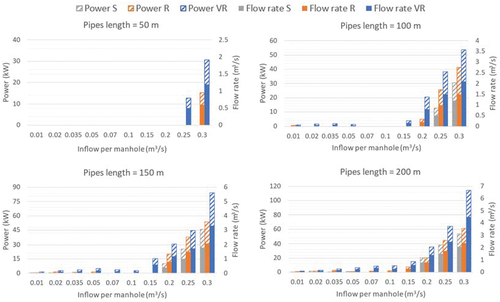
shows a positive correlation between pumping rate and power as expected, since the pumping rate is calculated with EquationEquation (5)(5)
(5) , where P is the power in kW; Q the pumping flow rate in m3/s;
and
are constants and equal to 1000 kg/m3, and 9.81 m/s2, respectively; and h is the pumping head in m, which in 97% of the pumps obtained was equal to 2.6 m, that corresponds to the minimum pumping allowed, according to the minimum pumping head (2.5 m) and the invert elevation increment (0.2 m).
also indicates that although there are pumping stations with low inflows per manhole, the power and pumping flow rate of these are very low; therefore, they do not significantly increase the total cost of the series. On the other hand, with larger inflows per manhole, more power is required, which increases the cost of these series, as shown in .
The above suggests that what increases the most the total cost in series with pumping is not the number of pumps but rather their power requirement. For this reason, the optimal designs obtained do not place the pumping at the end of the series, as is normally done in practise, but place it upstream in order to reduce the pumping flow rate, thereby reducing both the power consumption and the total cost of the series.
3.2. Results of the 20-pipe series
To test the methodology in longer series, 20-pipe series were designed varying their pipe length and material. The inflow per manhole was fixed at 0.2 m3/s in order not to have a very large number of designs. However, any inflow can be used in the methodology.
Additionally, when performing the designs, it was observed that in some cases, there was no feasible designs that met all the constraints for these series. Therefore, it was decided to relax the maximum excavation depth constraint, allowing excavations of up to 6 m in the 20-pipe designs.
The results of the 20-pipe series are summarized in . This figure illustrates the total cost of the series, the number of pumping stations per series, the power and pumping flow rate in the pumping stations, and the pumping head.
Figure 8. Results of the 20-pipe series designs.
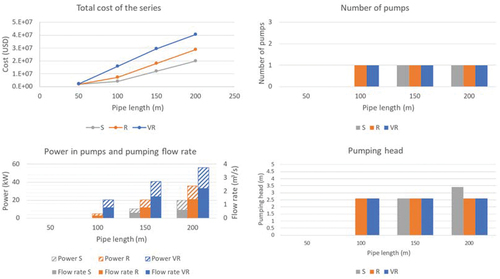
shows that the cost of the 20-pipe series, like the 10-pipe series, increases as the length and roughness of the pipes increase. Furthermore, the longer and rougher the series, the more likely they are to require pumping stations, though in this case, no design required more than one pumping station due to the relaxation of the maximum excavation depth constraint. The aforementioned implies that the cost of increasing excavation depth is less than the cost of adding a pumping station.
In terms of pumping characteristics, illustrates the correlation between the power and pumping flow rate, as shown in the 10-pipe series. In addition, shows that as the power and pumping flow rate increases, so does the cost of this series, but this is not the case between pumping head and the cost of the series. This is also supported by the correlation coefficients between these variables, which are 0.99 between power and cost, and 0.72 between pumping head and cost. Recall that a correlation coefficient closer to 1 means a higher linear correlation between the two variables.
Finally, to illustrate the results achieved in the series with 10 and 20 pipes, shows the designs obtained in the series with 100 m of pipe length and 0.2 m3/s of inflow per manhole. The figure illustrates the ground elevation; the upper and lower limits, according to the hydraulic constraints; and the invert and crown elevations of the pipes. Note that the difference between the invert and crown elevation corresponds to the diameter of the pipe. Additionally, pumping stations are represented as a vertical line in the series of pipes.
Figure 9. Designs of the series with the three materials, inflow per manhole of 0.2 m3/s, and pipe length of 100 m.
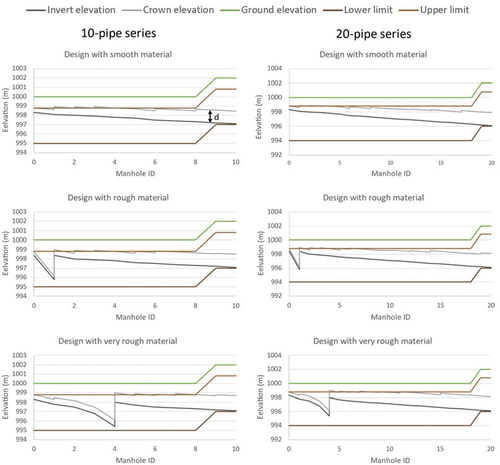
shows that the Shortest Path Algorithm places pumping stations further downstream as the material becomes rougher. If the pumping station is located further upstream in rough material, it is likely that another pumping station will be required to respect the lower limit allowed in the excavation depth. The above is due to the larger diameters or excavation depths that are required to comply with the hydraulic constraints in high roughness.
3.3. Results of the series in the real sewer system of Bogotá
Three designs were executed for the series of the real sewer system of Bogotá, each with one of the three materials used in this study. presents the cost, the pumping features, the maximum diameter, and the maximum excavation depth of each design. Additionally, the complete designs can be found in the supplementary material.
Table 2. Results of the designs of the series of Bogotá.
The results in show that the same trends seen in the 10 and 20 pipe series can be observed in a real-world context. For example, as pipe roughness increases, so does the number of pumps and pumping head, resulting in an increment in the total cost of the system.
4. Conclusions
The present work introduces a methodology for the design of sewer series with on-line pumping stations that ensures optimal design. The methodology includes the optimal decision of diameters and upstream and downstream excavation depth of pipes, as well as the optimal location, pumping head, and number of pumping stations. The methodology was tested in series of 10 and 20 pipes.
Furthermore, a sensitivity analysis was conducted to study the effect of hydraulic characteristics in the pumping features and the overall cost of the series. This involved varying the pipe material, pipe length, and inflow per manhole (the last parameter was only varied in the series of 10 pipes).
Based on the findings, the following conclusions were reached:
The pumping stations represent a significant portion of the total cost of the series (between 20% and 95%, according to the designs obtained in this work). For this reason, decisions about the location or number of pumps that should be installed have a significant impact on the cost of the series.
Among the pumping variables, the power, and therefore the pumping flow rate, have the greatest impact on the series’ overall cost. These variables have a higher correlation with the total cost of the series than the number of required pumping stations and the pumping head.
The Shortest Path Algorithm locates pump stations as far upstream as possible, trying to minimize the pumping flow rate because it has the greatest impact on the cost of the series.
Fewer pumping stations are needed when the maximum excavation depth constraint is relaxed, suggesting that when excavation is not excessive, it is preferable to allow more excavation than to add a pump station.
The proposed methodology allowed designing series of sewer pipes with on-line pumping stations, finding the minimum cost designs that comply with all the constraints that allow an adequate operation. The methodology worked satisfactorily for both the series of 10 and 20 pipes.
A great contribution of the methodology presented in this work is that the Shortest Path Algorithm guarantees optimality, which means that it provides the minimum cost design with pumping stations. The methodology was used in the study to design several theoretical series and one series of a real sewer system. From these designs it was possible to better understand the relationship between the pumping characteristics of a series, including cost, and factors such as inflow, pipe roughness and pipe length.
Because it has only been implemented in series so far, the current work is a first step in the development of a methodology for the optimal design of sewer networks with pumping stations. To apply the methodology to a full sewer network, a more complex graph model is required. This would be the second stage of the research, which is currently being developed.
Supplemental Material
Download MS Word (7.7 MB)Acknowledgements
The authors would like to thank Juan Ignacio Arbelaez and the students at Universidad de los Andes whose undergraduate work contributed to the development of this paper.
Disclosure statement
No potential conflict of interest was reported by the author(s).
Data availability statement
The data that support the findings of this study are openly available in 4TU.ResearchData at http://doi.org/10.4121/0a9b5a46-7b26-4e28-82f4-47b6330a042f.
Supplementary material
Supplemental data for this article can be accessed https://doi.org/10.1080/1573062X.2024.2329086
References
- Afshar, M. H. 2010. “A Parameter Free Continuous Ant Colony Optimization Algorithm for the Optimal Design of Storm Sewer Networks: Constrained and Unconstrained Approach.” Advances in Engineering Software 41 (2): 188–195. https://doi.org/10.1016/j.advengsoft.2009.09.009.
- Afshar, M. H. 2012. “Rebirthing Genetic Algorithm for Storm Sewer Network Design.” Scientia Iranica 19 (1): 11–19. https://doi.org/10.1016/j.scient.2011.12.005.
- Afshar, Mohammad, Abdollah Afshar, Miguel A Mariño, and A. Sadat. 2006. “Hydrograph-Based Storm Sewer Design Optimization by Genetic Algorithm.” Canadian Journal of Civil Engineering 33 (3): 319–325. https://doi.org/10.1139/l05-121.
- Afshar, M. H., M. M. Zaheri, and J. H. Kim. 2016. “Improving the Efficiency of Cellular Automata for Sewer Network Design Optimization Problems Using Adaptive Refinement.” Procedia Engineering 154:1439–1447. https://doi.org/10.1016/j.proeng.2016.07.517.
- Ahmadi, Azadeh, Mohammad Amin Zolfagharipoor, and Mohsen Nafisi. 2018, 8. “Development of a Hybrid Algorithm for the Optimal Design of Sewer Networks.” Journal of Water Resources Planning and Management 144 (8). https://doi.org/10.1061/(asce)wr.1943-5452.0000942.
- Alfaisal, Faisal M., and Larry W. Mays. 2021. “Optimization Models for Layout and Pipe Design for Storm Sewer Systems.” Water Resources Management 35 (14): 4841–4854. https://doi.org/10.1007/s11269-021-02958-5.
- Atiyah, Ruqayya H, and Waqed H Hassan. 2021. “Optimum Design of Sewer Networks with Pump Station Using Genetic Algorithms.” Journal of Physics Conference Series 1973 (1): 012187–87. https://doi.org/10.1088/1742-6596/1973/1/012187.
- Cabral, M., D. Loureiro, M. Gomes, R. Oliveira, and D. Covas 2018. “Statistical Modelling of Wastewater Pumping Stations Costs”. In 1st International WDSA/CCWI 2018 Joint Conference, Kingston (Canada).
- Cozzolino, Luca, Luigi Cimorelli, Carmine Covelli, Carmela Mucherino, and Domenico Pianese. 2015. “An Innovative Approach for Drainage Network Sizing.” Water 7 (12): 546–567. https://doi.org/10.3390/w7020546.
- Duque, Natalia, Daniel Duque, Andrés Aguilar, and Juan Saldarriaga. 2020. “Sewer Network Layout Selection and Hydraulic Design Using a Mathematical Optimization Framework.” Water 12 (12): 3337. https://doi.org/10.3390/w12123337.
- Duque, Natalia, Daniel Duque, and Juan Saldarriaga. 2016. “A New Methodology for the Optimal Design of Series of Pipes in Sewer Systems.” Journal of Hydroinformatics 18 (5): 757–772. https://doi.org/10.2166/hydro.2016.105.
- Haghighi, Ali, and Amin E. Bakhshipour. 2012. “Optimization of Sewer Networks Using an Adaptive Genetic Algorithm.” Water Resources Management 26 (12): 3441–3456. https://doi.org/10.1007/s11269-012-0084-3.
- Haghighi, Ali, and Amin E Bakhshipour. 2015. “Deterministic Integrated Optimization Model for Sewage Collection Networks Using Tabu Search.” Journal of Water Resources Planning and Management 141 (1): 4014045. https://doi.org/10.1061/(ASCE)WR.1943-5452.0000435.
- Hassan, Waqed H., Musa H. Jassem, and Safaa S. Mohammed. 2017. “A GA-HP Model for the Optimal Design of Sewer Networks.” Water Resources Management 32 (3): 865–879. https://doi.org/10.1007/s11269-017-1843-y.
- Ibrahim, E. H., Sadiki Mohamed, and Ahmed Atwan. 2011. “Combining Fuzzy Analytic Hierarchy Process and GIS to Select the Best Location for a Wastewater Lift Station in El-Mahalla El-Kubra, North Egypt.” International Journal of Engineering Science and Technology 11 (5): 37–43.
- Li, Guiyi, and Robert G. S. Matthew. 1990. “New Approach for Optimization of Urban Drainage Systems.” Journal of Environmental Engineering 116 (5): 927–944. https://doi.org/10.1061/(ASCE)0733-9372(1990)116:5(927).
- Maurer, Max, Martin Wolfram, and Herlyn Anja. 2010. “Factors Affecting Economies of Scale in Combined Sewer Systems.” Water Science and Technology 62 (1): 36–41. https://doi.org/10.2166/wst.2010.241.
- Moeini, R., and M. H. Afshar. 2012. “Layout and Size Optimization of Sanitary Sewer Network Using Intelligent Ants.” Advances in Engineering Software 51:49–62. https://doi.org/10.1016/j.advengsoft.2012.05.003.
- Moeini, R., and M. H. Afshar. 2017. “Arc Based Ant Colony Optimization Algorithm for Optimal Design of Gravitational Sewer Networks.” Ain Shams Engineering Journal 8 (2): 207–223. https://doi.org/10.1016/j.asej.2016.03.003.
- Palumbo, Anna, Luigi Cimorelli, Carmine Covelli, Luca Cozzolino, Carmela Mucherino, and Domenico Pianese. 2013. “Optimal Design of Urban Drainage Networks.” Civil Engineering and Environmental Systems 31 (1): 79–96. https://doi.org/10.1080/10286608.2013.820277.
- Pan, Tze-Chin, and Jehng-Jung Kao. 2009. “GA-QP Model to Optimize Sewer System Design.” Journal of Environmental Engineering 135 (1): 17–24. https://doi.org/10.1061/(ASCE)0733-9372(2009)135:1(17).
- Safavi, Hamidreza, and Mohammad A. Geranmehr. 2016. “Optimization of Sewer Networks Using the Mixed-Integer Linear Programming.” Urban Water Journal 14 (5): 452–459. https://doi.org/10.1080/1573062x.2016.1176222.
- Steele, Joshua C, Kurt Mahoney, Omer Karovic, and Larry W Mays. 2016. “Heuristic Optimization Model for the Optimal Layout and Pipe Design of Sewer Systems.” Water Resources Management 30 (5): 1605–1620. https://doi.org/10.1007/s11269-015-1191-8.
- Swamee, Prabhata K. 2001. “Design of Sewer Line.” Journal of Environmental Engineering 127 (9): 776–781. https://doi.org/10.1061/(ASCE)0733-9372(2001)127:9(776).
- Swamee, Prabhata K., and Ashok K. Sharma. 2013. “Optimal Design of a Sewer Line Using Linear Programming.” Applied Mathematical Modelling 37 (6): 4430–4439. https://doi.org/10.1016/j.apm.2012.09.041.
- United Nations. 2022. The Sustainable Development Goals Report 2022. United Nations. https://unstats.un.org/sdgs/report/2022/The-Sustainable-Development-Goals-Report-2022.pdf.
- Wilcoxson, David, and Travis Crane. September 2013. “Optimization of Wastewater Lift Stations for Reduction of Energy Usage and Greenhouse Gas Emissions.” Water Intelligence Online 12. https://doi.org/10.2166/9781780405070.
- Yeh, S. F., Y. J. Chang, and M. D. Lin 2013. Optimal Design of Sewer Network by Tabu Search and Simulated Annealing. In 2013 IEEE International Conference on Industrial Engineering and Engineering Management, Agdal, Morocco, 1636–1640. IEEE.
- Zaheri, M. M., R. Ghanbari, and M. H. Afshar. 2019. “A Two-Phase Simulation–Optimization Cellular Automata Method for Sewer Network Design Optimization.” Engineering Optimization 52 (4): 620–636. https://doi.org/10.1080/0305215x.2019.1598983.
- Zeferino, João A., António P. Antunes, and Maria C. Cunha. 2009. “An Efficient Simulated Annealing Algorithm for Regional Wastewater System Planning.” Computer-Aided Civil and Infrastructure Engineering 24 (5): 359–370. https://doi.org/10.1111/j.1467-8667.2009.00594.x.