
 ?Mathematical formulae have been encoded as MathML and are displayed in this HTML version using MathJax in order to improve their display. Uncheck the box to turn MathJax off. This feature requires Javascript. Click on a formula to zoom.
Abstract
This paper deals with the time series analysis of precipitation patterns in Africa’s most populated nation using recently developed flexible modelling techniques to study the monthly precipitation data of some major economically viable and highly populated regions in Nigeria. The results indicate that there is a significant trend for Lagos rainfall data, implying that precipitations have systematically increased over time in this city. Additionally, the seasonal component is more prominent in the cases of Kano and Kaunda than for Ibadan and Lagos. The findings of this study have relevant policy implications for forecasting, agricultural planning, relating precipitation variability in Nigeria with standard climate drivers, as well as for disaster or risk reduction in the context of climate change, global warming and migration in the post-pandemic era.
Keywords:
1. Introduction
Precipitation modeling and analysis is highly useful for prediction and forecasting purposes especially in agriculture, hydrology, migration, weather derivatives, risk mitigation, flood protection and disaster preparedness. Many authors have written extensively on rainfall dynamics in sub-Saharan Africa and beyond using various time series methods. Examples include works by Gil-Alana (Citation2012), Yusof et al. (Citation2013), Yuan et al. (Citation2014) and others such as Nicholson et al. (Citation2000), Ogungbenro and Morakinyo (Citation2014), Yaya and Fashae (Citation2015), Mohammed et al. (Citation2015), Gil-Alana and Sauci (Citation2019) and Awe et al. (Citation2020). However, due to differences in geomorphology and climatic patterns, trends of rainfall pattern may differ across different regions of the world (Tan et al., Citation2017). Our study of rainfall dynamics is quite important because it is evident that agriculture forms the backbone of most of the countries in the world, and in Nigeria, agriculture is the second largest contributor to its economy, after oil (Awe et al., Citation2018). Therefore, rainfall (precipitation) is one of the most important factors to be considered while planning agricultural and commercial activities. Further, precipitation patterns are studied to gather information and prepare a database pertaining to different regions which makes econometric prediction of rainfall easier. Studying and predicting rainfall patterns for different parts of the world help farmers and the government to plan accordingly. Regional studies on rainfall are usually carried out to mitigate possible disasters. The regions considered in this study form part of the major commercial (highly populated) economic centers in Africa. Amount, distribution and intensity of rainfall dictate crop productivity in the villages and it affects the economy of the entire region or state because rainfall patterns are mostly homogenous in nearly all villages and cities in Nigeria. This implies that rainfall patterns are homogenous within each region or state of Nigeria such that results obtained from investigating one area in the region can be used as information for the entire region (Ishaku and Majid, Citation2010).
The main objective of this work is to investigate the dynamics and time trends present in Nigerian precipitation data using a recently developed econometric time series methodology, which has been given little consideration by previous studies and which provides reliable information about regional climate change as well as how it affects matters of critical importance such as water availability, agricultural productivity and adaptation. A proper study of the processes involved in seasonal precipitation dynamics is essential to provide reliable information about climate change and how it can affect matters of critical importance such as agricultural productivity, food security and adaptation (Awe et al., Citation2020). As it is in most developing countries, climate change modeling and its effects on life sustenance has not been given full attention in Nigeria, hence the present study. We are interested in testing the long memory properties and corresponding degrees of persistence in rainfall in order to make adequate recommendations for the population in these regions. Long memory is a feature that is present in the majority of the geophysical and climatological time series (see, e.g., Percival et al., Citation2001; Gil-Alana, Citation2005, Citation2008, Citation2017; Ercan et al., Citation2013; Bunde, Citation2017; Royston et al., Citation2018; Yuan et al., Citation2019; Gil-Alana and Sauci, Citation2019; etc.) and thus, we also should expect this pattern in rainfall data. In this respect, it can be taken as an alternative modelling approach to other more classical models based on Markov chains, censored AR(1) and other models (e.g, Hannachi, Citation2014). The general contributions of this work is to investigate if time trends are present in the precipitation data using updated methods based on long memory or long range dependence, which previous studies did not consider.
The rest of the paper is structured as follows: Section 2 is mainly devoted to the data and study area description. Section 3 is on the methodology used. Section 4 displays the empirical analyses and results, while Section 5 concludes the paper.
2. Data and study area
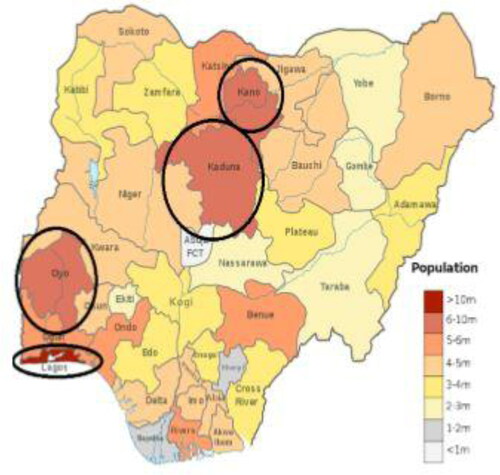
Data for this study was collected at Ikeja in Lagos State, Ibadan in Oyo State, Kano in Kano State and Kaduna in Kaduna State. These regions were selected as being representative of geographical zones with areas of homogeneous climatic behaviour. Precipitation in Nigeria is a product of several phenomena, these include maritime tropical air mass which is moisture laden and blows across the Atlantic Ocean over to Nigeria which leads to high precipitation along the coastal areas of Lagos and in extension Oyo State, Rivers, and Cross Rivers States in Nigeria. Nigeria also experiences the equatorial air mass and the continental tropical air mass which carries little moisture along its path and thus becomes dry upon arrival to Nigeria in the northern part of Kano and Kaduna States. These phenomena contribute largely to variation in precipitation dynamics across the study areas. shows the map of Nigeria with the locations of the study areas.
Fig. 1. Map of Nigeria. Source: pinterest.com.
3. Materials and methods
Monthly time series precipitation data (168 observations each) obtained for twelve years (1992–2014) from four meteorological stations (Lagos, Ibadan, Kaduna and Kano) of the Nigerian Meteorological Agency (NIMET) were used to explain the rainfall trend and dynamics in this study. The data collected ended at 2014 because of the difficulty in obtaining up-to-date data in Nigeria. With respect to the methodology, we use a long memory approach that is based on fractional integration or I(d) models, which have been widely used in the analysis of climatological and hydrological data. Long memory is a feature in time series that indicates a large degree of dependence between observations which are far distant in time. More rigorously speaking, a process displays the property of long memory if its spectral density function (which is the discrete Fourier transform of the autocovariance function) is unbounded at a given frequency in the interval [0, π); an alternative definition of long memory, this time in the time domain, says that a process is long memory if the infinite sum of the autocovariances is infinite. Within this group of long memory, there are a variety of models, and one very popular in the climatological literature is the one based on fractional integration.
A process {xt, t = 0, ±1, …,} is integrated of order d, and denoted by I(d) if it can be represented as:
(1)
(1)
where B is the backshift operator (i.e. Bxt = xt−1), d is any real number, ut is an I(0) process, defined as a covariance (or second order) stationary process with a spectral density function that is positive and bounded at all frequencies in the spectrum (or alternatively, in the time domain, if the infinite sum of autocovariances is finite). This includes the white noise case but also other more elaborated models like those based on the stationary ARMA-form.
Note that by allowing d to be any real value, it can also be fractional and it also covers the standard cases of unit roots I(1) and stationarity I(0) as particular cases of interest if the differencing parameters are equal to 1 and 0 respectively. We can make use of the Binomial expansion
(2)
(2)
and noting that
the infinite sum in the right-hand-side of expression (Equation2
(2)
(2) ) can be written as
such that EquationEq. (1)
(1)
(1) can be expressed as:
(3)
(3)
In this context, d plays a crucial role, because it is an indicator of the degree of dependence of the data, in the sense that the higher the value of d, the higher the level of association will be between the observations. Processes with d > 0 in (Equation1(1)
(1) ) display the property of “long memory”, characterised because the autocorrelations decay hyperbolically slowly and the spectral density function is unbounded at the origin. These processes, originally proposed by Granger (Citation1980, Citation1981), Granger and Joyeux (Citation1980) and Hosking (Citation1981) have been widely used in recent years in the analysis of climatological and meteorological time series data (Lennartz and Bunde, Citation2009; Yuan et al., Citation2014; Massah and Kantz, Citation2016; Gil-Alana and Sauci, Citation2019; Gil-Alana et al., Citation2019; etc.)
The estimation of d is calculated based on the Whittle function, which is an approximation to the likelihood function, and expressed in the frequency domain as in Dahlhaus (Citation1989). We also employ a testing procedure developed by Robinson that is the most efficient one (in the Pitman sense) under local departures from the null, the functional form of which can be found in the Appendix. A FORTRAN code for the implementation of this method is available from the authors upon reasonable request.Footnote1
4. Results and discussions
displays plots of the four time series. A clear seasonal pattern is evident in all cases, and based on the monthly nature of the data, the estimated model is the following:
(4)
(4)
along with a seasonal (monthly) AR(1) structure for the error term:
(5)
(5)
where yt refers to each of the observed time series, α and β are the unknown coefficients corresponding to an intercept and a linear time trend respectively; and xt is integrated of order d (or I(d)) such that the I(0) errors ut follow a seasonal (monthly) AR(1) process, with εt as a white noise process.
Fig. 2. Rainfall data (mm) and estimated trends.
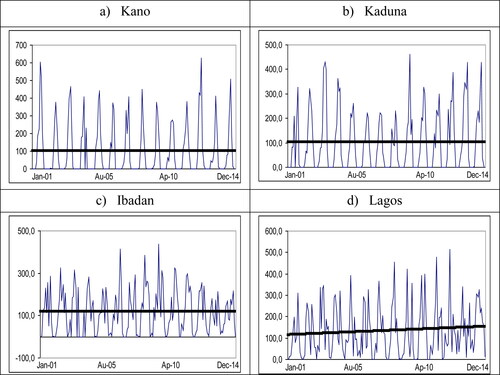
Our results indicate that long memory takes places in the cases of two of the cities (Kano and Kaduna) but not for the cases of Ibadan and Lagos. In addition, the time trend is only found to be statistically significantly positive in the case of Lagos. reports the estimates of d for the three cases of no regressors, an intercept, and an intercept with a linear time trend, and we have marked in bold in the table the most significant model according to the deterministic terms. The choice of the correct model here is based on the t-values of the estimated coefficients in (Equation1(1)
(1) ) noting that the two equations in (Equation1
(1)
(1) ) can be expressed in a single one as:
(5)
(5)
where
and
Then, since ut in (Equation5
(5)
(5) ) is I(0) by assumption, standard LS estimates of α and β hold and t-values apply.
Table 1. Estimates of d (and 95% bands) in the model given by EquationEq. (1)(1)
(1) .
It is observed that the time trend is found to be statistically insignificantly different from zero in three out of the four cities examined, the intercept being sufficient to describe the deterministic terms in the cases of Ibadan, Kano and Kaduna. However, for Lagos, the time trend is significantly positive (see the coefficient in ). Nevertheless, this significant coefficient should be taken with caution given that the sample size only contains fourteen years of data and thus, the observed linear time can be caused by natural interdecadal variation in rainfall. Focusing on the estimated values of d, we observe a different pattern for Kano and Kaduna, where long memory is present, since the estimated value of d is significantly positive, compared with Ibadan and Lagos, where the I(0) null hypothesis (short memory, d = 0) cannot be rejected. displays the estimated coefficients for the selected model in each city. There is an indication of northward reduction in rainfall as supported by previous studies (Oguntunde et al., Citation2011, Ogungbenro and Morakinyo, Citation2014). We also observe in that there is a significant trend for the Lagos rainfall data, implying that the precipitations have systematically increased across the years in this city. This result is useful for agricultural productivity and adaptation in the studied region as explained in the following section. Additionally, the seasonal component is more important in the cases of Kano and Kaduna than for Ibadan and Lagos where the values for this term are slightly smaller. also displays the estimated deterministic terms, noticing that only for Lagos do we observe a significant positive trend.
Table 2. Estimated coefficients for the selected models in .
4.1. Implications for agricultural productivity and adaptation
As stated in this study, precipitation, especially rain, has an extensive effect on agriculture because plants need varying amounts of water to survive, therefore a moderate amount of rainfall is important for agricultural productivity (Ndamani and Watanabe, Citation2014). Thus, when rainfall patterns change, the effect will be felt directly on cropping patterns and their subsequent adaptation. Previous dry seasons can lead to food shortages in the wet seasons, as the crops await maturity. Essentially, rainfall has an enormous influence on crop production which is important for human survival. Grain production of a country depends largely on timely rainfall during crop growing seasons (Dumenu and Obeng, Citation2016). Decisions on time of sowing, scheduling of irrigation, as well as time of harvesting depends mainly on precipitation variability and dynamics. According to Onyeuwaoma et al. (Citation2018), the first wet season in Nigeria begins around March and lasts till the end of July with a peak in June. The work of Yu and Liu (Citation2015) discusses in detail how urbanization can affect precipitation and agriculture through several mechanisms. Throughout the African continent, regions that have been predominantly rural for most of their history have experienced a rapid and profound reorientation of their social and economic lives toward cities and urbanism. As a result of higher numbers of people moving to a number of rapidly expanding cities such as Lagos and Kano, agricultural activities and the quality of life in both urban and rural areas are changing drastically.
The precipitation patterns observed in the study areas present great potential for agricultural productivity, adaptation, planning and migration. Lagos, for instance, is the most populous city in Nigeria and on the African continent. It is one of the fastest growing cities in the world and a major financial center in Africa, with the busiest seaports in Africa (Fox et al., Citation2018). Lagos is located on latitude 6.5244°N and longitude 3.3792°E, and there is a significant precipitation difference between the wet season and the dry season. The wet season starts in April and ends in October, while the dry season starts in November and ends in March. The wettest month is June with total precipitation of 315.5 millimeters, while the driest month is January with 13.2 millimeters. Lagos is located near the equator and has only a slight seasonal temperature variation. Kaduna is the state capital of Kaduna State in north-western Nigeria, surrounded by River Kaduna and agricultural areas. Rapid urbanisation over the past decade has generated an increasingly large population in Kaduna, now estimated to be around 1.3 million. The latitude of Kaduna is 10.5105° N and its longitude is 7.4165°E, hence the climate is tropical. Compared with the winter period the summer period in Kaduna has much more rainfall. The city serves as a trading hub for cotton, peanuts (groundnuts), shea nuts, hides and skins. There is also a considerable local trade in sorghum, millet, corn (maize) and kola nuts. The agricultural sector remains the single largest employer of labour in this region because the majority of the people in the area depend on crop and livestock production for their household needs and incomes. Poor communities in Kano and Ibadan mainly depend on climate-sensitive activities such as agriculture for their livelihood and are particularly vulnerable to climate and precipitation changes (Ishaku and Majid, Citation2010). It has been reported that nearly three in four people living in Kano and Ibadan are dependent on agriculture in one way or another.
Rainfall variability affects the production of traditional crops in these regions and other parts of Africa (Nath and Behera, Citation2011). Ibadan lies on latitude 7.3775°N and longitude 3.9470°E. The precipitation varies on average 184 mm between the driest and the wettest months. The month with the highest rainfall in Ibadan is September when the rain usually falls for about 15 days and typically totals up to 170 mm (6.7") of precipitation. Throughout the year, there are about 94 rainfall days, and 1121 mm (44.1") of accumulated precipitation in this region (Agbola and Ojeleye, Citation2007). A lot of rain (rainy season) falls in April, May, June, July and September in Kano and it has dry periods in January, February and August. On average, September is the wettest month and January is the driest month (Ishaku and Majid, Citation2010). The latitude and longitude of Kano are 12.0022°N and 8.5920°E. The influence of climate drivers on rainfall variability varies with the season, time and periodicity in these regions. As depicted in , the annual average temperature in Lagos typically varies from 50 °F to 79 °F and is rarely below 44 °F or above 86 °F. The annual average temperature typically varies from 53 °F to 102 °F and is rarely below 48 °F or above 106 °F in Kano. Annual temperature typically varies from 55 °F to 95 °F and is rarely below 50 °F or above 102 °F in Kaduna. The annual temperature in Ibadan typically varies from 69 °F to 92 °F and is rarely below 63 °F or above 96 °F (Onyeuwaoma et al., Citation2018).
Table 3. Annual temperature, latitude and longitude of the studied regions.
Generally, our analysis of rainfall conditions suggests long-term change in rainfall patterns only in the region of Lagos in line with the work of Kyei-Mensah et al. (Citation2019). Changes in rainfall and other forms of precipitation will be one of the most critical factors determining the overall impact of climate change on humans in the coming years (Olesen et al., Citation2011). As revealed, one of the most important parameters of climate is rainfall. Just as there is a direct relationship between climate and agriculture, so is there one between rainfall and agricultural productivity in Nigeria (Olayide et al., Citation2016). Importantly, our results show that the orders of integration in the four series are statistically smaller than 1 (i.e., d < 1), implying that rainfall in the four regions is mean reverting, with the effect that the shocks disappearing relatively fast, especially for the regions of Ibadan and Lagos where short memory (d = 0) is found, contrary to the other two regions, Kano and Kaduna, where long memory (d > 0) is found, and thus, shocks may take longer time to disappear completely.Footnote2
5. Concluding remarks and recommendations
In this article we have examined the time series properties of the rainfall pattern in four major urban cities in Nigeria, namely, Lagos, Kano, Ibadan and Kaduna. For this purpose, we have used fractionally integrated (long memory) techniques to examine features such as persistence, time trends and seasonality. The results can be summarized as follows: There are some heterogeneous patterns in the results across the studied regions, and a positive linear time trend is only found in the case of Lagos. Dealing with the order of integration of the series, long memory or high persistence is found in the cases of Kano and Kaduna, while short memory or I(0) behaviour is detected in Lagos and Ibadan. Nevertheless, the four series display mean reverting patterns. Finally, seasonality exists for precipitation in the four regions, and this has special effects on the patterns of agricultural productivity and adaptation in the studied regions. We therefore recommend the following:
Since the agricultural system in Lagos and Ibadan is predominantly rain-fed, policy makers should institute policies that would reduce climate-induced agricultural risks by investing in climate smart agricultural practices (Olayide et al., Citation2016).
As a result of the predicted persistence and seasonality in precipitation patterns in the studied regions, policy makers should implement policies to support proper irrigation and erosion management which would be suitable for adaptation. High intensity rainfall can lead to floods and soil erosion, while limited rainfall can lead to famine and drought.
The government should support complimentary development of arable land areas in order to increase food production and diversify the economy, and dealing specifically with the issue of persistence:
Special attention should be paid by the authorities in case of negative shocks affecting areas in Kano and Kaduna since the shocks will last longer in these two regions. On the other hand,
More attention should be given to Ibadan and Lagos in case of positive shocks since the series will tend to return to their original levels by themselves, unless some measures are adopted.
The overall findings of this study can be utilized to relate precipitation variability with large-scale climate drivers and regulators relevant to the regions as well as to provide explicit information to policymakers regarding changes in future precipitation patterns in these regions in the post-pandemic era.
Acknowledgements
Comments from the Editor and two anonymous reviewers are gratefully acknowledged.
Additional information
Funding
Notes
1 A simpler version of the test based on white noise errors is also available in R and Gretl by the authors, and other software is also available on the web for the implementation of fractional integration methods.
2 Note that mean reversion occurs as long as d is smaller than 1, and the lower the value of d is, the faster is the process of convergence to the original level/trend.
References
- Agbola, T. and Ojeleye, D. 2007. Climate change and food crop production in Ibadan, Nigeria. In: 8th African Crop Science Society Conference, El-Minia, Egypt, 27–31 October 2007, pp. 1423–1433.
- Awe, O. O., Akinlana, D. M., Yaya, O. S. and Aromolaran, O. 2018. Time series analysis of the behaviour of import and export of agricultural and non-agricultural goods in West Africa: A case study of Nigeria. Agris on-Line Papers Econ. Inf. 10, 15–22. doi:https://doi.org/10.7160/aol.2018.100202
- Awe, O. O., Mahmoudvand, R. and Rodrigues, P. C. 2020. Non-negative time series reconstruction via singular spectrum analysis: A case study of precipitation dynamics in Nigeria. Fluctuation Noise Lett.
- Bunde, A. 2017. Long-term memory in climate: Detection, extreme events and significance of trends, Chapter 11. In: Nonlinear and Stochastic Climate Dynamics (eds. C. L. E. Franzke and T. O'Kane). Cambridge University Press, Cambridge.
- Dahlhaus, R. 1989. Efficient parameter estimation for self-similar process. Ann. Statist. 17, 1749–1766. doi:https://doi.org/10.1214/aos/1176347393
- Dumenu, W. K. and Obeng, E. A. 2016. Climate change and rural communities in Ghana: Social vulnerability, impacts, adaptations and policy implications. Environ. Sci. Policy 55, 208–217. doi:https://doi.org/10.1016/j.envsci.2015.10.010
- Ercan, A., Kavvas, M. L. and Abbasov, R. K. 2013. Long-Range Dependence and Sea Level Forecasting. Springer International Publishing, Cham, pp. 1–51.
- Fox, S., Bloch, R. and Monroy, J. 2018. Understanding the dynamics of Nigeria’s urban transition: A refutation of the ‘stalled urbanisation’ hypothesis. Urban Stud. 55, 947–964. doi:https://doi.org/10.1177/0042098017712688
- Gil-Alana, L. A. 2005. Statistical model for the temperatures in the Northern hemisphere using fractional integration techniques. J. Clim. 18, 5357–5369. doi:https://doi.org/10.1175/JCLI3543.1
- Gil-Alana, L. A. 2008. Time trend estimation with breaks in temperature time series. Clim. Change 89, 325–337. doi:https://doi.org/10.1007/s10584-008-9407-z
- Gil-Alana, L. A. 2012. U.K. rainfall data: A long term persistence approach. J. Am. Meteorol. Climatol. 51, 1904–1913. doi:https://doi.org/10.1175/JAMC-D-11-0201.1
- Gil-Alana, L. A. 2017. Alternative modelling approaches for the ENSO time series. Persistence and seasonality. Int. J. Climatol. 37, 2354–2363. doi:https://doi.org/10.1002/joc.4850
- Gil-Alana, L. A., Monge, M. and Romero Rojo, M. F. 2019. Sea surface temperatures: Seasonal persistence and trends. J. Atmos. Oceanic Technol. 36, 2257–2266. doi:https://doi.org/10.1175/JTECH-D-19-0090.1
- Gil-Alana, L. A. and Robinson, P. M. 1997. Testing of unit root and other nonstationary hypotheses in macroeconomic time series. J. Econom. 80, 241–268. doi:https://doi.org/10.1016/S0304-4076(97)00038-9
- Gil-Alana, L. A. and Sauci, L. 2019. Temperatures across Europe. Evidence of time trends. Clim. Change 157, 3, 355–364.
- Granger, C. W. J. 1980. Long memory relationships and the aggregation of dynamic models. J. Econom. 14, 227–238. doi:https://doi.org/10.1016/0304-4076(80)90092-5
- Granger, C. W. J. 1981. Some properties of time series data and their use in econometric model specification. J. Econom. 16, 121–130. doi:https://doi.org/10.1016/0304-4076(81)90079-8
- Granger, C. W. J. and Joyeux, R. 1980. An introduction to long memory time series and fractional differencing. J. Time Ser. Anal. 1, 15–29. doi:https://doi.org/10.1111/j.1467-9892.1980.tb00297.x
- Hannachi, A. 2014. Intermittency, autoregression and censoring: a first‐order AR model for daily precipitation. Met. Apps. 21, 384–397. doi:https://doi.org/10.1002/met.1353
- Hosking, J. R. M. 1981. Fractional differencing. Biometrika 68, 165–176. doi:https://doi.org/10.1093/biomet/68.1.165
- Ishaku, H. T. and Majid, M. R. 2010. X-raying rainfall pattern and variability in Northeastern Nigeria: impacts on access to water supply. JWARP. 02, 952–959. doi:https://doi.org/10.4236/jwarp.2010.211113
- Kyei-Mensah, C., Kyerematen, R. and Adu-Acheampong, S. 2019. Impact of rainfall variability on crop production within the Worobong Ecological Area of Fanteakwa District, Ghana. Adv. Agric. 2019, 1–7.
- Lennartz, S. and Bunde, A. 2009. Trend evaluation in records with long-term memory: Application to global warming. Geophys. Res. Lett. 36, L16706. doi:https://doi.org/10.1029/2009GL039516
- Massah, M. and Kantz, H. 2016. Confidence intervals for time averages in the presence of long-range correlations, a case study on Earth surface temperature anomalies. Geophys. Res. Lett. 43, 9243–9249. doi:https://doi.org/10.1002/2016GL069555
- Mohammed, M. U., Abdulhamid, A., Badamasi, M. M. and Ahmed, M. 2015. Rainfall dynamics and climate change in Kano, Nigeria. J. Sci. Res. Rep. 7, 386–395.
- Nath, P. K. and Behera, B. 2011. A critical review of impact of and adaptation to climate change in developed and developing economies. Environ. Dev. Sustain. 13, 141–162. doi:https://doi.org/10.1007/s10668-010-9253-9
- Ndamani, F. and Watanabe, T. 2014. Influences of rainfall on crop production and suggestions for adaptation. Int. J. Agric. Sci. 5, 367–374.
- Nicholson, S. E., Some, B. and Kone, B. 2000. An analysis of recent rainfall conditions in West Africa, including the rainy seasons of the 1997 El Niño and the 1998 La Niña years. J. Clim. 13, 2628–2640. doi:https://doi.org/10.1175/1520-0442(2000)013<2628:AAORRC>2.0.CO;2
- Olayide, O. E., Tetteh, I. K. and Popoola, L. 2016. Differential impacts of rainfall and irrigation on agricultural production in Nigeria: Any lessons for climate-smart agriculture? Agric. Water Manage. 178, 30–36. doi:https://doi.org/10.1016/j.agwat.2016.08.034
- Olesen, J. E., Trnka, M., Kersebaum, K. C., Skjelvåg, A. O., Seguin, B. and co-authors. 2011. Impacts and adaptation of European crop production systems to climate change. Eur. J. Agron. 34, 96–112. doi:https://doi.org/10.1016/j.eja.2010.11.003
- Ogungbenro, S. B. and Morakinyo, T. E. 2014. Rainfall distribution and change detection across climatic zones in Nigeria. Weather Clim. Extremes 5, 1–6.
- Oguntunde, P. G., Abiodun, B. J. and Lischeid, G. 2011. Rainfall trends in Nigeria, 1901–2000. J. Hydrol. 411, 207–218. doi:https://doi.org/10.1016/j.jhydrol.2011.09.037
- Onyeuwaoma, N. D., Chineke, T. C., Nwofor, O. K., Crandell, I., Awe, O. O. and co-authors. 2018. Characterization of Aerosol loading in urban and sub-urban locations: Impact on atmospheric extinction. Cogent Environ. Sci. 4, 1480333.
- Percival, D. B., Overland, J. E. and Mofjeld, H. O. 2001. Interpretation of North Pacific variability as a short- and long-memory process. J. Clim. 14, 4545–4559. doi:https://doi.org/10.1175/1520-0442(2001)014<4545:IONPVA>2.0.CO;2
- Royston, S., Watson, C. S., Legrésy, B., King, M. A., Church, J. A. and co-authors. 2018. Sea-level trend uncertainty with Pacific climatic variability and temporally-correlated noise. J. Geophys. Res. Oceans 123, 1978–1993. doi:https://doi.org/10.1002/2017JC013655
- Tan, M. L., Ibrahim, A. L., Cracknell, A. P. and Yusop, Z. 2017. Changes in precipitation extremes over the Kelantan River Basin, Malaysia. Int. J. Climatol. 37, 3780–3797. doi:https://doi.org/10.1002/joc.4952
- Yaya, O. S. and Fashae, O. A. 2015. Seasonal fractional integrated time series models for rainfall data in Nigeria. Theor. Appl. Climatol. 120, 99–108. doi:https://doi.org/10.1007/s00704-014-1153-8
- Yu, M. and Liu, Y. 2015. The possible impact of urbanization on a heavy rainfall event in Beijing. J. Geophys. Res. Atmos. 120, 8132–8143. doi:https://doi.org/10.1002/2015JD023336
- Yuan, N., Fu, Z. and Liu, S. 2014. Extracting climate memory using fractional integrated statistical model. A new perspective on climate prediction. Sci. Rep. 4, 6577.
- Yuan, N., Huang, Y., Duan, J., Zhu, C., Xoplaki, E. and co-authors. 2019. On climate prediction; how much can we expect from climate memory? Clim. Dyn. 52, 855–864. doi:https://doi.org/10.1007/s00382-018-4168-5
- Yusof, E., Kane, L. L. and Yusof, Z. 2013. Structural break or long memory: an empirical survey on daily rainfall data sets across Malaysia. Hydrol. Earth Syst. Sci. 17, 1311–1318. doi:https://doi.org/10.5194/hess-17-1311-2013
Appendix
We test the following null hypothesis:
(A1)
(A1)
where do can be any real value, in the model given by EquationEqs. (4)
(4)
(4) and Equation(5)
(5)
(5) by using a version of the tests.
The logged version of the Whittle function is
where f is the spectral density function, P is the periodogram and θ is the vector of unknown parameters in the model given by the EquationEqs. (4)
(4)
(4) and Equation(5)
(5)
(5) (i.e, α, β, d and ρ, along with the variance of ut, σ2). Denoting γ = (α, β)T, and zt = (1, t)T, the tests are based on the Lagrange Multiplier (LM) principle, and thus based on the null differenced model (Equation4
(4)
(4) ), which is:
The functional form of the test statistic is:
where T is the sample size,
is the periodogram of
above, and
and
is the least squares estimate of the seasonal AR coefficient in ut.
Finally, and
in the above expressions are obtained through the first and second derivatives of the log-likelihood function with respect to d, and g is a known function related to the spectral density function of ut:
Thus, for example, if ut is a white noise process, f = σ2/2π, and thus, g = 1; and if it is a seasonal AR(1) process as in (Equation5
(5)
(5) ), g takes the form:
It was shown that, under very mild regularity conditions
and thus, an approximate one-sided 100α%-level of (A1) against the one-sided alternative: d > do will be given by the rule:
where the probability that a standard normal variate exceeds zα is precisely α. Conversely, an approximated one-sided 100α%-level of (A1) against the alternative: d < do will be given by the rule: