
 ?Mathematical formulae have been encoded as MathML and are displayed in this HTML version using MathJax in order to improve their display. Uncheck the box to turn MathJax off. This feature requires Javascript. Click on a formula to zoom.
ABSTRACT
The simulated sea surface temperature anomaly (SSTA) over the tropical Pacific during El Niño–Southern Oscillation (ENSO) is investigated in three representative coupled models: CESM1-CAM5, FGOALS-s2, and FGOALS-g2. It is found that there is a significant westward shift bias in reproducing the zonal distribution (ZD) of the ENSO-related SSTA in CESM1-CAM5 and FGOALS-s2, whereas the SSTA-ZD simulated by FGOALS-g2 is relatively realistic. Through examining the SSTA-ZD during both warm and cold phases of ENSO separately, the authors reveal that the SSTA-ZD simulation bias during the ENSO cycle mainly lies in the bias during the warm phase. It is noted that both the simulated zonal wind stress anomaly () and shortwave heat flux (SW) anomaly exhibit westward shift biases in CESM1-CAM5 and FGOALS-s2, while the counterparts in FGOALS-g2 are relatively reasonable. The westward shift biases in representing
and the SW anomaly (SWA) are attributed to the westward-shifted precipitation anomaly (PrA). It is suggested that the mean SST cold bias over the cold tongue region is the key factor behind the westward-shift bias in simulating the El Niño-related PrA, which leads to the westward-shifted
and SWA. Collectively, the aforementioned anomaly fields, including the dynamic part (
) and thermodynamic part (SWA), contribute to the westward-shift bias in simulating the El Niño-related SSTA. This study provides clues for understanding the ZD simulation biases of ENSO-related fields; however, further in-depth investigation with more model simulations, especially the incoming CMIP6 simulations, is still needed to fully understand the ENSO SSTA-ZD simulation bias in coupled models.
Graphical abstract
摘要
本文分析了三个典型的 CMIP5 耦合模式 (CESM1-CAM5, FGOALS-s2 和 FGOALS-g2) 中 ENSO 海温异常纬向空间分布的模拟偏差, 并对偏差成因做了初步分析。发现三个耦合模式中 ENSO 海温异常纬向分布都表现出不同程度地偏西, 进一步分解发现这一模拟偏差主要来源于 ENSO 正位相, 即, 耦合模式中模拟的厄尔尼诺事件暖海温异常较观测具有明显的偏西偏差。对厄尔尼诺事件进一步合成分析表明, 海温异常纬向空间分布的模拟偏差主要与大气中的纬向风应力异常纬向分布偏西的偏差以及短波辐射异常的强度模拟偏差紧密相关, 该偏差是由厄尔尼诺期间降水异常响应模拟偏西导致的, 而降水异常的模拟偏差则源于赤道冷舌区冷舌过冷。值得指出的是, 该工作只初步探讨了气候背景场中平均海温冷偏差的影响, 并未讨论气候背景场中其他部分的影响, 且只基于有限的三个模式, 主要集中分析了与海温异常纬向分布紧密相关的大气过程的影响, 并未涉及相关的海洋过程的模拟偏差是否起作用, 因此, 将来有必要基于多模式数据集对 ENSO 海温异常纬向分布偏差做更深入的定量诊断和分析。
1. Introduction
The coupled general circulation model (CGCM) has become a powerful tool for examining El Niño–Southern Oscillation (ENSO) dynamics, because of its ability to depict the complex interactions of dynamic and thermodynamic feedbacks in the coupled atmosphere–ocean system (Collins et al. Citation2010). The accuracy of CGCMs in simulating the ENSO phenomenon has been widely evaluated (e.g., AchutaRao and Sperber Citation2006; Guilyardi et al. Citation2009). However, despite the progress that has been made, CGCMs still exhibit significant biases in simulating basic ENSO features (Guilyardi et al. Citation2009; Bellenger et al. Citation2014), which critically restricts their climate predictive skills.
Many studies have reported that current CGCMs have a problem with reasonably simulating ENSO’s amplitude, asymmetry, period, irregularity, spatial pattern, and so on (e.g., Bellenger et al. Citation2014). Among the various aspects of ENSO, realistically representing the spatial distribution of the ENSO-related sea surface temperature anomaly (SSTA) is still challenging in model simulation (Bellenger et al. Citation2014). Previous studies have documented the bias in simulating the meridional structure of the ENSO-related SSTA (Zhang et al. Citation2013). In terms of the bias in representing the SSTA zonal distribution (hereafter, SSTA-ZD) in ENSO simulation, it is noticed that the modeled SSTA-ZD in the tropical Pacific exhibits a significantly westward-shift bias in the models included in phase 3 of the Coupled Model Intercomparison Project (CMIP3) (Leloup, Lengaigne, and Boulanger Citation2008; Yu and Kim Citation2010). The westward-shift bias exhibited in the CMIP3 models still prevails in the CMIP5 models (Zhang and Sun Citation2014). However, little attention has been paid to the physical processes that are responsible for this simulation bias of the ENSO SSTA pattern in CGCMs.
It is suggested that inaccurate duplication of the ENSO-related atmospheric and oceanic feedback processes is responsible for the ENSO simulation bias (e.g., Chen, Yu, and Zheng Citation2016). As ENSO involves various atmosphere–ocean interactions, the collaboration and competition among different atmosphere–ocean feedback processes result in the different ENSO behavior (Bjerknes Citation1969; Jin Citation1997). To the first order, the primary ENSO-related dynamic feedbacks include the thermocline feedback, zonal advection feedback, and Ekman feedback, which are all associated with the zonal wind stress anomaly (hereafter, ) during the ENSO cycle; and the primary ENSO-related thermodynamic feedback is the shortwave feedback (Sun, Yu, and Zhang Citation2009; Chen, Yu, and Sun Citation2013).
Previous studies have pointed out that both the magnitude and zonal structure simulation biases in the modeled lead to ENSO amplitude simulation biases (Watanabe et al. Citation2011; Kim and Jin Citation2011; Zhang and Sun Citation2014). This indicates that the bias in simulating the SSTA-
coupling (which is the essential element of the ENSO dynamic feedbacks) may have a profound influence on the simulation bias in the ENSO-related SSTA-ZD. For the thermodynamic feedbacks, the biases in simulating the zonal structure of the shortwave heat flux (SW) anomalies in CGCMs are also obvious (Chen et al. Citation2019a). Yu and Kim (Citation2010) decomposed the SSTA spatial pattern in CMIP3 models into Eastern Pacific (EP) and Central Pacific (CP) ENSOs and argued that the cold bias in the simulated EP ENSO type is responsible for the westward-shift bias in the total SSTA.
A number of modeling studies have proposed that the mean state bias is a key factor behind ENSO simulation biases. Chen et al. (Citation2019a) and Chen, Yu, and Sun (Citation2013) pointed out that the westward-shift biases in the simulated atmospheric anomaly fields, such as SW and the associated precipitation during the ENSO cycle, arise from the mean SST cold bias over the Pacific cold tongue in CGCMs. Watanabe et al. (Citation2011) and Kim and Jin (Citation2011) argued that the simulation bias of can be attributed to the mean precipitation simulation bias over the eastern Pacific. Zhang and Sun (Citation2014) showed that the westward-shift bias in simulating the
in CMIP5 models is caused by the stronger-than-observed climatological zonal winds.
The aim of this study is to investigate the air–sea feedback processes responsible for the westward-shift bias in simulating the ENSO-related SSTA in CGCMs and provide some preliminary clues for the simulation bias.
2. Data and models
To understand why some models have severe bias in simulating the ENSO-related SSTA-ZD while some models show minor simulation bias, we employed three representative CGCMs from CMIP5 to conduct the analysis. The representative CGCMs used in this study include FGOALS-s2 (Bao et al. Citation2013), FGOALS-g2 (Li et al. Citation2013), and CESM1-CAM5 (Hurrell et al. Citation2013). Both CESM1-CAM5 and FGOALS-s2 show obvious biases in simulating the ENSO-related SSTA-ZD, while FGOALS-g2 presents relatively reasonable simulation (see section 3 for details).
The specific reason for choosing these three CGCMs in this preliminary study, as well as descriptions of the observational and reanalysis datasets, is introduced in detail in the Supplementary Material.
3. Results
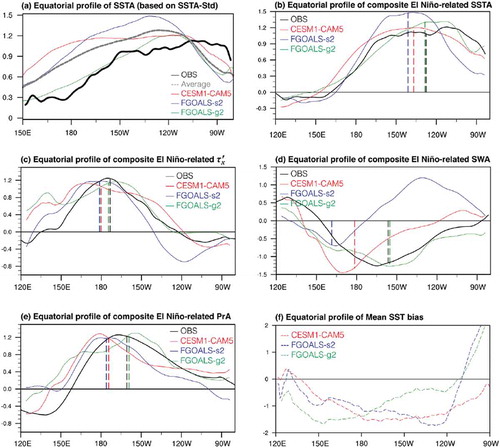
The equatorial profile of the ENSO-related SSTA-ZD is shown in ). Here, we use the standard deviation of the monthly SSTA during the entire time series to represent the distribution of the ENSO-related SSTA. In the observation, most of the ENSO-related SSTA is located across the eastern equatorial Pacific (150°W−80°W). For the three representative CMIP5 models, their average shows an obvious westward-shift bias compared to the observation. In particular, the variability of the observed ENSO-related SSTA peaks at around 100°W and maintains at a high value farther east to the Peruvian coast, but that of the modeled SSTA peaks at around 130°W and exhibits a dramatic decline to the east of its maximum. Specifically, the ENSO-related SSTA simulated by FGOALS-g2 is closer to the observation than its counterparts in FGOALS-s2 and CESM1-CAM5. A recent study (Chen et al. Citation2018) found that the anomaly fields during the ENSO cycle exhibit different spatial patterns between the warm phase (i.e., El Niño) and cold phase (La Niña) of ENSO, and thus we further examine the spatial distribution of the SSTA through separating the ENSO cycle into two phases. The distributions of the El Niño-related SSTA and La Niña-related SSTA along the equator are presented in ,c). It is found that the El Niño-related SSTA exhibits a clear westward-shift bias ()), while the La Niña-related westward-shift bias is relatively minor ()). This indicates that the bias in simulating the ENSO-related SSTA-ZD primarily lies in the bias of the El Niño-related SSTA. Thus, we mainly focus on the simulation bias and the corresponding factors during the ENSO warm phase.
Figure 1. Equatorial profile (averaged over 2°S–2°N) of the standard deviation of the monthly SSTA (units: K) for (a) the whole time series (indicating the entire ENSO cycle), (b) the El Niño situation (only positive SSTA considered), and (c) the La Niña situation (only negative SSTA considered).

shows the composite SSTA pattern during the El Niño mature phase (ND[0]JF[+1]) for the observation and the three representative models. Here, and throughout the paper, the upper-case letters represent months (e.g., N = November, J = January etc.), and the numbers in square brackets indicate the year (i.e., [0] = the current year, [+1] = the following year). In the observation, the pronounced positive SSTA during the El Niño mature phase is located in the eastern equatorial Pacific, with the maxima over the far eastern Pacific east of 120°W ()). As shown in ,c), the El Niño-related SSTA patterns simulated by CESM1-CAM5 and FGOALS-s2 exhibit significant westward-shift biases compared to the observation. In contrast, FGOALS-g2 produces a relatively more realistic SSTA pattern. Furthermore, we calculated the equatorial profile of the SSTA normalized by the magnitude of the SSTA averaged over a broad box in the central–eastern equatorial Pacific (CEEP; 5°S–5°N, 180°–80°W). The result ()) confirms that the westward bias in simulating the El Niño-related SSTA is apparent in CESM1-CAM5 and FGOALS-s2 but not significant in FGOALS-g2.
Figure 2. The horizontal pattern of the composite SSTA (units: K) during the El Niño mature phase (ND[0]JF[+1]) for (a) the observation, (b) CESM1-CAM5, (c) FGOALS-s2, and (d) FGOALS-g2. Here, and throughout the paper, the upper-cse letters represent months (e.g., S = September, O = October etc.), the numbers in square brackets indicate the year (i.e., [0] = the current El Niño year, [+1] = the following year); and the SSTA averaged over the Niño3.4 region (5°S–5°N, 170°–120°W) exceeding 0.5 standard deviations for five consecutive months is considered as an El Niño event. (e) The equatorial profiles (averaged for 5°S–5°N) of the El Niño-related SSTA normalized by the SSTA averaged over a broad box in the central−eastern equatorial Pacific (5°S–5°N, 180°–80°W). The vertical dashed lines indicate the ZDI longitudes of the observed and simulated SSTA-ZD.
![Figure 2. The horizontal pattern of the composite SSTA (units: K) during the El Niño mature phase (ND[0]JF[+1]) for (a) the observation, (b) CESM1-CAM5, (c) FGOALS-s2, and (d) FGOALS-g2. Here, and throughout the paper, the upper-cse letters represent months (e.g., S = September, O = October etc.), the numbers in square brackets indicate the year (i.e., [0] = the current El Niño year, [+1] = the following year); and the SSTA averaged over the Niño3.4 region (5°S–5°N, 170°–120°W) exceeding 0.5 standard deviations for five consecutive months is considered as an El Niño event. (e) The equatorial profiles (averaged for 5°S–5°N) of the El Niño-related SSTA normalized by the SSTA averaged over a broad box in the central−eastern equatorial Pacific (5°S–5°N, 180°–80°W). The vertical dashed lines indicate the ZDI longitudes of the observed and simulated SSTA-ZD.](/cms/asset/00d012f7-657f-417f-8b08-4e09e2417cd3/taos_a_1775475_f0002_c.jpg)
Moreover, we propose a Zonal Distribution Index (hereafter, ZDI) to quantitatively measure the ENSO-related SSTA-ZD. The results based on the ZDI show consistent SSTA-ZD simulation bias; that is, CESM1-CAM5 and FGAOLS-s2 show westward bias in simulating the El Niño-related SSTA, whereas FGOALS-g2 yields a more reasonable El Niño-related SSTA (see section 1 in the Supplementary Material for details).
Based on the assessment above, we examined the ENSO dynamic and thermodynamic feedbacks to demonstrate the physical processes responsible for the westward-shift biases in the three representative CGCMs. In the ENSO cycle, the dominant dynamic feedbacks affecting the evolution of the SSTA include the thermocline (TH), zonal advection (ZA), and Ekman (EK) feedbacks. As described in the introduction, these three ocean dynamic feedbacks (TH, ZA, and EK) all depend on the SSTA- feedback. As boreal autumn is the season of the strongest coupled ENSO instability for ENSO SSTA development (Philander et al. Citation1996; Li Citation1997), we thus next examine the performance of the simulated
during the El Niño developing phase (SOND[0]J[+1]) in the three coupled models. displays the composite
during the El Niño developing phase for the observation and three CMIP5 models. In the observation, the equatorial
stretches farther east to 120°W, with the maxima located to the east of the dateline, and it seems that there is no large deficiency in the ZD of the simulated
in the three coupled models. To facilitate the comparison, we present the normalized
along the equatorial Pacific ()), in a manner similar to that utilized in ). As shown in ), the
simulated by CESM1-CAM5 and FGOALS-s2 show significant westward-shift biases, while its counterpart in FGOALS-g2 does not exhibit westward-shift bias. The ZDI for
is also consistent with this result. Considering the fact that the zonal bias of the SSTA mainly occurs in CESM1-CAM5 and FGOALS-s2, it is suggested that the westward-shifted
favors the westward shift of the positive SSTA’s growth. This is because the farther westward
leads to farther westward ocean dynamic feedbacks (TH, ZA, and EK), naturally causing the growth and development of the El Niño-related SSTA positioning to the west, relative to the observation. Overall, the westward bias in simulating the
contributes to the westward bias in simulating the El Niño-related SSTA.
Figure 3. The horizontal pattern of the composite zonal wind stress anomaly (units: 10−2 N m−2) during the El Niño developing phase (SOND[0]J[+1]) for (a) the observation, (b) CESM1-CAM5, (c) FGOALS-s2, and (d) FGOALS-g2. (e) The equatorial profiles (averaged for 5°S–5°N) of the El Niño-related normalized by the value of the
averaged in the Niño4 region (5°S–5°N, 160°E–150°W). The vertical dashed lines indicate the ZDI longitudes of the observed and simulated equatorial
patterns.
![Figure 3. The horizontal pattern of the composite zonal wind stress anomaly (units: 10−2 N m−2) during the El Niño developing phase (SOND[0]J[+1]) for (a) the observation, (b) CESM1-CAM5, (c) FGOALS-s2, and (d) FGOALS-g2. (e) The equatorial profiles (averaged for 5°S–5°N) of the El Niño-related τx′ normalized by the value of the τx′ averaged in the Niño4 region (5°S–5°N, 160°E–150°W). The vertical dashed lines indicate the ZDI longitudes of the observed and simulated equatorial τx′ patterns.](/cms/asset/254d3a19-69ed-4f15-a235-08d8dc0282b3/taos_a_1775475_f0003_c.jpg)
The SSTA–SW feedback is another key factor affecting the evolution of ENSO. As shown in ), the observed SW anomaly (SWA) exhibits a basin-wide cooling over the equatorial Pacific, with the maxima located to the east of the dateline during the developing phase of El Niño. Clearly, the negative SWA could suppress the development of the positive SSTA over the central equatorial Pacific, which may partly contribute to the fact that the El Niño-related SSTA mainly locates in the eastern equatorial Pacific. For CESM1-CAM5 ()), the maximum SWA is located at 170°E, and that simulated by FGOALS-s2 ()) is located at 160°E, so both simulations have an obvious westward shift (by 25°–35°) compared to the observation (centered around 165°W). The ZDI for the SWA in CESM1-CAM5 and FGOALS-s2 also shows westward-shift biases, by 20°. For CESM1-CAM5 ()) and FGOALS-s2 ()), the simulated SWA locates too far west compared to the observation, and thus the effect of suppressing the positive-SSTA development is marginal to the east of the dateline. In contrast, FGOALS-g2 shows no significant bias in simulating the ZD of the SWA anomaly. To further clarify the role of the SWA simulation bias in affecting the bias in simulating the SSTA-ZD, ) shows the deviation of the simulated SWA from the observation. As presented by the dashed lines in ), the positive/negative difference value at a certain longitude means the cooling effect due to the SWA is weaker/larger than the observed, which leads to the unfavorable/favorable condition for warm SSTA development over the particular longitude. From this viewpoint, we can clearly see that the westward-shifted SWA in CESM1-CAM5 can induce an easier growth and development of the warm SSTA over the location to the west of 120°W than the location to the east of 120°W. This would partly contribute to the westward distribution of the El Niño-related SSTA in CESM1-CAM5 relative to the observation (in which the maximum El Niño-related positive SSTA locates to the east of 120°W). Similarly, the more severe bias in simulating the negative SWA in FGOALS-s2 could falsely overheat the equatorial zonal band extending from 170°W to 120°W compared with the region to the east of 120°W, which partly contributes to the westward-shift bias in simulating the El Niño-related SSTA-ZD. In contrast, the ZD of the SWA simulated by FGOALS-g2 does not show too significant a bias compared to the observation, which may partly contribute to its relatively reasonable simulation of the El Niño-related SSTA-ZD. Overall, the westward bias in simulating the SWA is another key contributor for the westward bias in simulating the El Niño-related SSTA.
Figure 4. The horizontal pattern of the composite shortwave heat flux anomaly (units: W m−2) during the El Niño developing phase (SOND[0]J[+1]) for (a) the observation, (b) CESM1-CAM5, (c) FGOALS-s2, and (d) FGOALS-g2. (e) The equatorial profiles (averaged for 5°S–5°N) of the El Niño-related SWA normalized by the value of the SWA averaged in the Niño4 region (5°S–5°N, 160°E–150°W). The vertical dashed lines indicate the ZDI longitudes of the observed and simulated equatorial SWA patterns. (f) The difference between the model simulations and the observation. (g) Equatorial profile of mean SST (units: K) during the El Niño developing season (SONDJ). (h) As in (g) but for the mean SST bias.
![Figure 4. The horizontal pattern of the composite shortwave heat flux anomaly (units: W m−2) during the El Niño developing phase (SOND[0]J[+1]) for (a) the observation, (b) CESM1-CAM5, (c) FGOALS-s2, and (d) FGOALS-g2. (e) The equatorial profiles (averaged for 5°S–5°N) of the El Niño-related SWA normalized by the value of the SWA averaged in the Niño4 region (5°S–5°N, 160°E–150°W). The vertical dashed lines indicate the ZDI longitudes of the observed and simulated equatorial SWA patterns. (f) The difference between the model simulations and the observation. (g) Equatorial profile of mean SST (units: K) during the El Niño developing season (SONDJ). (h) As in (g) but for the mean SST bias.](/cms/asset/d871860b-240b-4668-b0ba-f1aa95276ade/taos_a_1775475_f0004_c.jpg)
In short, the westward biases in simulating both the and SWA match well with the westward biases in simulating the El Niño-related SSTA. In fact, the bias in simulating both the
and SWA can be attributed to the bias in simulating the atmospheric convection (Sun, Yu, and Zhang Citation2009; Chen, Yu, and Sun Citation2013; Li, Wang, and Zhang Citation2014, Citation2015; Ferrett, Collins, and Ren Citation2018). Hence, we examined the precipitation anomaly (PrA) during the El Niño developing phase for the observation and three CMIP5 models. As shown in Figure S1, the overall performance in simulating the PrA is consistent with the performance in simulating the
and SWA. That is, the PrA simulated in CESM1-CAM5 and FGOALS-s2 exhibit westward biases, whereas FGOALS-g2 generally fits the observation. The westward-shifted atmospheric convection directly leads to the westward-shift bias of the surface wind convergence distribution and cloud cover anomaly, which further induce the westward-shift biases in simulating the
and SWA, respectively.
The investigation above shows that the simulation bias in representing the El Niño-related SSTA-ZD is associated with the bias in simulating the , SWA and PrA. However, it seems that we cannot directly distinguish the causal relationship among the biases in simulating the aforementioned anomaly fields, because ENSO is a product of air–sea interaction, and the simulation outputs were derived from the models that have reached their own equilibrium states. As previous studies have suggested that the mean state simulation bias may be the root physical cause for the biases in simulating the ENSO-related anomaly fields (e.g., Guilyardi et al. Citation2009), we next examined the performance of simulating the tropical mean states in the three coupled models. Among the tropical mean state biases (Figure S7), it is found that the leading factor causing the westward-shift biases in simulating the equatorial PrA is the excessive cold tongue over the CEEP region. As shown in ,h), the mean SST over the cold tongue region simulated by CESM1-CAM5 and FGOALS-s2 exhibits an obvious cold bias compared to the observation. However, the mean SST cold bias in the FGOALS-g2 simulation is relatively mild. As we know, when the El Niño-related SSTA occurs in the CEEP and reaches a certain magnitude, it will induce convection (Graham and Barnett Citation1987). However, when the El Niño-related SSTA with the same magnitude occurs in the CEEP in a CGCM that suffers from a mean SST cold bias, the total SST may not exceed the convection threshold, and thus the appearance of the convection will ultimately shift towards the warmer western equatorial Pacific region. Therefore, it is demonstrated that the simulated colder mean SST over the Pacific cold tongue region pushes the PrA to shift towards the warmer western equatorial Pacific, and then the westward-shifted PrA directly leads to the westward-shifted
and SWA. These westward-shift biases collectively contribute to the westward-shift bias in simulating the El Niño SSTA through SSTA
feedback and SSTA–SW feedback, as discussed above.
4. Summary
In this study, we evaluated the performance of simulating the ENSO-related SSTA-ZD over the equatorial Pacific in three representative CMIP5 models (CESM1-CAM5, FGOALS-s2, and FGOALS-g2), and investigated the contributing factors for the simulation bias through analyzing the corresponding ENSO dynamic and thermodynamic feedbacks. The main findings can be summarized as follows:
The simulated ENSO-related SSTA in CESM-CAM5 and FGOALS-s2 exhibits a significant westward-shift bias compared to the observation, whereas FGOALS-g2 produces a relatively realistic SSTA pattern. By examining the SSTA-SD simulation during the warm and cold phases separately, we find that the westward-shift bias in simulating the ENSO-related SSTA mainly lies in the warm phase.
Through examining the ENSO dynamic and thermodynamic feedbacks, we found that the simulated dynamic aspect (
) is westward shifted compared to the observation, which could lead to the El Niño-related SSTA growth tending towards the west relative to its observed counterpart. From the thermodynamic perspective, the simulated equatorial SWA also exhibits an obvious westward-shift bias in CESM1-CAM5 and FGOALS-s2. Such a westward bias in simulating the negative SWA could falsely overheat the equatorial zonal band extending from 170°W to 120°W compared to the observed El Niño-related SSTA center (i.e., to the east of 120°W), which also contributes to the westward-shift bias in simulating the El Niño-related SSTA-ZD. The westward biases in simulating both the
As the simulation results analyzed here are derived from models that have reached their equilibrium states, it is plausible that we cannot distinguish the causal relationship among the aforementioned ENSO-related anomaly fields. Since previous studies have suggested that the mean state simulation bias is the key factor behind the ENSO-related anomaly simulation biases, we examined the tropical mean state simulation biases. It was found that the mean SST cold bias over the cold tongue region is the key factor for the westward-shift bias in simulating the El Niño-related PrA. Because the cold SST bias over the central−eastern equatorial Pacific prevents the total SST from exceeding the convection threshold, the convection and the associated
Additionally, we show in the Supplementary Material the criteria for selecting El Niño cases and provide our thinking on whether ENSO’s diversity (or the so-called CP El Niño) will or will not influence the current results. For the former issue, we show the spread of the composite results among the cases is minor and argue that our results are not sensitive to how we select the El Niño cases. For the latter issue, our strategy in the current study is to employ the same criteria to select the El Niño cases for both the observation and the CGCMs, which to varying extents have difficulty in reproducing El Niño’s diversity (e.g., Feng et al. Citation2020). Thus, we argue that such a strategy is reasonable when comparing the model simulations with the observation.
It is worth mentioning that this study provides only a preliminary analysis for the simulation biases of the ENSO-related SSTA-ZD, and it is necessary to examine more model simulations, especially the incoming CMIP6 model results, as well as conduct some more in-depth investigations to confirm the preliminary conclusions in this study.
Supplemental Material
Download PDF (5.8 MB)Disclosure statement
No potential conflict of interest was reported by the authors.
Supplementary material
Supplemental data for this article can be accessed here.
Additional information
Funding
References
- AchutaRao, K., and K. R. Sperber. 2006. “ENSO Simulation in Coupled Ocean-atmosphere Models: Are the Current Models Better?” Climate Dynamics 27 (1): 1–15. doi:10.1007/s00382-006-0119-7.
- Bao, Q., P. Lin, T. Zhou, Y. Liu, Y. Yu, G. Wu, B. He, et al. 2013. “The Flexible Global Ocean-Atmosphere-Land System Model, Spectral Version 2: FGOALS-s2.” Advances in Atmospheric Sciences 30 (3): 561–576. doi:10.1007/s00376-012-2113-9.
- Bellenger, H., E. Guilyardi, J. Leloup, M. Lengaigne, and J. Vialard. 2014. “ENSO Representation in Climate Models: From CMIP3 to CMIP5.” Climate Dynamics 42 (7–8): 1999–2018. doi:10.1007/s00382-013-1783-z.
- Bjerknes, J. 1969. “Atmospheric Teleconnections from the Equatorial Pacific.” Monthly Weather Review 97: 163–172. doi:10.1175/1520-0493(1969)097<0163:ATFTEP>2.3.CO;2.
- Chen, L., L. Hua, X. Rong, J. Li, L. Wang, G. Zhang, M. Sun, and Z. Ge. 2019b. “Cloud Radiative Feedbacks during the ENSO Cycle Simulated by CAMS-CSM.” Journal of Meteorological Research 33 (4): 666–677. doi:10.1007/s13351-019-8104-3.
- Chen, L., D.-Z. Sun, L. Wang, and T. Li. 2019a. “A Further Study on the Simulation of Cloud-Radiative Feedbacks in the ENSO Cycle in the Tropical Pacific with A Focus on the Asymmetry.” Asia-Pacific Journal of Atmospheric Sciences 55 (3): 303–316. doi:10.1007/s13143-018-0064-5.
- Chen, L., L. Wang, T. Li, and D.-Z. Sun. 2018. “Contrasting Cloud Radiative Feedbacks during Warm Pool and Cold Tongue El Niños.” Scientific Online Letters on the Atmosphere 14: 126–131. doi:10.2151/sola.2018-022.
- Chen, L., Y. Yu, and D.-Z. Sun. 2013. “Cloud and Water Vapor Feedbacks to the El Niño Warming: Are They Still Biased in CMIP5 Models?” Journal of Climate 26 (14): 4947–4961. doi:10.1175/jcli-d-12-00575.1.
- Chen, L., Y. Yu, and W. Zheng. 2016. “Improved ENSO Simulation from Climate System Model FGOALS-g1.0 To FGOALS-g2.” Climate Dynamics 47 (7–8): 2617–2634. doi:10.1007/s00382-016-2988-8.
- Collins, M., S.-I. an, W. Cai, A. Ganachaud, E. Guilyardi, -F.-F. Jin, M. Jochum, et al. 2010. “The Impact of Global Warming on the Tropical Pacific Ocean and El Niño.” Nature Geoscience 3 (6): 391–397. doi:10.1038/ngeo868.
- Feng, J., T. Lian, J. Ying, J. Li, and G. Li. 2020. “Do CMIP5 Models Show El Niño Diversity?” Journal of Climate 33 (5): 1619–1641. doi:10.1175/jcli-d-18-0854.1.
- Ferrett, S., M. Collins, and H.-L. Ren. 2018. “Diagnosing Relationships between Mean State Biases and El Niño Shortwave Feedback in CMIP5 Models.” Journal of Climate 31 (4): 1315–1335. doi:10.1175/jcli-d-17-0331.1.
- Graham, N., and T. Barnett. 1987. “Sea Surface Temperature, Surface Wind Divergence, and Convection over Tropical Oceans.” Science 238: 657–659. doi:10.1126/science.238.4827.657.
- Guilyardi, E., A. Wittenberg, A. Fedorov, M. Collins, C. Wang, A. Capotondi, G. J. van Oldenborgh, and T. Stockdale. 2009. “Understanding El Niño in Ocean–Atmosphere General Circulation Models: Progress and Challenges.” Bulletin of the American Meteorological Society 90 (3): 325–340. doi:10.1175/2008bams2387.1.
- Hurrell, J. W., M. M. Holland, P. R. Gent, S. Ghan, J. E. Kay, P. J. Kushner, J. F. Lamarque, et al. 2013. “The Community Earth System Model: A Framework for Collaborative Research.” Bulletin of the American Meteorological Society 94 (9): 1339–1360. doi:10.1175/bams-d-12-00121.1.
- Jin,F.-F. 1997. “An Equatorial Ocean Recharge Paradigm for ENSO. Part I: Conceptual Model.” Journal of the Atmospheric Sciences 54: 811–829. doi:10.1175/1520-0469(1997)054<0811:AEORPF>2.0.CO;2.
- Kim, S. T., and F.-F. Jin. 2011. “An ENSO Stability Analysis. Part II: Results from the Twentieth and Twenty-first Century Simulations of the CMIP3 Models.” Climate Dynamics 36 (7–8): 1609–1627. doi:10.1007/s00382-010-0872-5.
- Leloup, J., M. Lengaigne, and J.-P. Boulanger. 2008. “Twentieth Century ENSO Characteristics in the IPCC Database.” Climate Dynamics 30 (2–3): 277–291. doi:10.1007/s00382-007-0284-3.
- Li, L., P. Lin, Y. Yu, B. Wang, T. Zhou, L. Liu, J. Liu, et al. 2013. “The Flexible Global Ocean-atmosphere-land System Model, Grid-point Version 2: FGOALS-g2.” Advances in Atmospheric Sciences 30 (3): 543–560. doi:10.1007/s00376-012-2140-6.
- Li, L., B. Wang, and G. J. Zhang. 2014. “The Role of Nonconvective Condensation Processes in Response of Surface Shortwave Cloud Radiative Forcing to El Niño Warming.” Journal of Climate 27 (17): 6721–6736. doi:10.1175/jcli-d-13-00632.1.
- Li, L., B. Wang, and G. J. Zhang. 2015. “The Role of Moist Processes in Shortwave Radiative Feedback during ENSO in the CMIP5 Models.” Journal of Climate 28 (24): 9892–9908. doi:10.1175/jcli-d-15-0276.1.
- Li, T. 1997. “Phase Transition of the El Niño–Southern Oscillation: A Stationary SST Mode.” Journal of the Atmospheric Sciences 54: 2872–2877. doi:10.1175/1520-0469(1997)054<2872:PTOTEN>2.0.CO;2.
- Philander, S. G. H., D. Gu, D. Halpern, G. Lambert, N.-C. Lau, T. Li, and R. C. Pacanowski. 1996. “Why the ITCZ Is Mostly North of the Equator.” Journal of Climate 9: 2958–2972.
- Sun, D.-Z., Y. Yu, and T. Zhang. 2009. “Tropical Water Vapor and Cloud Feedbacks in Climate Models: A Further Assessment Using Coupled Simulations.” Journal of Climate 22 (5): 1287–1304. doi:10.1175/2008jcli2267.1.
- Watanabe, M., M. Chikira, Y. Imada, and M. Kimoto. 2011. “Convective Control of ENSO Simulated in MIROC.” Journal of Climate 24 (2): 543–562. doi:10.1175/2010jcli3878.1.
- Yu, J.-Y., and S. T. Kim. 2010. “Identification of Central-Pacific and Eastern-Pacific Types of ENSO in CMIP3 Models.” Geophysical Research Letters 37 (15): 242–247. doi:10.1029/2010gl044082.
- Zhang, T., and D.-Z. Sun. 2014. “ENSO Asymmetry in CMIP5 Models.” Journal of Climate 27 (11): 4070–4093. doi:10.1175/jcli-d-13-00454.1.
- Zhang, W., -F.-F. Jin, J.-X. Zhao, and J. Li. 2013. “On the Bias in Simulated ENSO SSTA Meridional Widths of CMIP3 Models.” Journal of Climate 26 (10): 3173–3186. doi:10.1175/jcli-d-12-00347.1.