
 ?Mathematical formulae have been encoded as MathML and are displayed in this HTML version using MathJax in order to improve their display. Uncheck the box to turn MathJax off. This feature requires Javascript. Click on a formula to zoom.
ABSTRACT
Long-term memory (LTM) in the climate system has been well recognized and applied in different research fields, but the origins of this property are still not clear. In this work, the authors contribute to this issue by studying model simulations under different scenarios. The global mean temperatures from pre-industrial control runs (piControl), historical (all forcings) simulations, natural forcing only simulations (HistoricalNat), greenhouse gas forcing only simulations (HistoricalGHG), etc., are analyzed using the detrended fluctuation analysis. The authors find that the LTM already exists in the piControl simulations, indicating the important roles of internal natural variability in producing the LTM. By comparing the results among different scenarios, the LTM from the piControl runs is further found to be strengthened by adding natural forcings such as the volcanic forcing and the solar forcing. Accordingly, the observed LTM in the climate system is suggested to be mainly controlled by both the ‘internal’ natural variability and the ‘external’ natural forcings. The anthropogenic forcings, however, may weaken the LTM. In the projections from RCP2.6 to RCP8.5, a weakening trend of the LTM strength is found. In view of the close relations between the climate memory and the climate predictability, a reduced predictability may be expected in a warming climate.
Graphical Abstract
摘要
近年来, 气候系统中的长期记忆性特征已被广泛应用到气候的多个研究领域, 但这一特征的可能来源目前还不清楚。利用去趋势的波动分析方法, 本文以全球平均气温为研究对象, 分析了多模式在不同情境下的模拟试验结果, 对长期记忆性的可能来源进行了初步探究。研究发现, 全球平均气温序列具有较强的长期记忆性, 且这一特征主要来源于气候系统内部自然变率的贡献。自然外强迫 (尤其是火山活动) 影响的引入可以显著增强全球平均气温序列的记忆性强度, 但人为外强迫具有减弱这一特征的效应。在全球变暖的背景下, 受温室气体辐射强迫的影响, 全球平均气温序列的长期记忆性特征具有减弱的趋势, 这预示着基于记忆性的气候可预报性在未来可能有所降低。为了更好的预测并应对气候变化, 本文的结果从气候记忆性的角度强调了减排和温控的重要性。
1. Introduction
It is well known that the climate system exhibits variability on all time scales ranging from a few seconds to decades or even longer. For many climatic variables, however, the multi-scale variabilities are not arbitrary. Over some temporal ranges, scaling laws among different time scales may be found, indicating the existence of scaling behaviors in the climatic variables, as shown in EquationEquation (1)(1)
(1) :
where represents the time scale and
is the Hurst exponent (Hurst Citation1951). From a mathematical point of view, this fractal behavior means the auto-correlation function
of the considered variable decays with time scale
as a power-law, and the mean correlation time diverges in an infinitely long time series. This phenomenon is named as long-term memory (LTM), as the present value of a given variable may have long-lasting influences in the future, which is different from short-term memory of weather systems that only last for several days to weeks.
With the development of advanced mathematical methods such as the structure function method (Lovejoy and Schertzer Citation2012), wavelet analysis (Arneodo et al. Citation1995), detrended fluctuation analysis (Peng et al. Citation1994; Kantelhardt et al. Citation2001), etc., many climatic variables, including temperature, relative humidity, wind fields, etc., have been proved to have LTM on time scales from months to decades (Koscielny-Bunde et al. Citation1998; Chen, Lin, and Fu Citation2007; Feng et al. Citation2009; Markonis et al. Citation2018). Based on this property, many studies have been carried out in the past to (i) improve climate predictive skills (Lovejoy, Del Rio Amador, and Hebert Citation2015; Yuan et al. Citation2019), (ii) understand the cluster behaviors of extreme events (Bunde et al. Citation2005), and (iii) evaluate the performance of model simulations (Vyushin et al. Citation2004; Zhao and He Citation2015), as well as (iv) other aspects such as trend evaluations (Ludescher et al. Citation2016), etc. Long-term climate memory has become an actively discussed topic in the climate sciences. However, there is one key issue that hinders further development of this research area—namely, where does the LTM come from? There is no obvious physical mechanism that would allow the distant past state of a given variable to directly affect the current state. Several indirect mechanisms such as the regime shift (Franzke et al. Citation2015), multi-scale interactions (Fredriksen and Rypdal Citation2017), etc., have been proposed, but none of them has been widely recognized. In addition, since many climatic variables have LTM, is this property an intrinsic fingerprint of the climate system? It has been argued that the LTM, to some extent, may represent the internal natural variability in the climate system (Yuan et al. Citation2019). Accordingly, the slow varying processes from the ocean may be a main contributor of the observed long-term correlations (Fraedrich and Blender Citation2003; Fredriksen and Rypdal Citation2017). However, without including volcanic activity into dynamical models, model simulations cannot reproduce appropriate scaling behaviors as revealed in observational data (Vyushin et al. Citation2004). Recent studies have even reported that the LTM strength may have century-scale variability, indicating the scaling behavior in EquationEquation (1)(1)
(1) is not fixed for all time scales (Yuan and Fu Citation2014).
If the LTM of a given climatic variable is changeable over time, what would be the factors that alter the LTM strength? To better understand the underlying mechanisms of the LTM in the climate system, this is an important question that needs to be addressed. Especially in the context of global warming, will the increased greenhouse gas concentration induce a changed LTM? To provide clues to the above questions, we analyzed model simulations under different scenarios. In this study, the global mean temperature anomalies (GMTAs) were focused upon. Based on the simulations from different experiments, the effects of different external forcings on the LTM properties were investigated. Pronounced LTM in GMTAs is found in the pre-industrial control simulations, indicating that the LTM is intrinsically originated from the internal natural variability of the climate system. On this basis, external forcings may further alter the LTM. For instance, the inclusion of natural forcings can strengthen the LTM in GMTAs, while the anthropogenic forcings may reduce the LTM. In a warming climate, a decreasing trend of the LTM in GMTAs is found, which may be attributable to the increase in anthropogenic radiative forcings.
The rest of this paper is organized as follows: In section 2, we briefly introduce the data and methods used for the analysis. Results are presented in section 3, where the effects of different factors on the LTM in GMTAs are illustrated. In section 4, we discuss the results and conclude the paper.
2. Data and methods
2.1. Data
In this study, monthly air temperatures simulated from CMIP5 (phase 5 of the Coupled Model Intercomparison Project) models are analyzed (Taylor, Stouffer, and Meehl Citation2012). In order to investigate the effects of different factors on the LTM property, simulations under different scenarios, including the pre-industrial control run (piControl), historical all forcings, natural forcings only (HistoricalNat), greenhouse gas forcings only (HistoricalGHG), anthropogenic aerosols (HistoricalAA), volcanic forcing only (HistoricalVI), and solar forcing only (HistoricalSI) are studied. Besides, future projections under three representative concentration pathways (RCP2.6, RCP4.5, and RCP8.5) are also considered in the analysis. We study the simulations (ensemble member = r1i1p1) from five CMIP5 models (CCSM4, CESM1(CAM5), GFDL-ESM2 M, GISS-E2-H, and GISS-E2-R), which contain all the above scenarios except HistoricalGHG (see ; CESM1(CAM5) does not have the simulation under HistoricalGHG). The simulations were downloaded from the Earth System Grid Federation (https://esgf-node.llnl.gov/search/cmip5/). In CCSM4, CESM1(CAM5), GISS-E2-H, and GISS-E2-R, the historical simulations have a data length of 156 years (1850–2005), while in GFDL-ESM2M the data length is shorter (145 years, 1861–2005). To ensure reasonable comparisons of the LTM strengths between the historical simulations and the piControl runs, for each model the data length of the piControl simulation is selected to be the same as the historical simulations. The data length of the future projections under different RCPs is 95 years (2006–2100). When the results of the historical simulations and the future projections are compared, the data length of the historical simulations are shortened to 95 years (1911–2005).
Table 1. List of the considered models and LTM strengths (DFA values) under different scenarios.
Since we mainly focus on the global mean temperatures, the model simulations at each grid point are first averaged globally according to Brohan et al. (Citation2006). Before detecting the LTM strength, we first calculate the GMTAs by removing the seasonal cycle (Koscielny-Bunde et al. Citation1998), as , where
is the simulated data from the CMIP5 models,
is the data length, and
is the long-term average for each calendar month. Besides the simulations from the five models, we also compute the multi-model means (MMMs) under each scenario and repeat the analysis for a more comprehensive analysis. Additionally, we also analyzed the HadCRUT4 global mean temperature, and the details can be found in the supplementary material.
2.2. Methods
2.2.1. Detrended fluctuation analysis
To measure the LTM strength in the simulated GMTAs, we employ the detrended fluctuation analysis of the second order (DFA2) (Kantelhardt et al. Citation2001). DFA2 is a widely used method that has been proven to be able to measure the LTM in nonstationary time series. Suppose we have a time series , in DFA2, one normally first calculates the cumulative sum (profile)
. After dividing the profile into nonoverlapping windows of size
, the best quadratic fit of the profile and the standard deviation of the profile around this fit
are determined in each window
. Since the data length
is not always a multiple of
, to make full use of the data, normally the same procedure is repeated from the other end of the data, and
(
) windows are obtained. By averaging the results over all windows, the mean fluctuation function
can be obtained as
If increases with
by a power law,
, with the exponent
, the time series
is considered to have LTM. The bigger
is, the stronger the LTM will be. If
, the time series is recognized as white noise (Kantelhardt et al. Citation2001). In this study, the
values in the simulated GMTA data on time scales from months to decades are estimated.
2.2.2. Significance test
To check whether the LTM strength (DFA exponent ) simulated under a given scenario is significantly different from that of another one, the Monte-Carlo test was performed in this study. We used the Fourier filtering technique (Turcotte Citation1997) to generate 10 000 artificial data with the same LTM strength as that in the GMTA simulations under one scenario. By repeating the DFA2 analysis to these artificial data, one can obtain a distribution of the DFA exponent
, according to which the significance level of how the LTM strength under the other scenario deviates can be estimated.
3. Results
3.1. Attribution of long-term climate memory
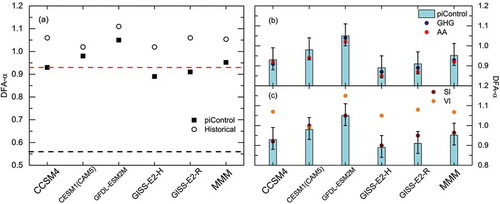
Before the analysis, we studied the HadCRUT4 GMTAs and found strong LTM with (Figure S1). This means LTM does indeed exist in the GMTAs, which allows the following investigations using different model simulations. We first calculate the DFA exponents
in the historical (all forcings) simulations. For the five CMIP5 models and the MMMs, it is clear to see that the DFA exponents ()) are consistently higher than that obtained from the HadCRUT4 data. This means current models still have problems in fully reproducing the observed LTM, and the memory strength in GMTAs is overestimated. However, this does not hinder us from estimating the effects of different factors, as long as we take the model simulations as references. As shown in , the LTM estimated from the piControl simulations are found to be much weaker than that obtained from the historical (all forcings) simulations, but the
values are still significantly larger than
, indicating the existence of LTM. Recall that the piControl experiments only take the internal natural variability of the climate system into account, and so the rise of LTM in the GMTA data indicates that natural variability plays a key role in producing the LTM. As reported in previous studies, multi-scale interactions in the climate system may explain the existence of LTM, and the contribution of slow-varying processes in the ocean is crucial (Fraedrich and Blender Citation2003; Fredriksen and Rypdal Citation2017). On this basis, adding external forcings to the simulations may further alter the LTM strength and fill the gaps between the smaller
in piControl simulations and the larger
in the historical (all forcings) simulations. As shown in ), larger
values are found in most cases when one natural forcing (volcanic forcing or solar forcing) is added. Particularly, the inclusion of volcanic forcing can significantly strengthen the LTM in the simulated GMTA data for most (four out of five) of the considered models. For the anthropogenic forcings, however, smaller
values are found after adding the forcings of either the greenhouse gases or anthropogenic aerosols (note that the
values from HistoricalAA are slightly smaller than those from HistoricalGHG in most of the considered models). Although the weakening of the LTM strength is not statistically significant ()), the
decreases consistently in all the considered models. Accordingly, we have reasons to believe that the external forcings indeed can affect the LTM strength in the GMTA data.
Figure 1. LTM strengths of the simulated GMTA data under different scenarios. (a) DFA values of the historical (all forcings) simulations (open circles) and the piControl simulations (solid squares) for all the considered models. The black dashed line indicates the upper bound of the 95% confidence interval of the DFA exponents obtained from 10 000 white noises of the same length as the model simulations. The red dashed line indicates the
values obtained from the HadCRUT4 data (also see Figure S1). In (b, c), the
values estimated from piControl simulations and those simulated under different external forcings (i.e., greenhouse gas forcing (GHG), anthropogenic aerosols (AA), volcanic forcing (VI), and solar forcing (SI)) are compared. Taking the piControl simulations as references, Monte-Carlo tests were performed to estimate the uncertainties of the LTM strengths for each piControl simulation (error bars).

Suppose the internal natural variability of the climate system laid the foundation of the emergence of the LTM, effects of external forcings may determine the ultimate LTM strength. To better evaluate the effects of different external forcings, we further compare the LTM strengths from different scenarios with that from the historical (all forcings) simulations (). For all the considered models, the inclusion of a natural forcing seems to be more important. For instance, if the solar forcing is considered in the simulation, there are already two models (GFDL-ESM2 M and CESM1(CAM5)) with simulated values comparable to the result from historical (all forcings) simulations. If the volcanic forcing is included, the simulations become even closer to the historical (all forcings) simulations. In this case, the
values fall into the uncertainty intervals of the historical (all forcings) simulations for all the considered models. This finding is in line with previous studies (Vyushin et al. Citation2004) and emphasizes the importance of volcanic forcing in fully capturing the LTM property. In fact, one may speculate that it is the inclusion of natural forcings (solar and volcanic) that allows an improved simulation of the LTM. Although there is no reason to say that the natural forcings produce LTM, they can interact with the internal natural variability of the climate system, alter the multi-scale interactions of different processes, and finally enhance the LTM. In other words, it is the ‘internal’ natural variability and the ‘external’ natural forcings together that determine the main part of the LTM in historical simulations.
Figure 2. Comparison of the DFA exponents between the simulations under different external forcings and the historical (all forcings) simulations. The values obtained from the historical (all forcings) simulations (His) are shown as red points, while the results from other simulations (i.e., greenhouse gas forcing only (GHG), anthropogenic aerosols only (AA), solar forcing only (SI), volcanic forcing only (VI), natural forcings (Nat)) are shown as black points. Taking the historical (all forcings) simulations as references, Monte-Carlo tests were performed to estimate the uncertainties of the LTM strengths for each historical (all forcings) simulation. The red and blue lines represent the upper and lower bounds of the 95% confidence intervals.

However, it is worth noting that LTM determined by the natural variability and the natural forcings is not fixed. As discussed above, the anthropogenic forcings may weaken the LTM strength. Assuming the LTM is a natural attribute of the climate system, this attribute may have been changed by the anthropogenic activities, even though the change is not yet statistically significant. To confirm this inference, the LTM properties of the GMTA data simulated in the future projections are further studied in the next subsection.
3.2. LTM in a warming climate
To investigate how the LTM changes in future projections, especially to answer the question whether increased GHG concentrations will induce changed LTM, we apply DFA to the projected GMTA data under different RCPs. Compared to the historical (all forcings) simulations (), remarkable weaker LTMs are found in the projections of most models. This is reasonable as the future projections cannot include the volcanic forcings into the simulations. In view of the important role that the volcanic activity plays in reproducing the observed LTM (see section 3.1), the smaller values obtained under different RCPs cannot be solely attributed to the increased GHG concentrations. However, a closer look at further reveals that the
values have decreasing trends from RCP2.6 to RCP8.5 for most models. Taking GISS-E2-H as an example, we find
for RCP2.6 and
for RCP4.5, while
for RCP8.5 (see ). Accordingly, the increased greenhouse gas forcing may indeed have a negative impact on the LTM in the GMTA data.
Figure 3. Comparison of the DFA exponents between the historical (all forcings) simulations and the future projections. Taking the historical (all forcings) simulations as references, the middle lines in the boxes represent the DFA- values obtained from the historical (all forcings) simulations. The corresponding uncertainties are estimated by Monte-Carlo tests. The upper and lower borders of the boxes represent 1.5 times the standard deviation around the mean
values of the 10 000 artificial data (see the Methods section). The upper and lower error bars indicate the 95% confidence intervals. The stars represent the results from different RCPs.

To better evaluate the impacts of increased GHG concentrations, we further consider the projections under RCP2.6 as references, and compare the DFA exponents with those obtained from other projections (). Similar to , a decreasing trend of the values is found in most of the considered models, indicating that stronger anthropogenic radiation forcings in the future may induce weakened LTM in the GMTA data. There is only one model (CESM1(CAM5)) that shows enhanced LTM with the increase in anthropogenic radiation forcings, but the enhancement is small, with
. For the other models, the decreased
from RCP2.6 to RCP8.5 ranges from
to
. Particularly, by comparing the
values simulated from RCP4.5 and RCP8.5 with the 95% uncertainty intervals of the
values from RCP2.6, there is one model (GISS-E2-H) that already reveals a significant reduction in LTM strength. The weakening of the LTM in other models is still within the uncertainty intervals. With the increase in anthropogenic radiation forcings, however, the
values are weakened to be very close to the lower bounds of the uncertainty intervals (e.g., see CCSM4, GISS-E2-R, etc.). As for the results of the MMMs, monotonically decreasing of the
values from 0.99 (RCP2.6) to 0.94 (RCP8.5) is found, but the changes are not yet statistically significant.
Figure 4. The LTM strengths in the projections under different RCPs. The results from RCP2.6 are considered as references, and the dashed lines represent the upper and lower bounds of the 95% confidence intervals, which are obtained from the Monte-Carlo tests. Panels (a–e) show the results of the five considered models, while (f) shows the results of the multi-model means.

In the context of global warming, the above findings support the hypothesis that LTM in the future may become weaker. This may indicate a reduced climate predictability in terms of climate memory. In view of the uncertainties in estimating the DFA exponents, however, the weakening may not be remarkable as long as proper actions are taken to control the warming trend.
4. Discussion and conclusion
Understanding the mechanisms of LTM in the climate system is of great importance, especially for research that employs this feature. In this study, we attempt to contribute to this issue by analyzing model simulations under different scenarios. From the piControl simulations alone, we have detected LTM in the GMTAs, indicating the rise of LTM is closely related to the internal natural variability of the climate system. However, further study suggests that this detected LTM is not fixed. External forcings may further modulate the LTM strength. By comparing the LTM strengths from one-external-forcing only simulations with those from piControl simulations, the natural forcings are found to be able to strengthen the LTM. Especially, the inclusion of natural forcings allows an improved simulation of the LTM that is comparable to the historical (all forcings) simulations. Accordingly, we have reasons to say that the LTM from historical (all forcings) simulations, or more precisely speaking, the observed LTM properties in the climate system, may be mainly controlled by both the ‘internal’ natural variability and the ‘external’ natural forcings.
Regarding the anthropogenic forcings (i.e., greenhouse gases and anthropogenic aerosols), their impacts on the LTM strength are much smaller. More importantly, these impacts are found to be negative for most models. That is, the anthropogenic forcings may weaken the observed LTM from the natural (climate) system. Since both greenhouse gases and anthropogenic aerosols may affect the atmospheric radiation balance, one potential reason for the weaker LTM might be related to the altered atmospheric states, which change much faster than the state of the ocean. Particularly, a weakening trend of the LTM strength is found in the projections from RCP2.6 to RCP8.5, indicating weaker LTMs in a warming climate. Since the LTM in the climate system is closely related to the climate predictability (Yuan et al. Citation2019), the weakened LTM may contribute to a reduced climate predictability, which is in line with the recent findings by Li et al. (Citation2020). As discussed in Li et al. (Citation2020), global warming may accelerate dynamical processes in the climate system (e.g., the propagation of Rossby waves), shorten large-scale climate variabilities, and thus reduce the potential predictability. Although the projected weakening of the LTM is still not statistically significant in most models, effective actions are urgently required to control the future warming trend. It is worth noting that we used GMTAs as a representative to study the LTMs under different scenarios. To further deepen our understanding of LTM, more works that focus on local regions and different variables are still needed. We intend to report relevant results in this respect in follow-up papers.
taos_a_1778418_sm1684.pdf
Download PDF (143.1 KB)Disclosure statement
No potential conflict of interest was reported by the authors.
Additional information
Funding
References
- Arneodo, A., E. Bacry, P. V. Graves, and J. F. Muzy. 1995. “Characterizing Long-range Correlations in DNA Sequences from Wavelet Analysis.” Physical Review Letters 74 (16): 3293–3296. doi:10.1103/PhysRevLett.74.3293.
- Brohan, P., J. J. Kennedy, I. Harris, S. F. B. Tett, and P. D. Jones. 2006. “Uncertainty Estimates in Regional and Global Observed Temperature Changes: A New Data Set from 1850.” Journal of Geophysical Research 111 (D12): D12106. doi:10.1029/2005JD006548.
- Bunde, A., J. F. Eichner, J. W. Kantelhardt, and S. Havlin. 2005. “Long-term Memory: A Natural Mechanism for the Clustering of Extreme Events and Anomalous Residual Times in Climate Records.” Physical Review Letters 94 (4): 048701. doi:10.1103/PhysRevLett.94.048701.
- Chen, X., G. X. Lin, and Z. Fu. 2007. “Long-range Correlations in Daily Relative Humidity Fluctuations: A New Index to Characterize the Climate Regions over China.” Geophysical Research Letters 34 (7): L07804. doi:10.1029/2006GL027755.
- Feng, T., Z. Fu, X. Deng, and J. Mao. 2009. “A Brief Description to Different Multi-fractal Behaviors of Daily Wind Speed Records over China.” Physics Letters A 373 (45): 4134–4141. doi:10.1016/j.physleta.2009.09.032.
- Fraedrich, K., and R. Blender. 2003. “Scaling of Atmosphere and Ocean Temperature Correlations in Observations and Climate Models.” Physical Review Letters 90 (10): 108501. doi:10.1103/physrevlett.90.108501.
- Franzke, C., S. Osprey, P. Davini, and N. Watkins. 2015. “A Dynamical Systems Explanation of the Hurst Effect and Atmospheric Low-frequency Variability.” Scientific Reports 5: 9068. doi:10.1038/srep09068.
- Fredriksen, H.-B., and M. Rypdal. 2017. “Long-range Persistence in Global Surface Temperatures Explained by Linear Multi-box Energy Balance Models.” Journal of Climate 30 (18): 7157–7168. doi:10.1175/JCLI-D-16-0877.1.
- Hurst, H. E. 1951. “Long-term Storage Capacity of Reservoirs.” Transactions of the American Society of Civil Engineers 116 (1): 770–799.
- Kantelhardt, J. W., E. Koscielny-Bunde, H. H. A. Rego, S. Havlin, and A. Bunde. 2001. “Detecting Long-range Correlations with Detrended Fluctuation Analysis.” Physica A: Statistical Mechanics and Its Applications 295 (3): 441–454. doi:10.1016/S0378-4371(01)00144-3.
- Koscielny-Bunde, E., A. Bunde, S. Havlin, H. E. Roman, Y. Goldreich, and H. J. Schellnhuber. 1998. “Indication of a Universal Persistence Law Governing Atmospheric Variability.” Physical Review Letters 81 (3): 729–732. doi:10.1103/PhysRevLett.81.729.
- Li, S., L. Wu, Y. Yang, T. Geng, W. Cai, B. Gan, Z. Chen, Z. Jing, G. Wang, and X. Ma. 2020. “The Pacific Decadal Oscillation Less Predictable under Greenhouse Warming.” Nature Climate Change 10: 30–34. doi:10.1038/s41558-019-0663-x.
- Lovejoy, S., and D. Schertzer. 2012. “Low Frequency Weather and the Emergence of the Climate.” In Extreme Events and Natural Hazards: The Complexity Perspective, edited by A. S. Sharma, A. Bunde, D. Baker, and V. P. Dimri, 231–254. Washington, D. C.: AGU monographs. doi:10.1029/2011GM001087.
- Lovejoy, S., L. Del Rio Amador, and R. Hebert. 2015. “The ScaLIng Macroweather Model (SLIMM): Using Scaling to Forecast Global-scale Macroweather from Months to Decades.” Earth System Dynamics 6 (2): 637–658. doi:10.5194/esd-6-637-2015.
- Ludescher, J., A. Bunde, C. L. Franzke, and H. J. Schellnhuber. 2016. “Long-term Persistence Enhances Uncertainty about Anthropogenic Warming of Antarctica.” Climate Dynamics 46 (1–2): 263–271. doi:10.1007/s00382-015-2582-5.
- Markonis, Y., Y. Moustakis, C. Nasika, P. Sychova, P. Dimitriadis, M. Hanel, P. Mca, and S. M. Papalexiou. 2018. “Global Estimation of Long-term Persistence in Annual River Runoff.” Advances in Water Resources 113 (MAR.): 1–12. doi:10.1016/j.advwatres.2018.01.003.
- Peng, C. K., S. V. Buldyrev, S. Havlin, M. Simons, and A. L. Goldberger. 1994. “Mosaic Organization of DNA Nucleotides.” Physical Review E Statistical Physics Plasmas Fluids & Related Interdisciplinary Topics 49 (2): 1685–1689. doi:10.1103/PhysRevE.49.1685.
- Taylor, K. E., R. J. Stouffer, and G. A. Meehl. 2012. “An Overview of CMIP5 and the Experiment Design.” Bulletin of the American Meteorological Society 93 (4): 485–498. doi:10.1175/BAMS-D-11-00094.1.
- Turcotte, D. 1997. Fractals and Chaos in Geology and Geophysics. 2nd ed. Cambridge: Cambridge University Press. doi:10.1017/CBO9781139174695.
- Vyushin, D., I. Zhidkov, S. Havlin, A. Bunde, and S. Brenner. 2004. “Volcanic Forcing Improves Atmosphere-Ocean Coupled General Circulation Model Scaling Performance.” Geophysical Research Letters 31 (10): 377–393. doi:10.1029/2004GL019499.
- Yuan, N., Y. Huang, J. Duan, C. Zhu, E. Xoplaki, and J. Luterbacher. 2019. “On Climate Prediction: How Much Can We Expect from Climate Memory?” Climate Dynamics 52 (1): 855–864. doi:10.1007/s00382-018-4168-5.
- Yuan, N., and Z. Fu. 2014. “Century-Scale Intensity Modulation of Large-scale Variability in Long Historical Temperature Records.” Journal of Climate 27 (4): 1742–1750. doi:10.1175/jcli-d-13-00349.1.
- Zhao, S., and W. He. 2015. “Evaluation of the Performance of the Beijing Climate Centre Climate System Model 1.1(m) to Simulate Precipitation across China Based on Long-range Correlation Characteristics.” Journal of Geophysical Research Atmospheres 120 (24): 12576–12588. doi:10.1002/2015JD024059.