
ABSTRACT
This article introduces the second release of the Most Important Problem Dataset (MIPD) – a publicly available dataset that codes all available responses to the most important problem question in American public opinion. In the article, we first describe a number of innovations in the new release of the dataset and then demonstrate its usefulness through illustrative cases. In the new MIPD, we switch from providing a single code for the entire response to the various quasi-responses contained in the response, added information on the state in which the interview took place, and subcategories that include – when relevant – information on the preferred levels of policy. These improvements allow for more fine-grained categories and facilitate more accurate inferences at the individual- and aggregate-level. We also extended the time frame through 2020. The new MIPD codes responses from over 850 surveys of more than a million Americans from 1939–2020 into 110 issue categories.
Introduction
The Most Important Problem Dataset (MIPD), introduced by Heffington, Park, and Williams (Citation2019), codes all available surveys from the Roper Center of Public Opinion Research and the American National Election Survey (ANES) that included some variation of the “most important problem” or the “most important issue” questions. So far, the dataset has been used by scholars of public opinion and political behavior to explore research questions on partisan agenda fragmentation (Gruszczynski Citation2019), presidents’ unilateral policy agendas (Rogowski Citation2023), the public salience of crime (Shi, Lu, and Pickett Citation2020), gender differences in policy priorities (Yildirim Citation2022), to name a few. While certainly useful, the MIPD did not reach its full potential because of a few notable limitations which we seek to overcome in this update.
In this project, we describe our extension of the MIP data set and demonstrate the usefulness of our novel approach in coding MIP mentions through empirical applications. In addition to extending the period of coverage through 2020, the new MIPD now includes information on the state in which the interview took place, preferred levels of policy (e.g. “too little” and “too much” defense spending) and the geographical focus in MIP responses (e.g. Middle East) when this information is available. Perhaps more importantly, this extension adopts a new approach that seeks to minimize potential errors in the coding of MIP responses. Due to practical challenges facing polling agencies, verbatim answers related to relatively low-frequency issue areas are usually lumped into categories with the other low-frequency responses. To minimize measurement errors related to this issue, we switch from coding responses to coding quasi-responses, provide separate MIP codes for each quasi-response, and properly weight observations based on multiple quasi-responses. With increased precision in the coding of MIP answers and the addition of information on the location of interviews, the resulting dataset constitutes an important improvement over the original MIPD, allowing for analyses of problem importance across time (81 years) and space (50 US states).
In what follows, we first briefly describe the original MIPD data collection and present a number of areas for improvement. We then discuss the innovations we have undertaken in the MIPD, and explain some of the potential implications of these innovations. Most importantly, we justify our decision to code quasi-responses instead of responses, and how this shift improves the accuracy of issue importance measures at the individual- and aggregate-level. We leverage geographic information to derive state-level estimates of problem importance, and in doing so we reveal spatial patterns that drive the public’s issue agenda. In the concluding section we offer avenues for future research using this invaluable dataset.
Data collection
Overview of the most important problem dataset
The original MIPD includes over 670 separate surveys that were conducted between 1939 and 2015 with 816,000 respondents. The most important feature of the MIPD is that it codes responses to the MIP question into specific categories (e.g. “welfare”) that are collapsible into general categories (e.g. “social policy”) across time. Importantly, because the MIPD also provides the fieldwork dates, users can aggregate responses into different time frames to suit their interests (such as election periods or months). MIP responses can also be aggregated by sociopolitical characteristics, including partisan affiliation, age, gender, and education categories, among others.
Despite these novelties, however, there is considerable room for improvement in the MIPD. First and foremost, the initial release of the MIPD coded responses into a single category. This made sense initially, as respondents were asked to identify a single most important problem in the vast majority of cases.Footnote1 Unfortunately, because polling companies face space constraints when preparing the original open-ended responses for public distribution, survey companies limit the total number of response categories available in the data release. Common responses that are high on the public’s agenda (e.g. “the economy” or “war”) are likely to have their own categories, but more unique responses (e.g. “housing” or “work stoppages”) are likely to be lumped into categories with the other low-frequency responses. The result is that surveys often have a limited number of categories, and those categories often contain more than one categorizable response. To illustrate, consider how the open-ended responses to the most important problem question were assigned into 12 response values in the CBS/New York Times January 1982 survey (see the first column of ). A large portion of MIP response value categories include multiple categorizable components that can qualify as separate MIP answers (e.g. “morality/drugs”). Since the original verbatim responses are not available, it is impossible to know which of the various problems in the category the respondent offered. To minimize this response error, we code quasi-responses – each mention of a distinct issue or problem – instead of a single response for each respondent.
Table 1. Response Categories from the CBS/New York Times January 1982 Survey and MIPD Codes for Releases 1 and 2.
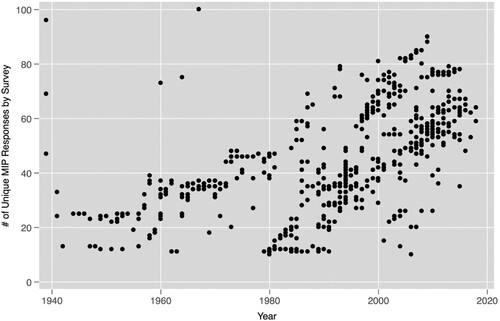
Second, as seen in , the number of response categories has increased dramatically in the past four decades. As survey companies offered more response categories, the slippage between the verbatim response and the response category became less severe simply because there are more fine-grained response categories to accurately reflect the responses. While the potential for coding errors has declined over this time period, coding decisions naturally become more difficult with growing variety of response categories. As such, the initial MIPD coding scheme cannot possibly reflect an extremely diverse set of responses from over a million Americans. Therefore, a more expansive and flexible coding scheme is necessary to minimize potential coding errors in MIP responses.
Figure 1. The Number of Response Categories by Survey over Time.
Finally, the initial coverage of the MIPD spans from 1939 to mid-2015 represents a missed opportunity to study important recent incidents that shaped American politics in crucial ways, including the election of Donald J. Trump and the coronavirus pandemic. Extending the temporal domain offers a promising avenue to advance our understanding of the dynamics of public opinion in challenging times.
Improvements over the existing coding scheme
The new coding scheme makes at least three major contributions. First, we have switched from coding responses to coding quasi-responses in the new release. The original version of the MIPD provides a single code that reflects the respondent’s most important problem. The initial release either coded the first quasi-response in the overall response as reflecting the most important problem or tried to provide a general code, so a response category of “Soviet Union, world peace, war” could be coded as either “Soviet Union” (first) or “Foreign Policy” (general). The advantage of the new approach over the one taken in the original MIPD is best illustrated by an example. Of the 12 response categories from the CBS/New York Times poll shown in the first column of the most ambiguous category is “Other domestic/disabled people, poor, welfare, unions, crime” because it contains quasi-responses that are coded into six different specific and three different general MIPD categories: Social Policy (201), Specific Groups: Disabled (217:5), Poverty (207), Welfare (202), Industrial Policy: Unions (110:1), and Crime (401). In the first release this response would most likely be coded as Social Policy (201). In the new release we code each separate quasi-response listed in the response category. Furthermore, we provide a weight for each quasi-response. In the above example, each quasi-response is given a weight of 1/6 because it is not possible to identify which of the six quasi-response categories the respondent actually selected; there is a 4/6 chance that the response falls into the Social Policy general category (200s) and a 1/6 chance that it falls into either Economy (100s) or Law and Order (400s).
Coding the quasi-responses provides a better representation of respondents’ issue priorities and a more accurate reflection of the underlying uncertainty. Of the 1,043,060 respondents, 488,803 fall into a category with a single quasi-response and the remainder are in categories with multiple quasi-responses (with a mean of 2.2). Providing a single MIPD code for the 47% of respondents with only one quasi-response is not problematic. For the remaining 53% of respondents, forcing a single code onto an MIP response that has multiple quasi-responses is problematic. In fact, this procedure will only produce accurate aggregate level percentages of MIP if two assumptions are empirically true: first, the various quasi-responses all fall into the same category, and second, that patterns in providing multiple different quasi-responses do not vary systematically across demographic characteristics. In the best case scenario, a response with multiple quasi-responses in the same general category will not lead to bias at the aggregate level. For instance, a response given a value of “taxes, unemployment, and inflation” will have 100% of the codes attributed to the general category of Economy (100) so it will not be incorrect when general categories are aggregated. The same cannot be said at the individual level, as this process produces a distorted picture of the concerns listed by the respondent (showing 100% “taxes” or “economy” rather than 1/3 each of “taxes”, “unemployment” and “inflation”). Of the 554,257 respondents whose responses fall into categories with multiple quasi-responses, almost 70% have quasi-responses that are coded into different specific MIPD quasi-response categories and 12% of the quasi-responses potentially fall into different general MIPD categories. Clearly, the first assumption is not accurate. In the section that follows, we delve into some of the potential consequences of coding errors in MIP responses.
Second, we have developed a more expansive coding scheme. To illustrate this expansion, consider the categories and sub-categories for two (of the 12) general categories listed in : Economy, and Social Policy. If a quasi-response contains enough information, it can also be coded into sub-categories. For example, a quasi-response related to Education (third and fourth columns) can be coded into sub-categories related to Facilities, and Teachers.
Table 2. Sample of MIPD Coding Scheme for Economy, and Social Policy General Categories.
We coded over 2,150,000 quasi-responses provided by around a million respondents into 110 response categories (including sub-categories containing more information and area categories identifying the country or region of interest). This represents a significant improvement over the number of categories utilized in the original MIPD. In addition to being more expansive, this approach lets users design their own coding schemes to fit their particular research purposes. Some of the most notable changes include adding categories that were ill-suited for other places (Immigration), reorganizing some categories (Freedom), and adding some informative sub-categories (Domestic Commerce, Education, Civil Rights, Representation and Accountability, Political Process). The more expansive coding scheme is particularly useful for surveys after 1970 when the number of response categories increases beyond 10–15 broad categories (see ). If one wants to focus on broad categories, then the coding scheme is easily collapsible.
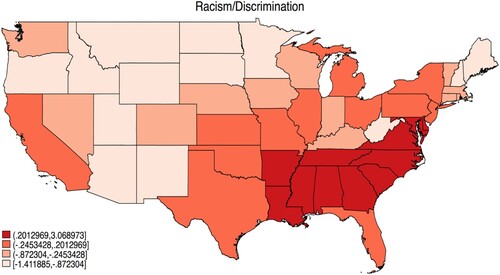
Figure 2. Issues Related to Racism and Discrimination as the MIP across States.
The new coding scheme also adds more nuance to some of the existing categories. As an example, nearly 25,000 respondents mentioned defense spending as the MIP facing the country, which would normally be coded under the main category of defense in the original MIPD. However, unlike many MIP categories such as crime, natural disasters and inflation, it is hard to deduce policy preferences from spending mentions (e.g. “government spending”, “defense spending”, “social spending”). To fill this gap, we created a separate variable that codes stated policy preferences (“too little”, “neutral”, and “too much”) for all spending mentions. Of the 25,000 defense spending mentions, for instance, nearly 7,000 imply “too little defense spending” as the MIP. This is helpful if one’s interests deal with preferences for spending. However, if one is interested in the prioritization or importance of the spending issue, this scheme is easily collapsible so that the quasi-responses fall into the “defense spending” or “spending” categories rather than directional preferences (such as “too much”). Additionally, our dataset includes a variable that includes information on the geographical focus of all quasi-responses (e.g. the Middle East, Vietnam, Iraq).
Empirical applications
An analysis of quasi-responses
Recall that the first release of the MIPD was limited to providing a single coded MIP value for each survey response. The analysis described above suggests that this procedure might produce misleading codes for quasi-responses for almost 70% of the respondents. Each survey company faces different space constraints for the public distribution of the survey, which limits the number of response categories. These surveys typically provide separate categories for the most pressing issues but also lump lower-frequency responses into “catch-all” or “wild card” categories. For example, each open-ended response (e.g. “property taxes”) has to be first coded by the polling company into a category (e.g. “taxes”) and then into a smaller number of response categories. The result is that a response of “property taxes” will be lumped into a category with other quasi-responses, such as “taxes, unemployment, and inflation”.
Whether a response falls into a category with multiple quasi-responses depends on particular survey design choices (including the number of response categories and decisions to lump categories together) and whether the single problem identified by the respondent happens to fall into its own category provided by the polling company.Footnote2 Common responses that are frequently high on the public’s agenda (e.g. “the economy” or “war”) are in response categories by themselves, but more unique responses (e.g. “housing” or “work stoppages”) are likely to be lumped into categories with other low-frequency responses. Based on the publicly released data alone, it is impossible to know which of the various quasi-responses the respondent selected. This is a type of response error that was neglected in the initial release.
It is quite possible that demographic characteristics and partisan affiliation might explain providing a response that is lumped into a value category with multiple responses. What are the inferential consequences of failing to account for multiple quasi-responses for such a high percentage of the population? If some groups of respondents are more likely to provide problems that fall into a “catch-all” category – where there is response error – then the former procedure will exclude (or minimize the variation in) problems provided by those groups. To explore this possibility, we generate binary variables first representing whether the response category contains multiple quasi-responses (such as “taxes, unemployment, and inflation”), and second, if multiple quasi-responses are given, whether the response categories contain different specific categories (such as “values, war”). For each model we estimate a simple linear probability model with a selection of common demographic variables. Given that there are a variety of circumstances beyond the respondents’ control that influence the prevalence of quasi-responses, we also include survey fixed-effects. Our expectations are simple; if we find evidence of any connection between the variables and responses that fall into categories with multiple (or different) quasi-responses, we should question the utility of only coding a single response for each respondent.
The first column of shows the folly of the conventional approach, as we can identify which groups are most likely to have their responses combined into ill-fitting categories (even after controlling for the particular idiosyncrasies of the survey). Multiple quasi-responses are more common among older respondents, those from non-urban areas, low education, low income and respondents with weaker partisan ties. One possibility is that those groups respond by providing a single problem that is less salient or less common than other groups, and thus more likely to be grouped into catch-all or wild card response categories. For these respondents, a single response cannot reflect the true variation in their important problems.
Table 3. Determinants of Multiple Quasi-Responses and Mentions of Different General and Specific Quasi-Response Categories.
The second and third columns of explore how those same variables influence the likelihood of the response being coded into a category with quasi-responses from different specific and general categories given that the response category has multiple quasi-responses (such as “Retirement” and “Social Policy” in ). The results suggest that whites, females, high educated, low income and respondents with weaker partisan ties are most likely to have multiple quasi-responses provided from different categories. In a process that only codes one response, the variation in problems listed by various sociodemographic subgroups will be neglected. When we aggregate these responses at the national level, the previous approach systematically overweights, for example, males. This is likely to contribute to the overall pattern of polarization of issues at the macro-level, and it is difficult to partition the true pattern of polarization from the effect related to coding problems.
The most important problem(s) across states
The second release of the MIPD now includes respondent state. This new information allows us to construct state-level policy priorities across 50 states and the District of Columbia in the past 80 years. The MIPD also has information on such characteristics as income level, residence (i.e. major city vs. rural or small town), partisan identification for the vast majority of respondents, so users can explore various interesting relationships between social/political cleavages and issue prioritization across time and space. Of the 1,043,060 respondents, nearly 890,000 have information on state identifier.
We first provide an overview of state-level patterns in problem importance in .Footnote3 For each state, we calculate and rank the three most common response categories. As one might expect, both Economy and Employment occupy the top two places for most states, with Inflation, Foreign Policy and War also occurring quite often. However, a more interesting analysis is the most “disproportionate” category for that state. For each state we calculate the percentage in that category, then subtract the national percentage and divide that difference by the standard deviations across states. This gives a standardized score where a value of 2, for example, means that the percentage for that category for that state is two standard deviations above the mean value. This indicates that respondents in that state think that issue is considerably more important than respondents in other states. We also provide the top three disproportionate categories for each state based on this standardized value. The “disproportionate” values are greatly in line with our understanding of the prioritization of issues across states, including natural disasters (Louisiana), pollution (California), privacy rights (Nebraska), housing policy (New York), and church and state conflict (Tennessee), to name a few.
Table 4. Most Common and Disproportionate Categories for Each State
We further explore these standardized scores across US states for racism/discrimination () and immigration () to show the importance of these issues relative to the national average. Interesting patterns are immediately evident in the figures. demonstrates that MIP mentions related to racism and discrimination carry a greater weight, in relative terms, in the Southern states, some of the most racially diverse parts of the country. In stark contrast, issues related to racism and discrimination occupy a disproportionately small space in the public’s policy agenda in the western US, except for the state of California.
Figure 3. Issues Related to Immigration as the MIP across States.
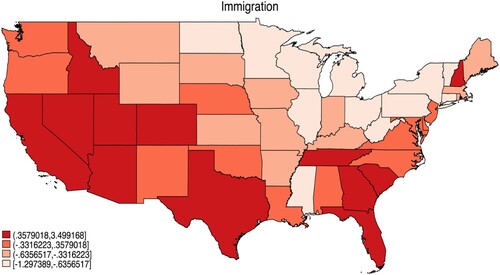
shows the variation in the relative importance of MIP mentions related to immigration. The figure shows substantial variance across states, with parts of southwestern and southern states giving disproportionately more MIP answers related to immigration. All in all, our descriptive analysis suggests that although respondents are generally in agreement regarding the most important problems facing the country when measured in absolute terms, there are striking disparities in the relative importance of certain issue areas across states. We demonstrate the variation in three additional areas, Environment, Unemployment and Agriculture in the online appendix (see Figures A.1, A.2 and A.3), which corroborate our original conclusion.
and clearly show that the public’s issue importance is geographically clustered. To get a better sense of the strength of the spatial dependence, we offer Moran’s I statistics which measures whether states have similar disproportionate values as their contiguous neighbors (Darmofal Citation2015).Footnote4 Overall, 92% of the problem categories indicate positive patterns of spatial dependence based on Moran’s I, and 71% reach statistical significance at the 95% confidence level. Racism and Immigration exhibit some of the strongest patterns of positive spatial clustering, with Moran’s I values of 0.59 and 0.55 (both statistically significant). It is clear that respondent concerns about issue priorities are positively clustered geographically. Based on our understanding of mass political behavior, we speculate that spatial dependence comes from spatial clustering of the sources of problem importance rather than diffusion or behavioral interdependence (Darmofal Citation2015). To the extent that this argument holds true, one can argue that spatial clustering of the sources of problem importance might have important implications for various macro-phenomena, from voting behavior and political representation to partisan polarization and political moods.
Conclusion
In this research note, we introduced the second release of the MIPD and demonstrated its usefulness through various empirical applications. Although our main motivation with the new release was to offer an expansive coding scheme that allows for greater flexibility, we undertook various additional changes that we believe substantially increased the usefulness of the data. The new coding scheme provides a larger number of topic categories and gives weights to each quasi-response, allowing considerable freedom for users to construct their own measures of issue importance at both the individual- and aggregate-levels. Moreover, the added nuance to our coding scheme with the inclusion of subcategories (e.g. types of political institutions, directional spending categories) and regional focus (e.g. the Middle East) allows for more fine-grained analysis of policy priorities across time and space.
Another important novelty of our data set was the coding of states in which the interview was conducted. To demonstrate the usefulness of this new feature, we provided state-level patterns in the prioritization of issues related to racism/discrimination and immigration as the MIP between 1939 and 2020. With this data set, scholars will have the opportunity for the first time to examine state-level policy priorities across several decades. Recent scholarship reminds us that the sources of issue importance are often local (Fortunato, Swift, and Williams Citation2018). In fact, perceptions about many of the important problems such as crime and unemployment begin to take form almost exclusively at the local level based on one’s first-hand experience with the problem. Future research looking at the relationship between objective state-level performance outcomes (e.g. crime level, unemployment) and issue prioritization patterns might prove useful in understanding the local sources of American policy priorities.
Supplemental Material
Download MS Word (1.9 MB)Disclosure statement
No potential conflict of interest was reported by the author(s).
Notes
1 Some surveys asked separate questions for the first, second and third most important problems and the responses appeared in different variables.
2 A notable exception includes the American National Election Studies starting in 1984. At that time, interviews followed up “most important problem” response by probing for “anything else”, “other problems”, or more explanation for the problem. This encouraged multiple quasi-responses, which is clear when examining the verbatim open-ended responses that are publicly available.
3 Since the surveys are not intended to produce representative state-level measures, these results are merely exploratory.
4 The weights matrix is based on simple contiguity and is not row-standardized.
References
- Darmofal, David. 2015. Spatial Analysis for the Social Sciences. Cambridge: Cambridge University Press.
- Fortunato, David, Clint S Swift, and Laron K Williams. 2018. “All Economics is Local: Spatial Aggregations of Economic Information.” Political Science Research and Methods 6 (3): 467–487. https://doi.org/10.1017/psrm.2016.26
- Gruszczynski, Mike. 2019. “Evidence of Partisan Agenda Fragmentation in the American Public, 1959–2015.” Public Opinion Quarterly 83 (4): 749–781. https://doi.org/10.1093/poq/nfz046
- Heffington, Colton, Brandon Beomseob Park, and Laron K Williams. 2019. “The “Most Important Problem” Dataset (MIPD): A new Dataset on American Issue Importance.” Conflict Management and Peace Science 36 (3): 312–335. https://doi.org/10.1177/0738894217691463
- Rogowski, Jon C. 2023. “Public Opinion and Presidents’ Unilateral Policy Agendas.” American Journal of Political Science 67 (4): 1134–1150.
- Shi, Luzi, Yunmei Lu, and Justin T Pickett. 2020. “The Public Salience of Crime, 1960–2014: Age–period–cohort and Time–series Analyses.” Criminology; An Interdisciplinary Journal 58 (3): 568–593. https://doi.org/10.1111/1745-9125.12248
- Yildirim, Tevfik Murat. 2022. “Rethinking Women’s Interests: An Inductive and Intersectional Approach to Defining Women’s Policy Priorities.” British Journal of Political Science 52 (3): 1240–1257. https://doi.org/10.1017/S0007123421000235