
ABSTRACT
Land use/land cover (LULC) change, caused by human activities, can strongly affect wildlife species and their habitats. Yet, human impacts onto lakes and associated indicator bird species such as the lesser flamingos (Phoeniconaias minor) have rarely been investigated. We used remote sensing images from 1989 to 2019, with additional interviews and focus group discussions to investigate how LULC change and agricultural activities adjacent to the Momella lakes, Tanzania, have affected the flamingo habitat. Agricultural areas increased strongly over time, and most respondents earned their living through crop farming. The use of synthetic fertilizers, and limited knowledge about fertilizer effects on environmental health, were evident. We highlight that LULC data combined with socio-economic assessments is essential to understanding the dynamics and impacts of human activities on wildlife. We recommend training for sustainable farming practices around areas of high conservation values and integrating land use changes and socio-economic dynamics into conservation efforts.
Introduction
In view of our rapidly growing human population, managing natural resources and conserving biodiversity increasingly rely on information about Land-Use/Land Cover (LULC) change as a crucial component (Kayet & Pathak, Citation2015; Rawat & Kumar, Citation2015). These LULC changes have recently led to local, regional and global impacts on habitat loss, biodiversity loss, and deterioration of ecosystem services (J. Chen et al., Citation2014; Patel et al., Citation2019). In addition, human-wildlife conflicts have also become prevalent (Gusset et al., Citation2009; Sanare et al., Citation2022). Globally, about 40% of the earth’s land surface has been transformed into agriculture and settlements (Foley et al., Citation2005; Sanderson et al., Citation2002). As a result, anthropogenic LULC change has drastically increased (Hu et al., Citation2019; Rahman et al., Citation2012), particularly in Eastern Africa, where annual human population growth rates are approaching 3% (Juma et al., Citation2014; URT, Citation2022). Accordingly, human land use has encroached into the vicinity of protected areas, posing challenges to management and biodiversity conservation efforts (Kija et al., Citation2020; A. J. Kitalika et al., Citation2018). Particularly in Africa, the recent LULC changes have rarely been combined with socio-economic aspects that the local population is facing, expansion needs of their agricultural or livestock activities and associated resource use. Further, few studies have investigated how these LULC might change the habitat of focus animal species in eastern Africa (Mmbaga et al., Citation2017; Ntukey et al., Citation2022). We claim that it is essential to incorporate data on LULC change in a transdisciplinary manner to understand further trends (Mmbaga et al., Citation2017; Tiwari & Saxena, Citation2011).
Among the common core human activities, crop farming can cause land degradation and compromise water quality (A. J. Kitalika et al., Citation2018; Tahiru Doke & Baatuuwie, Citation2020) as forests, wetlands, grasslands and riparian habitats progressively are being converted into croplands and settlements (Guida-Johnson & Zuleta, Citation2013; Yanda & Shishira, Citation2001). In addition, water catchments have shown increased nutrient imports by nitrogen and phosphorus, affecting surface and ground-water quality (L. Chen et al., Citation2001; Gong et al., Citation2006). While a range of eutrophication studies exist in the global north, little research has been conducted in the global south. Particularly little is known about how selected wildlife species, for example, water birds, and their habitats are affected by eutrophication. Thus, the lesser flamingo (Phoeniconaias minor), a specialist species that can also act as an indicator species for lake ecosystem health (Marttila, Citation2011), might be severely impacted by agriculture due to eutrophication because they can only live in a small range of environmental conditions and have a restricted diet (Clavel et al., Citation2011; Ramiadantsoa et al., Citation2018).
The lesser flamingo is a water-dependent, nomadic and obligate algae filter feeder (Kaggwa et al., Citation2013; Tuite & Tuite, Citation2000). It feeds on Arthrospira fusiformis in shallow soda lakes and wetlands (Krienitz, Krienitz, et al., Citation2016; Pálmai et al., Citation2020), being nomadic and crossing between various habitats according to the suitability of the feeding conditions (Childress et al., Citation2008; Tuite & Tuite, Citation2000)., The body size and weight are approximately 80 to 90 cm long and 1.5 to 2 kg, respectively, and they have a life span of over 40 years in the wild (Childress et al., Citation2008). The lesser flamingos predominate in Eastern, Southern and Western Africa; East Africa holds the largest lesser flamingo population, amounting to 1.5 to 2.5 million individuals that contribute to 75% of the global population (Childress et al., Citation2008; Mgimwa et al., Citation2021). The BirdLife (Citation2018) classified the lesser flamingos as near-threatened species due to their rapid population decline and significant habitat degradation caused by human-induced activities such as deforestation, farming, drainage and pollution (BirdLife, Citation2018; Mmassy et al., Citation2018). Over the past three decades, Tanzania has recorded a 20–40% decline in the population of lesser flamingo (Krienitz, Citation2018; URT, Citation2010). Moreover, other findings indicate that human activities such as farming and settlements near soda lakes have also increased, affecting the species’ breeding and foraging requirements (A. J. Kitalika et al., Citation2018; Nonga et al., Citation2011). However, our understanding of LULC spatial patterns and temporal trends and their possible effects on water, soil and, thus, lesser flamingo habitat is still limited, particularly in human-dominated areas bordering conservation sites.
The Momella lakes, within the Arusha National Park, represent a tourism attraction, contributing to the tourism economy of the Tanzanian government, which covers about 17% of Tanzania’s GDP and directly and indirectly employs about 600,000 people (URT, Citation2015). In addition, with the history of engagement between communities and the conservation institutions, the local community around the National Park profits from social services provision through benefit-sharing mechanisms (Kegamba et al., Citation2022; URT, Citation2015). The lesser flamingos utilize the Momella lakes all the time outside their breeding season (December – February), when they gather at Lake Natron in Tanzania, so they should be found in high numbers at the Momella lakes from February to November, before the start of the breeding season (Childress et al., Citation2008; Kihwele et al., Citation2014; Krienitz, Krienitz, et al., Citation2016). Previous studies indicate that cyanobacteria blooms, which are a result of eutrophication frequently occur in these lakes, creating unfavourable foraging conditions and likely being lethal to lesser flamingos (Lugomela et al., Citation2006; Nonga et al., Citation2011) due to the toxic compounds of cyanobacteria (Rastogi et al., Citation2014; Zanchett & Oliveira-Filho, Citation2013.
Despite the reported effects of eutrophication on lesser flamingos in the lakes, information on spatio-temporal occurrence of these cyanobacteria and spatio-temporal LULC changes that might affect these is limited (Lihepanyama et al., Citation2022). A study on the water quality in lakes Big Momella and Rishateni revealed significant monthly variations in algal biomass, with low levels from May to December 2020 and high levels between January and April 2021 (Lihepanyama et al., Citation2022). The highest increase to 9.51 mg/l was found in March when agricultural activities might be high and rains might have washed nutrients from the surrounding areas and contributed to a rise in algal biomass (Lihepanyama et al., Citation2022; Nguyen et al., Citation2019). Moreover, lesser flamingo numbers soured significantly, amounting to about 9,000 individuals at Lake Big Momella and 10,000 individuals at Lake Rishateni in January and February 2021, coinciding with high algal biomass, after which the numbers dropped in March and April 2021 (Lihepanyama et al., Citation2022). In addition, the latest lesser flamingo population estimates from the Arusha National Park (ANAPA) indicated that the number of lesser flamingos visiting the lakes had dropped significantly from 60,067 to 873 individuals that visited the lakes for foraging in 2020 (Kihwele et al., Citation2014; Krienitz, Krienitz, et al., Citation2016). Despite growing concerns about the impact of LULC change on biodiversity, habitat loss and water quality degradation (Akhtar et al., Citation2021; Guida-Johnson & Zuleta, Citation2013), there is still inadequate information on the spatio-temporal extent of LULC change in agricultural land adjacent to the protected area and the lakes.
Therefore, the objectives of this study were (1) to quantify spatio-temporal patterns of LULC change over the past three decades (1989–2019) and to bring this into a socio-economical context, i.e. by (2) assessing small-holder farming practices of the local community that surrounds the Momella lakes. We combined maps based on satellite images with interviews, focus group discussions, grey literature and field surveys. In addition, a digital elevation model (DEM) was used to model the terrain of the study lakes’ catchment area. We anticipated that agriculture and settlements have significantly expanded over the last 30 years and addressed potential socio-economic underlying factors for increasing agriculture. We quantified potential livestock impact and crop fertilizer input to relate that to water quality since we anticipated that these factors might cause water pollution. We expected that only a small proportion of our interviewees were aware of the LULC impacts on the Momella lakes and the associated flamingo population.
Our study provides a basis for understanding the spatial and temporal trends of LULC changes, in relation to small-holder farming practices adjacent to a protected and highly fragile sodic lake ecosystem. Our findings will serve as a baseline for education initiatives to enhance sustainable farming practices while fostering coexistence strategies essential for protecting sodic lake-dependent specialist species such as the lesser flamingos in this unique lake system.
Materials and methods
Study site
The Momella lakes are located at the eastern border of Arusha National Park (ANAPA), Tanzania (). Apart from the lakes, the ANAPA, which was established in 1967, includes Mount Meru (4,566 meters) and highly undulating land, e.g. the Ngurdoto Crater with a diameter of 3.6 km at its widest point and 100 m depth (Marttila, Citation2011; URT, Citation2009). The Momella lakes ecosystem consists of seven soda lakes, situated on the undulating slopes of Mount Meru, which include Rishateni and the Big Momella lakes (Marttila, Citation2011; URT, Citation2009). The lakes were formed from the volcanic debris created when Mount Meru erupted 250,000 years ago (URT, Citation2023). The alkaline nature of the lakes’ sodium bicarbonate (NaHCO3) is a result of hydrolysis of silicate minerals in the alkaline lava and ash (Ghiglieri et al., Citation2010). The Momella lakes are rich in biodiversity and form a perfect home for many aquatic birds, both resident and migrant, such as the greater flamingos (Phoenicopterus roseus), the lesser flamingos (Phoeniconaias minor), pelicans (Pelecanus onocrotalus), Egyptian geese (Alopochen aegyptiaca), Helmeted guineafowls (Numida meleagris), African fish eagles (Haliaeetus vocifer), African jacanas (Actophilornis africanus), Maccoa ducks (Oxyura maccoa) and many others (Marttila, Citation2011). Surrounding the lakes are green hills and seasonal streams, which form preferred spots for mammalian herbivores such as waterbucks (Kobus ellipsiprymnus), buffalos (Syncerus caffer), Masai giraffe (Giraffa tippelskirchi), zebra (Equus grevyi), bushbucks (Tragelaphus sylvaticus), and hippos (Hippopotamus amphibius) (Marttila, Citation2011).
Figure 1. Map showing the location of lakes Big Momella and Rishateni, and the area (defined by the black line), within which the land use/land cover (LULC) changes from the year 1989 to 2019 were analyzed. Socio-economic activities were assessed in Miririny village, between February and March 2021, on the eastern side of Momella lakes, Tanzania.
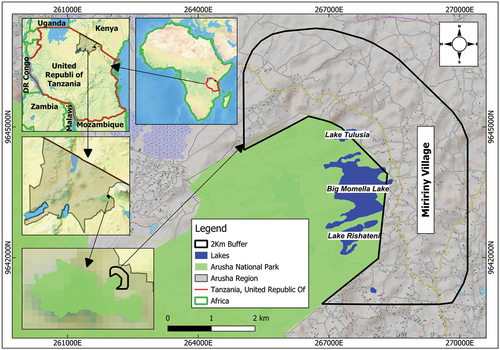
Our study was confined to the lakes Big Momella and Rishateni in northern Tanzania because they are crucial foraging grounds for East Africa’s lesser flamingo local population and are located on the outskirts of ANAPA, with only 67% of the lakes’ surrounding area being protected (Marttila, Citation2011; URT, Citation2010). As a result, the lakes are at risk of human-induced activities such as farming and settlements, which are located directly adjacent to the lakes (see Appendix A: and ). The average annual air temperatures in the study site range from 12 to 28°C and average annual rainfall varies between 500 mm and 1,200 mm, displaying a bimodal pattern with long rains between February and May and short rains between November and January (Marttila, Citation2011; URT, Citation2017). The lakes are fed by underground streams, rainfall and run-off from valleys that drain water into the lakes from the surrounding catchment areas (Marttila, Citation2011; Scoon, Citation2018).
The study area is located in the Arusha region, Meru district, with a local human population of about 268,000 individuals, which has a 2.7% annual growth rate (See Appendix A: ), with nearly 350 households currently residing directly adjacent to the lakes on the eastern side (URT, Citation2017; URT, Citation2013). Agriculture provides the major income for this local population (URT, Citation2017), which might put the lakes at risk of pollution (URT, Citation2017), and likely impacts lesser flamingo foraging availability (Baker & Baker, Citation2002; Marttila, Citation2011). Hence, addressing LULC alterations due to agricultural activities near protected areas will help Park management as well as local communities to reduce terrestrial and aquatic habitat deterioration (dos Santos et al., Citation2010; Kija et al., Citation2020).
Remote sensing and land cover assessment
To assess LULC changes over the years 1989, 1999, 2009, and 2019, we analyzed time series pairs of Landsat 5 Thematic Mapper (TM), Landsat 7 Enhanced Thematic Mapper Plus (ETM) and Landsat 8+ images, which we downloaded from the United States Geological Surveys (USGS; https://glovis.usgs.gov) and Earth Explorer (https://earthexplorer.usgs.gov). All images had a spatial resolution of 30 m and were recorded in the dry season on clear days, with < 10% cloud cover to avoid differences due to phenological effects (Msofe et al., Citation2019; Ntukey et al., Citation2022; Rwanga & Ndambuki, Citation2017). Data on geographical and temporal land use/land cover changes were produced using Remote Sensing (RS) and ArcGIS 10.5 software using the World Geodetic System 1984 (WGS84) and projected to Universal Transverse Mercator (UTM) Zone 37S. To enhance the quality of the images, we employed image pre-processing techniques such as layer stacking for radiometric corrections and geometric distortions (Gao & Zhang, Citation2009; Msofe et al., Citation2019; Ntukey et al., Citation2022).
Additionally, we used Google Earth and other high-resolution imagery engines to identify signature files as the standard for classification and digitized land cover classifications as small polygons (J. R. Anderson, Citation1976; Jansen & DiGregorio, Citation2003). We employed the Maximum Likelihood Classification (MLC) and random forest (RF) algorithms in ArcMap 10.5 for supervised image classification to determine land cover classes (Horning et al., Citation2010; Msofe et al., Citation2019; Ntukey et al., Citation2022). Accordingly, six LULC types were generated: agriculture, bareland, bushland, grassland, forest and water based on the IPCC’s Good Practice Guidance for Land Use Classification (IPCC, Citation2006) and Tanzania Land Use Planning Commission (Msofe et al., Citation2019; Twisa & Buchroithner, Citation2019), with some modifications (). The class ‘agriculture’ applied in this study also included scattered settlements because the local communities typically build their houses within or directly adjacent to their croplands for security purposes and as a strategy for owning bigger portions of land.
Table 1. Description of LULC classes used in our analyses on land-cover change from the year 1989 to 2019 on the Eastern side of the Momella lakes, Tanzania, based on the classification scheme provided in the IPCC’s Good Practice Guidance for Land Use Classification, also adopted by the Tanzania land use planning commission (IPCC, Citation2006; Twisa & Buchroithner, Citation2019).
For performing LULC change detection, a post-classification detection method was employed (Rawat & Kumar, Citation2015), which included filtering, smoothing, and generalizing to reduce noise and improve the quality of the classified output (Msofe et al., Citation2019; Ntukey et al., Citation2022). Our land cover change analysis focused solely on the Eastern side of the lakes with a 2 km buffer zone covering 1,726 ha. We used cross-tabulation to identify changes that occurred in the area covering three different periods, i.e. from the years (1) 1989–1999, (2) 1999–2009 and (3) 2009–2019 (El-Hattab, Citation2015; Ntukey et al., Citation2022). ERDAS Imagine software was used to create a change matrix (Weng, Citation2001). The quantitative statistics of the overall LULC changes for three periods and gains and losses in each category were then compiled. In line with the LULC assessment, we also determined the average annual rainfall for the Arusha National Park using observational data consisting of rainfall records and rainfall datasets extracted from the Center for Hydrometeorology and Remote Sensing (Nguyen et al., Citation2019). We did this to determine whether the study area’s rainfall pattern may have had an influence on the land cover changes and the farming practices.
Socio-economic assessment
We conducted interviews in Miririny, the only village land that borders the study lakes east of the Arusha National Park (), between February and March 2021, to understand land use practices related to social and economic activities.
The assessment employed purposeful sampling (Palinkas et al., Citation2015; Suri, Citation2011) to select households that directly bordered the study lakes on the eastern side, all located within a 1 km buffer zone from the ANAPA boundary, with the presumption that run-off from these areas could potentially contaminate the lakes (Wang et al., Citation2020). The purposeful sampling in combination with the snowball technique was employed in selecting the households from where respondents were recruited (Nonga et al., Citation2011). We considered respondents who were active in crop farming and livestock keeping and were willing to participate in the study (Msofe et al., Citation2019; Nonga et al., Citation2011). Delphi technique was employed or used to engage local government officials and agricultural extension agents, who served as key informants, and provided information that facilitated the selection and recruitment processes (Felix et al., Citation2022; Msofe et al., Citation2019).
Moreover, the respondents had to be 25 years old and above, because we targeted individuals who had been residents in the area and active for at least five years in crop farming or livestock keeping, with the ability to communicate their experiences and opinions (Felix et al., Citation2022; Palinkas et al., Citation2015). In total, we selected 35 individuals, representing about 10% of the local households in the area (Msofe et al., Citation2019), to examine respondents experience and perception towards land use (Bekele & Ago, Citation2022; Bernard, Citation2013). The target respondents were the household heads and we had both males and females among the respondents (; Supplementary File 1). We obtained informed consent from the respondents to participate in this study at the time of recruitment (Chisanga et al., Citation2019). In addition, we adhered to ethical considerations that included securing a permit from the Meru District Council, and treating the information from the respondents with confidentiality (Felix et al., Citation2022; Palinkas et al., Citation2015; Secor, Citation2010).
Table 2. Type of information collected during the socio-economic survey on the eastern side of Momella lakes, Tanzania, during the study period between February and March 2021 (for the detailed questionnaire see Supplementary File 1).
We used a semi-structured interview protocol to gather information from the respondents (Nonga et al., Citation2011; Palinkas et al., Citation2015). The interview protocol was prepared in English and then translated into the local language of Kiswahili by an expert in language, and iterated for pre-testing to ensure clarity, performance, validity, and reliability (Roberts & Priest, Citation2006; Sarmah & Hazarika, Citation2012). The interview guide covered critical aspects, which included the respondent’s demographic information, socio-economic activities, social-economic support such as farming practices through the uses of synthetic fertilizers and animal manure from 1989 to 2019, perceptions of soil and water pollution, and attitudes towards lesser flamingo presence (; Supplementary File 1).
Data organization and analysis
The collected interview data was manually organized to harness each respondent’s information and converted to quantitative data by coding based on the thematic contents (Halevi Hochwald et al., Citation2023; Lochmiller, Citation2021; Nonga et al., Citation2011). Statistical Package for Social Sciences (SPSS) and Jamovi software were employed to compute frequencies and categorize the magnitude of the activities and any associations between the farmers’ practices and their possible effects on water nutrients and quality in the lakes.
Results
Spatio-temporal trends of LULC between 1989 and 2019
We found the most significant shifts in LULC in agriculture and bareland, which increased and decreased by 38%, respectively, between the years 1989 and 2019. However, bareland occupied the largest portion (46%) of the study site in 1989 and then declined (See Appendix B: ). Furthermore, we observed that in 1989, agriculture covered 7% of the study site and increased to 17%, more than twice its size, in 1999. In contrast, bareland declined by 20%, nearly half its size during this period, exhibiting the highest declining rate of 35 ha/year compared to the other years of the study period (; see Appendix B: ). The change detection matrix revealed that between 1989 and 1999, bareland contributed much to this change in agricultural land, as 68% of bareland was converted to agriculture (see Appendix B: ).
Figure 2. The spatial pattern of LULC changes during the study period of the years 1989–2019 at the eastern side of the Momella lakes, northern Tanzania. Land cover categories were based on the classification scheme provided in the IPCC’s Good Practice Guidance for Land Use Classification, also adopted by the Tanzania Land Use Planning Commission (IPCC, Citation2006; Twisa & Buchroithner, Citation2019). The area statistics of each land use type based on the classified images of the study area are provided (see Appendix B: ).
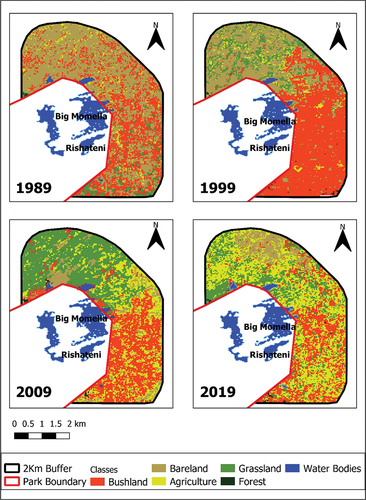
We further noticed a 13% expansion in agricultural land between the years 1999 and 2009. In contrast, bareland declined by 9%, almost half its size during this period (: see Appendix B: ). While bushland increased by 8%, exhibiting the highest increasing rate of 14 ha/year, grassland increased by 4% during this period. The change detection matrix revealed that between 1999 and 2009, bareland and bushland contributed much to the change observed in agricultural land, as they both contributed about 66%, about two-thirds, to agriculture (see Appendix B: ). In addition, bareland and bushland contributed about 28% and 34%, respectively, to the observed changes in grassland. Besides, our results about the rainfall pattern of the study area revealed that in the first two decades, the average amount of rainfall increased from 985 mm (in the years 1989–1999) to over 1000 mm (1999–2009) and then decreased to 974 mm in the last decade (See Appendix B: ). In line with these variations in average rainfall, we also observed a rapid expansion of bushland area between 1989 and 1999 (; see Appendix B: ).
Additionally, the amount of land used for agriculture increased by 15% between the years 2009 and 2019, making it the largest land cover class. During this last decade, agriculture showed the greatest annual growth rate (27 ha/year) compared to the other studied land cover classes. Meanwhile, bushland, bareland and grassland declined by 9%, 5% and 1%, respectively (; see Appendix B: ). The change detection matrix revealed that agriculture gained 26%, nearly one-third its size from grassland between 2009 and 2019. In addition, 47% of grassland, nearly half its size, was converted to bushland and agriculture while bushland lost 18% of its area to agriculture during this period (see Appendix B: ).
Socio-economic assessment
The high increase in agricultural land we observed in the LULC change analysis was also reflected in our household interviews and focus group discussion results. We found that most (89%) residents (n = 31) earned their living mainly through crop farming and livestock keeping, and only 14% worked in governmental or private institutions. In addition, most (74%) residents (n = 26) also revealed that during the 2000s, they noticed an increase in the need for land for farming activities, settlement, and for building infrastructure in their immediate surroundings.
Most (88%) interviewees cultivated mainly maize (Zea mays), followed by common beans (83%), on an average field area of 0.5–1.5 ha (; and ). Other crops cultivated included bananas (Musa sp.), sunflower (Helianthus annuus), finger millet (Eleusine coracana), sweet potatoes (Ipomoea batatas), pigeon pea (Cajanus cajan) and coffee (Coffea arabica), which is often intercropped with banana. The growing season was mainly between January and June, except for bananas and coffee, which were grown throughout the year (). In addition, drought-resistant crops such as pigeon pea and finger millet extended the normal growing season. Because of the undulating terrain and the often rocky soils in some areas, 80% of the farmers claimed that they employed traditional technologies, such as oxen and hand hoes, for ploughing.
Figure 3. Map showing (a) the location of the households surveyed (b) farm size owned (c) number of livestock owned and (d) the use of fertilizers by each household in Miririny village as based on our interview outcomes, between February and March 2021, on the eastern side of the Momella lakes, Tanzania.
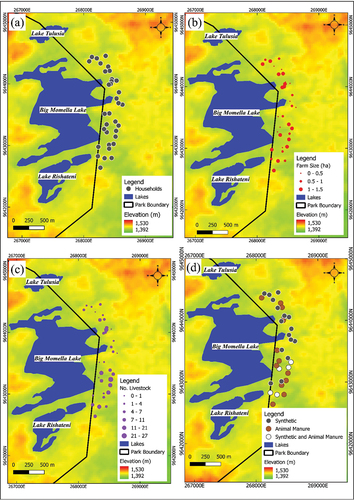
Table 3. The number (frequency of respondents) and percentage of farmers growing certain crops as stated by our interviewees in the study area around Arusha National Park, in Miririny village, northern Tanzania, during our survey from February to March 2021 (Frequency = number of respondents, N = 35). Multiple answers were possible.
In addition to crop farming, most (84%) respondents also kept livestock, mainly in small numbers of < 10 individuals, including cows (indigenous Tanzania Short Horn Zebu), goats (Capra hircus), sheep (Ovis aries) and donkeys (Equus asinus) (; see Appendix C: ). Furthermore, most respondents (83%) practiced free grazing and a few (17%) did zero grazing, particularly during the agricultural production season. As observed and stated by the livestock keepers, the grazing was mostly done within the Momella lakes’ riparian vegetation (see Appendix A: ). Most farmers (81%) reported that they only have one agricultural extension officer as per the current government provision, who is currently unable to fully help them with their farming and livestock practices.
Awareness and attitude towards pollution and the lesser flamingo presence
The farmers differed in their responses regarding the application of fertilizers, with two-thirds (66%) of the interviewees using synthetic fertilizers (n = 23), and one-third (n = 12) using only animal manure in their farming practices to overcome poor soil fertility. As revealed by the farmers, the fertilizers that were frequently used included Di-ammonium phosphate (DAP) for seed germination and Urea as well as NPK for plant growth (; see Appendix C: ).
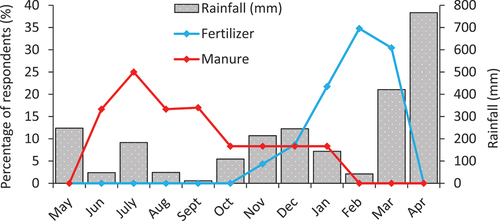
Furthermore, most (60%) farmers claimed they could easily obtain fertilizers from agro-dealers, commonly known as ‘Mawakala wa Mbolea.’ However, out of the 12 interviewees who applied animal manure, 75% claimed that they could not get enough animal manure as they only had modest livestock herd sizes. Two-thirds (64%) of the farmers also admitted that they applied fertilizers twice during one growing season, especially between January and April (), typically on maize plants, while one-third of the farmers (36%) applied the fertilizer (Urea) only once. To prevent infections and contaminating their crops, those who utilized animal manure (34%) incorporated it into the soil in the months outside of the growing season ().
Figure 4. Plot showing monthly average rainfall (mm) and percentage of interviewed local people (%) applying animal manure (natural fertilizer) and chemical fertilizer between May 2020 and April 2021 in the community bordering the Momella lakes, northern Tanzania.
Based on the size of their farms, the average amount of N fertilizer used by the farmers ranged between 25 kg N to 50 kg N, equivalent to 1 to 2 bags (each 50 kg) of Urea fertilizer per household per growing season. The average amount of P fertilizer used by the farmers ranged between 10 kg P to 20 kg P, which is equivalent to ½ a bag to 1 bag (25 kg) of DAP fertilizer per year per household. The farmers used the common band application method, using their hands or plastic bottle caps and placing the amount directly onto the moist soil next to the growing plant. Regarding extension services, about two-thirds (68%) of the farmers confirmed that they had received some application information about the recommended amounts of synthetic fertilizers from agro-dealers, while the others had not. In addition, a one-year study on water quality and monthly trends of the lesser flamingo numbers by Lihepanyama et al. (Citation2022) adds to our understanding of the seasonal use of the lakes by the birds as substantial numbers were observed peaking between January and April ().
Figure 5. Plot showing monthly lesser flamingo trends (Source: Author) and percentage of interviewed local people (%) applying animal manure (natural fertilizer) and chemical fertilizer between May 2020 and April 2021 in the community bordering the Momella lakes, northern Tanzania.
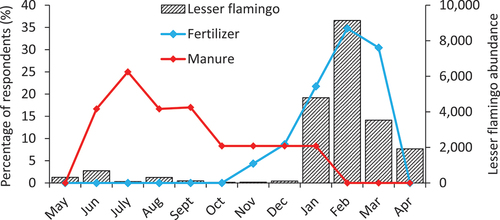
Surprisingly, only half (49%) of the respondents were aware of water and soil pollution due to fertilizer in their farming practices and related that to potential degradation of the water quality for domestic uses and diminishing soil fertility in their farms. However, despite their knowledge of water pollution, they could not relate this to the adjacent Momella lakes, because they perceived the alkaline water in the lakes as ‘dead water’ and, hence, unfit for domestic use. Furthermore, about two-thirds (65%) of the farmers emphasized that synthetic fertilizers must be applied continuously for maximum crop yield. Interestingly, all respondents were aware but less than half of the respondents (43%) expressed a positive attitude towards the presence of lesser flamingos in the lakes. In contrast, 57% of interviewees associated the lesser flamingo presence in the lakes with the outbreak of potential infectious diseases from the wild birds to their poultry, thus exhibiting a negative attitude. They claimed that they experience diseases of their poultry at the same time when lesser flamingos are present at the lakes for foraging.
Discussion
Spatio-temporal trends of LULC between 1989 and 2019
As expected, we found that agriculture with scattered settlements strongly expanded over the last three decades in the study area. This increase resulted in decreased grassland, bushland, and bareland, i.e. land cover classes that are usually less prone to erosion than agricultural land (Alkharabsheh et al., Citation2013; Moisa et al., Citation2021). We claim that this expansion not only puts these unique Momella lakes at risk of pollution but also threatens the continued visits of lesser flamingos to these lakes for foraging. In addition, domestic animals like dogs or livestock moving along the lakes can also disturb lesser flamingo foraging and raise vigilance, which negatively affects the time for feeding (Githaiga, Citation2003). Globally, previous studies indicate that LULC changes can lead to the disappearance of many native plant and animal species as their natural habitats are being converted into agricultural land (Palombo, Citation2021; Scanes, Citation2018). Pollution of water bodies due to agrochemical residues in wastewater and increased concentration of macro and micro-plastics in the region have also been reported (Kundu, Citation2021; Lema et al., Citation2015). Thus, while agriculture has been a major factor that impacts the loss of biodiversity and wildlife habitats (Isenring, Citation2010; Lanz et al., Citation2018), inputs such as fertilizers, pesticides, and farming mechanization to increase yields have put additional challenges on the lesser flamingo foraging locations (Rodríguez-Echeverry et al., Citation2018; Vijay, Citation2018).
Our results are comparable to research on LULC conducted by A. J. Kitalika et al. (Citation2018) on the slopes of Mount Meru and by Kija et al. (Citation2020) and Veldhuis et al. (Citation2019) around the Great Serengeti ecosystem in Tanzania, which found that agriculture and settlements had dramatically increased, posing a challenge to wildlife conservation within the protected areas themselves. Similarly, studies in the Gumara watershed of Lake Tana Basin, Ethiopia, and Wami Basin, Tanzania, also revealed a consistent expansion of agriculture and settlements (Twisa & Buchroithner, Citation2019; Wubie et al., Citation2016). Our findings highlight that intervention strategies are necessary and inevitable to prevent hard boundaries between human-dominated and protected land. We concur with studies that recommend reviewing the rules and regulations governing the surroundings of protected areas to lessen human pressure (Borrini-Feyerabend et al., Citation2012; Said et al., Citation2021).
We propose that the expansion of agriculture and settlements observed in the first decade of our study period might have been triggered by the nationalization of mines, including the Tanzanite mines, located 52 km from Arusha City by the Tanzanian government in the 1990s (Helliesen, Citation2012; Kinyondo & Huggins, Citation2019), which attracted more people in the region. Furthermore, the economic liberalization, coupled with infrastructure investments in the tourism sector in the mid-2000s (Kyara et al., Citation2021; Sokhanvar et al., Citation2018), and the Tanzanian government’s promotion of Arusha town as a city and the hub of northern Tanzania safari circuit in the year 2006 (A. J. Kitalika et al., Citation2018; Okello & Yerian, Citation2009) might reflect the trends in increasing settlement and agriculture we observed in the last two decades. These trends might have impacted lesser flamingos by water degradation, loss of natural vegetation (A. Kitalika, Citation2020; Lema et al., Citation2015), and disturbance while foraging (Githaiga, Citation2003).
Our finding on expanding human populations close to protected areas emphasizes how crucial it is to implement effective land use planning, conservation strategies, and community involvement programs to balance conservation goals with the needs of growing human populations (DeFries et al., Citation2007; Mekonen, Citation2020). Our results confirm a study by Wittemyer et al. (Citation2008), who revealed that average human population growth rates adjacent to 306 Protected Areas (PA) across 45 African and Latin American countries that these PAs were nearly double the average rural population growth. These trends need to be addressed urgently, highlighting the importance of awareness raising and benefit sharing for the local communities around PAs globally (Dawson et al., Citation2021; Kegamba et al., Citation2022).
Our information about the temporal use of the lakes by lesser flamingos only represents a snapshot of these species at the lakes Lihepanyama et al. (Citation2022) and we emphasize the need for long-term data sets that capture local population variation through citizen science programs, e.g. eBirders. While lesser flamingos move seasonally and, thus, can drastically decline locally, as reflected by our research, we highlight the general declining population trends that are of concern (Kittelberger et al., Citation2023; Neate-Clegg et al., Citation2020). Besides, a declining population of Maccoa ducks (Oxyura maccoa) in the Momella lakes and the disappearance of the African lion (Panthera leo) in the surrounding areas of the park as a result of changes in habitat quality due to human activities have been reported (Happiness et al., Citation2009; Martin, Citation2009). Adding to the decline of the global lesser flamingo population (BirdLife, Citation2018; Childress et al., Citation2008), studies indicate that in soda lakes of the Kenyan Rift Valley (Kaggwa et al., Citation2013; Kihwele et al., Citation2014), Abijata-Shalla lakes in Ethiopia (Kumssa & Bekele, Citation2014) and at Kamfers Dam in South Africa (Childress et al., Citation2008; Hill, Citation2013), fluctuations are becoming more prevalent in their local populations. The described reasons for this are related to food contamination and the availability of their preferred diet in the phytoplankton community in their habitats. Due to financial and time limitations, our study only focused on the spatio-temporal LULC shift as well as socio-economic activities by the local human population, and we recommend rigorous monitoring protocols to understand changes in land use, water quality and associated flamingo populations through the ANAPA management.
Socio-economic assessment
Most of our interviewees actively engaged in subsistence crop farming and livestock keeping as their major livelihood income, which is consistent with other studies done in the central and southern highlands of Tanzania (Ngailo et al., Citation2016; Shirima, Citation2005) as well as South Africa (Aliber & Hart, Citation2009; Baiphethi & Jacobs, Citation2009). Thus, we only focused on agricultural activities while other activities such as manufacturing, mining, etc. will put additional pressure on the lakes and their dependent bird species (Githaiga, Citation2003; Kumssa & Bekele, Citation2014). We claim that the current crop farming and livestock-keeping activities around the Momella lakes can become more biodiversity-friendly, without compromising the foraging conditions for the lesser flamingos in the lakes. Reducing synthetic fertilizer use, which most likely contributes to algal blooms (Hird & Baden, Citation2023; Savci, Citation2012; Wurtsbaugh et al., Citation2019) would be a first step for further land use activities recommended by local extension officers in the area.
We focused our research on the last 30 years as information about past land use, i.e. before the 1990s, was limited. Some evidence indicates that around the year 1907, the Momella region, with major portions of the current park, represented a cattle ranch (Martin, Citation2009; URT, Citation2023). The farm was incorporated into the park when the latter was founded in 1960. The Mount Meru area (which forms one of the major attractions in the part) was later added to and placed under the park’s protection in 1967, marking the official establishment of Arusha National Park (URT, Citation2023). There have been several human-wildlife conflicts since the park’s founding as a result of human encroachment (Lwankomezi & Abwe, Citation2016; Newmark et al., Citation1994) and because human activity was forbidden in areas that were customary lands, previously used as common grazing areas (Neumann, Citation1992). These historical land use practices before 1989 might further have influenced the current state of the Lake Momella water quality.
Contrary to our expectation, most farmers could not relate environmental pollution by fertilizers to the adjacent Momella lakes. Yet, research indicates that using fertilizers in crop farming systems located in water catchment areas is of great concern due to the possibility of nutrient pollution in water bodies (Mng’ong’o et al., Citation2021; Savci, Citation2012). Moreover, free grazing on slopes and riparian areas can additionally cause adverse environmental effects, including the degrading of downstream water nutrients and quality (Hughes et al., Citation2016; Vidon et al., Citation2008). We propose that the effect of animal wastes on water contamination in our study may, however, be minimal owing to the small number of livestock and the time of animal manure application, which was mostly done during the dry months.
We claim that March and April, i.e. months with high chemical fertilizer input and high rainfall, could become less problematic if natural manure might be used instead as this application is done in a less run-off-prone period (M. Devlin & Brodie, Citation2023; Zahoor & Mushtaq, Citation2023). Moreover, studies indicate that as plants use only 50% of nitrogenous fertilizers applied to the soil (Hong et al., Citation2007), one would expect water pollution to occur. In comparison, 2–20% is lost through evaporation, 15–25% reacts with organic compounds in the clay soil and the remaining 2–10% mixes with surface and groundwater (Hong et al., Citation2007; Savci, Citation2012). Besides, excessive P fertilizers may saturate the soil leading to increased P loss to the environment and causing serious problems in water bodies (Mng’ong’o et al., Citation2021; Sharpley et al., Citation2001). A study on the effect of P fertilizers on the soil by Liu et al. (Citation2007) in the Hebei Province, China, revealed that excessive P fertilization of crops is strongly related to increased P losses through runoff and leaching and, thus, increased environmental risk. Given the above, we suggest a longer-term analysis to better understand the potential risks of water contamination in the lakes since our study only covered one year.
Awareness and attitude towards pollution and the lesser flamingo presence
As expected, nearly half of the farmers knew that fertilizer use might contaminate water, yet they could not connect it to Momella lakes, despite well-known risks of pollution Berg et al. (Citation2017). Studies indicate that phosphorus (P) and nitrogen (N) in fertilizers may wash into surrounding water bodies if they are applied excessively or during periods of precipitation, leading to eutrophication and consequently algal blooms (Bashir et al., Citation2013; Hua et al., Citation2017). Like D. M. Anderson (Citation2009), we recommend educational programs for farmers on sustainable land use, grazing practices and the use of biodiversity-friendly techniques and timings in applying fertilizers as this might help reduce water pollution.
Our observation of the divergent perspectives of the local community members regarding the presence of lesser flamingos in the lakes highlights the need for educational initiatives to help people become more conscious of, knowledgeable about, and appreciative of natural resources so they can make decisions that will lead to responsible behavior and supportive actions (Barthwal & Mathur, Citation2012; Esa, Citation2010). The perception we saw in locals that diseases coincidentally occur when the lesser flamingos visit for foraging, might show limited knowledge about the spread of diseases, as studies show increased risks of pathogen spillover and diseases from domestic chickens to wildlife birds at the agricultural-wildlife interface (Ayala et al., Citation2020; J. M. Devlin et al., Citation2016). This includes the emergent pathogenic influenza virus (HPAIV) as reported by Wiethoelter et al. (Citation2015), which highlights the need to promote biodiversity conservation educational initiatives about the spread of diseases.
Significance of the findings to wildlife conservation
Our findings contribute to the analysis of threats towards habitat conservation for lesser flamingos and other wildlife species. We claim that a timely assessment of LULC changes, integrated with information from socio-economic aspects and knowledge of how human activities are carried out near protected areas and fragile ecosystems represents an important tool, which is vital for improving strategies that protect wildlife habitats against human pressure. We propose that conservation strategies near protected areas must go beyond the remote detection of changes in human land use but also incorporate programs that support sustainable farming methods and address the root causes of habitat degradation. Creating a buffer zone, a widely used strategy in protected area management to balance conservation objectives with the needs of local communities (Cole et al., Citation2020; Nadhira & Basuni, Citation2021) is critical for reducing human pressure and water contamination. Riparian buffer zones, for instance, have proved to be efficient for nutrient retention and can reduce nutrient fluxes from human-dominated areas to nearby aquatic habitats (Nadhira & Basuni, Citation2021; Walton et al., Citation2020). Our findings emphasize that coordinated and integrated conservation efforts that address the complex interactions between human activities, land use changes, and wildlife conservation are crucial and can be achieved by promoting sustainable land management practices and fostering community involvement in regions where human activities intersect with protected areas.
Conclusions
We conclude that the agriculture and settlements that have considerably expanded over the last three decades surrounding the protected Momella lakes have created a hard boundary for the ANAPA. Further, the socio-economic aspects and agricultural practices of the local human population pose a risk to the existence of the local lesser flamingo population, which ranges between 1.5 and 2.5 million individuals in the East African soda lakes. As human populations grow and the demand for natural resources increases, protected areas face intrusion, leading to habitat destruction, a phenomenon not limited to the Momella lakes but also observed across various ecosystems worldwide. Our findings highlight the need for co-existence initiatives such as education and awareness programs reflecting the global need for promoting sustainable practices in agriculture, land use, and natural resource management. The local decline of the lesser flamingo in the Momella lakes can have cascading effects on other soda lakes used by the species for breeding and foraging such as Lake Natron in Tanzania, and the Kenyan Rift Valley where the local flamingo populations breed. The use of synthetic fertilizers as observed in this study clearly is of global concern as it degrades aquatic habitats and triggers loss of biodiversity. We, therefore, propose that ensuring local communities access to information and resources to adopt environmentally friendly practices is crucial for the long-term conservation of wildlife species and their habitats.
Supplemental Material
Download MS Word (19.1 KB)Supplementary material
Supplemental data for this article can be accessed online at https://doi.org/10.1080/1747423X.2024.2342252
Disclosure statement
No potential conflict of interest was reported by the author(s).
Correction Statement
This article has been republished with minor changes. These changes do not impact the academic content of the article.
Additional information
Funding
References
- Akhtar, N., Syakir Ishak, M. I., Bhawani, S. A., & Umar, K. (2021). Various natural and anthropogenic factors responsible for water quality degradation: A review. Water, 13(19), 2660. https://doi.org/10.3390/w13192660
- Aliber, M., & Hart, T. G. (2009). Should subsistence agriculture be supported as a strategy to address rural food insecurity? Agricultural Economics Research, Policy and Practice in Southern Africa, 48(4), 434–458. https://doi.org/10.1080/03031853.2009.9523835
- Alkharabsheh, M. M., Alexandridis, T., Bilas, G., Misopolinos, N., & Silleos, N. (2013). Impact of land cover change on soil erosion hazard in northern Jordan using remote sensing and GIS. Procedia environmental sciences, 19, 912–921. https://doi.org/10.1016/j.proenv.2013.06.101
- Anderson, D. M. (2009). Approaches to monitoring, control and management of harmful algal blooms (HABs). Ocean & Coastal Management, 52(7), 342–347. https://doi.org/10.1016/j.ocecoaman.2009.04.006
- Anderson, J. R. (1976). A land use and land cover classification system for use with remote sensor data (Vol. 964). US Government Printing Office.
- Ayala, A. J., Yabsley, M. J., & Hernandez, S. M. (2020). A review of pathogen transmission at the backyard chicken–Wild bird interface. Frontiers in Veterinary Science, 7, 539925. https://doi.org/10.3389/fvets.2020.539925
- Baiphethi, M. N., & Jacobs, P. T. (2009). The contribution of subsistence farming to food security in South Africa. Agricultural Economics Research, Policy and Practice in Southern Africa, 48(4), 459–482. https://doi.org/10.1080/03031853.2009.9523836
- Baker, N. E., & Baker, E. (2002). Important bird areas in Tanzania: A first inventory. WCST, Wildlife Conservation Society of Tanzania.
- Barthwal, S. C., & Mathur, V. B. (2012). Teachers’ knowledge of and attitude toward wildlife and conservation. Mountain Research and Development, 32(2), 169–175, 167. https://doi.org/10.1659/MRD-JOURNAL-D-11-00040.1
- Bashir, M. T., Ali, S., Ghauri, M., Adris, A., & Harun, R. (2013). Impact of excessive nitrogen fertilizers on the environment and associated mitigation strategies. Asian Journal Microbiology Biotechnology Environmental Science, 15(2), 213–221. https://doi.org/10.2139/ssrn.3358171
- Bekele, W. B., & Ago, F. Y. (2022). Sample size for interview in qualitative research in social sciences: A guide to novice researchers. Research in Educational Policy and Management, 4(1), 42–50. https://doi.org/10.46303/repam.2022.3
- Berg, M., Meehan, M., & Scherer, T. (2017). Environmental implications of excess fertilizer and manure on water quality. NDSU Extension Service, NM1281, 2. https://www.ndsu.edu/agriculture/sites/default/files/2022-08/nm1281_0.pdf
- Bernard, H. R. (2013). Social research methods: Qualitative and quantitative approaches (2 ed.). Sage.
- BirdLife. (2018). The IUCN red list of threatened species https://doi.org/10.2305/IUCN.UK.2018-2.RLTS.T22697369A129912906.en. Retrieved February 18, 2022.
- Borrini-Feyerabend, G., Johnston, J., & Pansky, D. (2012). Governance of protected areas. In G. Borrini-Feyerabend (Ed.), Managing protected areas (pp. 146–175). Routledge.
- Chen, J., Sun, B.- M., Chen, D., Wu, X., Guo, L.- Z., & Wang, G. (2014). Land use changes and their effects on the value of ecosystem services in the small sanjiang plain in China. Scientific World Journal, https://doi.org/10.1155/2014/752846 2014 1–7
- Chen, L., Wang, J., Fu, B., & Qiu, Y. (2001). Land-use change in a small catchment of northern loess plateau, China. Agriculture, Ecosystems & Environment, 86(2), 163–172. https://doi.org/10.1016/S0167-8809(00)00271-1
- Childress, B., Nagy, S., Hughes, B., & Abebe, Y. (2008). International single species action plan for the conservation of the lesser flamingo (phoeniconaias minor). CMS Technical Series, 18, AEWA Technical Series No. 34, Bonn, Germany. https://www.cms.int/sites/default/files/publication/ts18_ssap_lesser_flamingo_3_0_0.pdf
- Chisanga, K., Mbega, E., & Ndakidemi, P. A. (2019). Socio-economic factors for anthill soil utilization by smallholder farmers in Zambia. Sustainability, 11(18), 4849. https://doi.org/10.3390/su11184849
- Clavel, J., Julliard, R., & Devictor, V. (2011). Worldwide decline of specialist species: Toward a global functional homogenization? Frontiers in Ecology and the Environment, 9(4), 222–228. https://doi.org/10.1890/080216
- Cole, L. J., Stockan, J., & Helliwell, R. (2020). Managing riparian buffer strips to optimise ecosystem services: A review. Agriculture, Ecosystems & Environment, 296, 106891. https://doi.org/10.1016/j.agee.2020.106891
- Dawson, N. M., Coolsaet, B., Sterling, E. J., Loveridge, R., Gross-Camp, N. D., Wongbusarakum, S., Sangha, K. K., Scherl, L. M., Phuong Phan, H., Zafra-Calvo, N., & Lavey, W. G. (2021). The role of Indigenous peoples and local communities in effective and equitable conservation. https://doi.org/10.5751/ES-12625-260319
- DeFries, R., Hansen, A., Turner, B., Reid, R., & Liu, J. (2007). Land use change around protected areas: Management to balance human needs and ecological function. Ecological Applications, 17(4), 1031–1038. https://doi.org/10.1890/05-1111
- Devlin, M., & Brodie, J. (2023). Nutrients and eutrophication. In Marine pollution–monitoring, management and mitigation (pp. 75–100). Springer. https://doi.org/10.1007/978-3-031-10127-4_4
- Devlin, J. M., Vaz, P. K., Coppo, M. J., & Browning, G. F. (2016). Impacts of poultry vaccination on viruses of wild bird. Current Opinion in Virology, 19, 23–29. https://doi.org/10.1016/j.coviro.2016.06.007
- dos Santos, F. S., Johst, K., Huth, A., & Grimm, V. (2010). Interacting effects of habitat destruction and changing disturbance rates on biodiversity: Who is going to survive? Ecological Modelling, 221(23), 2776–2783. https://doi.org/10.1016/j.ecolmodel.2010.08.005
- El-Hattab, M. M. (2015). Change detection and restoration alternatives for the Egyptian lake maryut. The Egyptian Journal of Remote Sensing and Space Science, 18(1), 9–16. https://doi.org/10.1016/j.ejrs.2014.12.001
- Esa, N. (2010). Environmental knowledge, attitude and practices of student teachers. International Research in Geographical & Environmental Education, 19(1), 39–50. https://doi.org/10.1080/10382040903545534
- Felix, N., Kissui, B. M., Munishi, L., Treydte, A. C., & Romanach, S. S. (2022). Retaliatory killing negatively affects African lion (Panthera leo) male coalitions in the Tarangire-Manyara ecosystem, tanzania. PLOS ONE, 17(8), e0272272. https://doi.org/10.1371/journal.pone.0272272
- Foley, J. A., DeFries, R., Asner, G. P., Barford, C., Bonan, G., Carpenter, S. R., Chapin, F. S., Coe, M. T., Daily, G. C., Gibbs, H. K., Helkowski, J. H., Holloway, T., Howard, E. A., Kucharik, C. J., Monfreda, C., Patz, J. A., Prentice, I. C., Ramankutty, N., & Snyder, P. K. (2005). Global Consequences of Land Use. Science, 309(5734), 570–574. https://doi.org/10.1126/science.1111772
- Gao, Y., & Zhang, W. (2009). LULC classification and topographic correction of landsat-7 etm+ imagery in the yangjia river watershed: The influence of DEM resolution. Sensors, 9(3), 1980–1995. https://doi.org/10.3390/s90301980
- Ghiglieri, G., Balia, R., Oggiano, G., & Pittalis, D. (2010). Prospecting for safe (low fluoride) groundwater in the Eastern African Rift: The Arumeru District (Northern Tanzania). Hydrology and Earth System Sciences, 14(6), 1081–1091. doi:10.5194/hess-14-1081-2010
- Githaiga, J. M. (2003). Ecological factors determining utilisation patterns and inter-lake movements of lesser flamingo (Phoenicopterus minor GEOFFROY) in Kenyan alkaline lakes. [ Unpublished PhD thesis]. Department of Zoology, University of Nairobi. Nairobi, Kenya.
- Gong, J., Chen, L., Fu, B., Huang, Y., Huang, Z., & Peng, H. (2006). Effect of land use on soil nutrients in the loess hilly area of the loess plateau, China. Land Degradation & Development, 17(5), 453–465. https://doi.org/10.1002/ldr.701
- Guida-Johnson, B., & Zuleta, G. A. (2013). Land-use land-cover change and ecosystem loss in the espinal ecoregion, Argentina. Agriculture, Ecosystems & Environment, 181, 31–40. https://doi.org/10.1016/j.agee.2013.09.002
- Gusset, M., Swarner, M. J., Mponwane, L., Keletile, K., & McNutt, J. W. (2009). Human–wildlife conflict in northern Botswana: Livestock predation by endangered African wild dog lycaon pictus and other carnivores. Oryx, 43(1), 67–72. https://doi.org/10.1017/S0030605308990475
- Halevi Hochwald, I., Green, G., Sela, Y., Radomyslsky, Z., Nissanholtz‐Gannot, R., & Hochwald, O. (2023). Converting qualitative data into quantitative values using a matched mixed‐methods design: A new methodological approach. Journal of Advanced Nursing, 79(11), 4398–4410. https://doi.org/10.1111/jan.15649
- Happiness, T., Tarimo, M. C., Pantaleo, K., & Munishi, T. (2009). factors affecting maccoa duck oxyura maccoa population dynamics in the momella lakes of arusha national park, TANZANIA. https://nm-aist.academia.edu/HappinessNnko
- Helliesen, M. S. (2012). Tangled up in blue: Tanzanite mining and conflict in mererani, tanzania. Critical African Studies, 4(7), 58–93. https://doi.org/10.1080/21681392.2012.10597799
- Hill, L. Bowerman, W. Roos, J. Bridges, W. Anderson, M. (2013). Effects of water quality changes on phytoplankton and lesser flamingo Phoeniconaias minor populations at Kamfers Dam, a saline wetland near Kimberley, SouthAfrica. African Journal of Aquatic Science 38(3), 287–294. https://doi.org/10.2989/16085914.2013.833889
- Hird, K., & Baden, E. (2023). Reducing harmful algal blooms in Michigan and the great lakes. Journal of Science Policy & Governance, 23(1). https://doi.org/10.38126/JSPG230104
- Hong, N., Scharf, P. C., Davis, J. G., Kitchen, N. R., & Sudduth, K. A. (2007). Economically optimal nitrogen rate reduces soil residual nitrate. Journal of Environmental Quality, 36(2), 354–362. https://doi.org/10.2134/jeq2006.0173
- Horning, N., Robinson, J. A., Sterling, E. J., Spector, S., & Turner, W. (2010). Remote sensing for ecology and conservation: A handbook of techniques. Oxford University Press.
- Hua, L., Liu, J., Zhai, L., Xi, B., Zhang, F., Wang, H., Liu, H., Chen, A., & Fu, B. (2017). Risks of phosphorus runoff losses from five Chinese paddy soils under conventional management practices. Agriculture, Ecosystems & Environment, 245, 112–123. https://doi.org/10.1016/j.agee.2017.05.015
- Hu, Y., Batunacun, Z. L., & Zhuang, D. (2019). Assessment of land-use and land-cover change in Guangxi, China. Scientific Reports, 9(1), 2189. https://doi.org/10.1038/s41598-019-38487-w
- Hughes, A. O., Tanner, C. C., McKergow, L. A., & Sukias, J. P. S. (2016). Unrestricted dairy cattle grazing of a pastoral headwater wetland and its effect on water quality. Agricultural Water Management, 165, 72–81. https://doi.org/10.1016/j.agwat.2015.11.015
- IPCC. (2006). 2006 IPCC Guidelines for national greenhouse gas inventories. In H. S. Eggleston, L. Buendia, K. Miwa, T. Ngara, & K. Tanabe (Eds.), Institute for Global Environmental Strategies, Hayama, Kanagawa, Japan (pp. 1–2). https://www.osti.gov/etdeweb/biblio/20880391.
- Isenring, R. (2010). Pesticides and the loss of biodiversity. Pesticide Action Network Europe, London, 26. https://www.pan-europe.info/old/Campaigns/pesticides/documents/bees/Pesticides_and_the_loss_of_biodiversity.pdf.
- Jansen, L. J., & DiGregorio, A. (2003). Land-use data collection using the “land cover classification system”: Results from a case study in Kenya. Land Use Policy, 20(2), 131–148. https://doi.org/10.1016/S0264-8377(02)00081-9
- Juma, D. W., Wang, H., & Li, F. (2014). Impacts of population growth and economic development on water quality of a lake: Case study of lake Victoria Kenya water. Environmental Science and Pollution Research, 21(8), 5737–5746. https://doi.org/10.1007/s11356-014-2524-5
- Kaggwa, M. N., Gruber, M., Oduor, S. O., & Schagerl, M. (2013). A detailed time series assessment of the diet of lesser flamingos: Further explanation for their itinerant behaviour. Hydrobiologia, 710(1), 83–93. https://doi.org/10.1007/s10750-012-1105-1
- Kayet, N., & Pathak, K. (2015). Remote sensing and GIS based land use/land cover change detection mapping in Saranda forest, Jharkhand, India. International Research Journal Earth Science, 3(10), 1–6. https://www.researchgate.net/publication/298424808
- Kegamba, J. J., Sangha, K. K., Wurm, P., & Garnett, S. T. (2022). A review of conservation-related benefit-sharing mechanisms in Tanzania. Global Ecology and Conservation, 33, e01955. https://doi.org/10.1016/j.gecco.2021.e01955
- Kihwele, E. Howell, K. Lugomela, C. (2014). temporal changes in the lesser flamingos population (phoenicopterus minor) in relation to phytoplankton abundance in lake manyara, tanzania. Open Journal of Ecology, 4, 145–161, 17, Article 43809. https://doi.org/10.4236/oje.2014.43016
- Kija, H. K., Ogutu, J. O., Mangewa, L. J., Bukombe, J., Verones, F., Graae, B. J., Kideghesho, J. R., Said, M. Y., & Nzunda, E. F. (2020). Land use and land cover change within and around the greater Serengeti ecosystem, Tanzania. American Journal of Remote Sensing, 8(1), 1. https://doi.org/10.11648/j.ajrs.20200801.11
- Kinyondo, A., & Huggins, C. (2019). Resource nationalism in Tanzania: Implications for artisanal and small-scale mining. The Extractive Industries and Society, 6(1), 181–189. https://doi.org/10.1016/j.exis.2018.08.005
- Kitalika, A. (2020). Land use change and temporal water quality dynamics on the slopes of Mount Meru [Doctoral Dissertation, NM-AIST]. https://doi.org/10.58694/20.500.12479/1310
- Kitalika, A. J., Machunda, R., Komakech, H. C., & Njau, K. N. (2018). Land-use and land cover changes on the slopes of Mount Meru-Tanzania. Current World Environment, 13(3), 331–352. https://doi.org/10.12944/CWE.13.3.07
- Kittelberger, K. D., Tanner, C. J., Orton, N. D., & Şekercioğlu, Ç. H. (2023). The value of community science data to analyze long-term avian trends in understudied regions: The state of birds in Türkiye. Avian Research, 14, 100140. https://doi.org/10.1016/j.avrs.2023.100140
- Krienitz, L. (2018). The lesser flamingo. In L. Krienitz (Ed.), Lesser flamingos: Descendants of phoenix (pp. 3–18). Springer https://doi.org/10.1007/978-3-662-58163-6_1
- Krienitz, L., Krienitz, D., Dadheech, P. K., Hübener, T., Kotut, K., Luo, W., Teubner, K., & Versfeld, W. D. (2016). Food algae for lesser flamingos: A stocktaking. Hydrobiologia, 775(1), 21–50. https://doi.org/10.1007/s10750-016-2706-x
- Kumssa, T., & Bekele, A. (2014). Current population status and activity pattern of lesser flamingos (phoeniconaias minor) and greater flamingo (Phoenicopterus roseus) in Abijata-Shalla Lakes National Park (ASLNP), Ethiopia. International Journal of Biodiversity, 2014 1–8. https://doi.org/10.1155/2014/295362
- Kundu, M. (2021). Diversity and quantity of macro-and microplastics in irrigation farms sourcing water from an urban river: a case of Arusha Tanzania (Doctoral dissertation). Tanzania: The Nelson Mandela African Institution of Science and Technology. https://doi.org/10.58694/20.500.12479/1649
- Kyara, V. C., Rahman, M. M., & Khanam, R. (2021). Tourism expansion and economic growth in Tanzania: A causality analysis. Heliyon, 7(5), e06966. https://doi.org/10.1016/j.heliyon.2021.e06966
- Lanz, B., Dietz, S., & Swanson, T. (2018). The expansion of modern agriculture and global biodiversity decline: An integrated assessment. Ecological Economics, 144, 260–277. https://doi.org/10.1016/j.ecolecon.2017.07.018
- Lema, E., Machunda, R., & Njau, K. N. (2015). Assessment of agrochemical residues in wastewater from selected horticultural farms in Arusha, Tanzania. International Journal of Environmental Sciences, 6(2), 240–251. https://doi.org/10.6088/ijes.6028
- Lihepanyama, D. L., Ndakidemi, P. A., & Treydte, A. C. (2022). Spatio–temporal water quality determines algal bloom occurrence and possibly lesser flamingo (phoeniconaias minor) presence in momella lakes, Tanzania. Water, 14(21), 3532. https://doi.org/10.3390/w14213532
- Liu, J.- L., Liao, W.- H., Zhang, Z.- X., Zhang, H.- T., Wang, X.- J., & Na, M. (2007). Effect of phopshate fertilizer and manure on crop yield, soil P accumulation, and the environmental risk assessment. Agricultural Sciences in China, 6(9), 1107–1114. https://doi.org/10.1016/S1671-2927(07)60153-9
- Lochmiller, C. R. (2021). Conducting thematic analysis with qualitative data. The Qualitative Report, 26(6), 2029–2044. https://doi.org/10.46743/2160-3715/2021.5008
- Lugomela, C., Pratap, H. B., & Mgaya, Y.D. (2006). Cyanobacteria blooms— A possible cause of mass mortality of lesser flamingos in Lake Manyara and lake big momela, Tanzania. Harmful Algae, 5(5), 534–541. https://doi.org/10.1016/j.hal.2005.10.001
- Lwankomezi, E. B., & Abwe, F. G. (2016). Conservation challenges and human-wildlife conflicts around Arusha National Park, tanzania. https://www.academia.edu/download/47266575/Lwankomezi___Abwe__2016__Human_Wildlife_conflicts_around_Arusha_Park.pdf
- Martin, E. (2009). Understanding the factors responsible for the absence of African lion (Panthera leo) in Arusha National Park, Tanzania. University of Klagenfurt, Austria. https://www.academia.edu/download/36703922/Emanuel_Martin_Thesis_final.pdf
- Marttila, O. (2011). The great savanna: the national parks of Tanzania and other key conservation areas. Auris Publishers.
- Mekonen, S. (2020). Coexistence between human and wildlife: The nature, causes and mitigations of human wildlife conflict around Bale Mountains National Park, Southeast Ethiopia. BMC Ecology, 20(1), 51. https://doi.org/10.1186/s12898-020-00319-1
- Mgimwa, E. F., John, J. R., & Lugomela, C. V. (2021). The influence of physical–chemical variables on phytoplankton and lesser flamingo (phoeniconaias minor) abundances in Lake Natron, Tanzania. African Journal of Ecology. https://doi.org/10.1111/aje.12863 59 (3) 667–675
- Mmassy, E., Maliti, H. T., Nkwabi, A. K., Mwita, M., Mwakatobe, A., Ntalwila, J., Lowassa, A., Mtui, D. T., Liseki, S., & Lesio, N. (2018). Population status and trend of lesser flamingos at Lakes Natron and Manyara, Tanzania. Journal of the IUCN SSC WI Flamingo Specialist Group. https://www.researchgate.net/profile/Emmanuel-Mmassy-4/publication/331894267.
- Mmbaga, N. E., Munishi, L. K., & Treydte, A. C. (2017). How dynamics and drivers of land use/land cover change impact elephant conservation and agricultural livelihood development in rombo, Tanzania. Journal of Land Use Science, 12(2–3), 168–181. https://doi.org/10.1080/1747423X.2017.1313324
- Mng’ong’o, M., Munishi, L. K., & Ndakidemi, P. A. (2021). Characterization of land use influence on soil phosphate bioavailability in usangu agro-ecosystem-Tanzania. Environmental Challenges, 5, 100259. https://doi.org/10.1016/j.envc.2021.100259
- Moisa, M. B., Negash, D. A., Merga, B. B., & Gemeda, D. O. (2021). Impact of land-use and land-cover change on soil erosion using the RUSLE model and the geographic information system: A case of temeji watershed, western Ethiopia. Journal of Water and Climate Change, 12(7), 3404–3420. https://doi.org/10.2166/wcc.2021.131
- Msofe, N. K., Sheng, L., & Lyimo, J. (2019). Land use change trends and their driving forces in the kilombero valley floodplain, Southeastern Tanzania. Sustainability, 11(2), 505. https://doi.org/10.3390/su11020505
- Nadhira, S., & Basuni, S. (2021). Implementation of the concept of conservation area buffer zone in indonesia. Jurnal Manajemen Hutan Tropika, 27(1), 32–32. https://doi.org/10.7226/jtfm.27.1.32
- Neate-Clegg, M. H., Horns, J. J., Adler, F. R., Aytekin, M. Ç. K., & Şekercioğlu, Ç. H. (2020). Monitoring the world’s bird populations with community science data. Biological Conservation, 248, 108653. https://doi.org/10.1016/j.biocon.2020.108653
- Neumann, R. P. (1992). The social origins of natural resource conflict in Arusha National Park, Tanzania. University of California.
- Newmark, W. D., Manyanza, D. N., Gamassa, D. G. M., & Sariko, H. I. (1994). The conflict between wildlife and local people living adjacent to protected areas in Tanzania: Human density as a predictor. Conservation Biology, 8(1), 249–255. https://doi.org/10.1046/j.1523-1739.1994.08010249.x
- Ngailo, J., Mwakasendo, J., Kisandu, D., & Tippe, D. (2016). Rice farming in the Southern Highlands of Tanzania: Management practices, socio-economic roles and production constraints. European Journal Research Social Science, 4. https://www.researchgate.net/publication/317185270.
- Nguyen, P., Shearer, E. J., Tran, H., Ombadi, M., Hayatbini, N., Palacios, T., Huynh, P., Braithwaite, D., Updegraff, G., Hsu, K., Kuligowski, B., Logan, W. S., & Sorooshian, S. (2019). The CHRS data portal, an easily accessible public repository for PERSIANN global satellite precipitation data. Scientific Data, 6(1), 180296. https://doi.org/10.1038/sdata.2018.296
- Nonga, M. R., Lie, E., Sandvik, M., & Skaare, J. (2011). Assessment of farming practices and uses of agrochemicals in Lake Manyara Basin, Tanzania. http://www.suaire.sua.ac.tz/handle/123456789/1381
- Ntukey, L. T., Munishi, L. K., Kohi, E., & Treydte, A. C. (2022). Land use/cover change reduces elephant habitat suitability in the wami mbiki–saadani wildlife corridor, Tanzania. The Land, 11(2), 307. https://www.mdpi.com/2073-445X/11/2/307
- Okello, M. M., & Yerian, S. (2009). Tourist satisfaction in relation to attractions and implications for conservation in the protected areas of the Northern circuit, Tanzania. Journal of Sustainable Tourism, 17(5), 605–625. https://doi.org/10.1080/09669580902928450
- Palinkas, L. A., Horwitz, S. M., Green, C. A., Wisdom, J. P., Duan, N., & Hoagwood, K. (2015). Purposeful sampling for qualitative data collection and analysis in mixed method implementation research. Administration and Policy in Mental Health and Mental Health Services Research, 42(5), 533–544. https://doi.org/10.1007/s10488-013-0528-y
- Pálmai, T., Szabó, B., Kotut, K., Krienitz, L., & Padisák, J. (2020). Ecophysiology of a successful phytoplankton competitor in the African flamingo lakes: The green alga picocystis salinarum (picocystophyceae). Journal of Applied Phycology, 32(3), 1813–1825. https://doi.org/10.1007/s10811-020-02092-6
- Palombo, M. R. (2021). Thinking about the biodiversity loss in this changing world. Geosciences, 11(9), 370. https://doi.org/10.3390/geosciences11090370
- Patel, S. K., Verma, P., & Singh, G. S. (2019). Agricultural growth and land use land cover change in peri-urban India. Environmental Monitoring and Assessment, 191(9), 1–17. https://doi.org/10.1007/s10661-019-7736-1
- Rahman, A., Kumar, S., Fazal, S., & Siddiqui, M. A. (2012). Assessment of land use/land cover change in the North-west district of Delhi using remote sensing and GIS techniques. Journal of the Indian Society of Remote Sensing, 40(4), 689–697. https://doi.org/10.1007/s12524-011-0165-4
- Ramiadantsoa, T., Hanski, I., & Ovaskainen, O. (2018). Responses of generalist and specialist species to fragmented landscapes. Theoretical Population Biology, 124, 31–40. https://doi.org/10.1016/j.tpb.2018.08.001
- Rastogi, R. P., Sinha, R. P., & Incharoensakdi, A. (2014). The cyanotoxin-microcystins: Current overview. Reviews in Environmental Science and Bio/technology, 13(2), 215–249. https://doi.org/10.1007/s11157-014-9334-6
- Rawat, J. S., & Kumar, M. (2015). Monitoring land use/cover change using remote sensing and GIS techniques: A case study of hawalbagh block, district Almora, Uttarakhand, India. The Egyptian Journal of Remote Sensing and Space Science, 18(1), 77–84. https://doi.org/10.1016/j.ejrs.2015.02.002
- Roberts, P., & Priest, H. (2006). Reliability and validity in research. Nursing Standard, 20(44), 41–46. https://doi.org/10.7748/ns.20.36.41.s58
- Rodríguez-Echeverry, J., Echeverría, C., Oyarzún, C., & Morales, L. (2018). Impact of land-use change on biodiversity and ecosystem services in the Chilean temperate forests. Landscape Ecology, 33(3), 439–453. https://doi.org/10.1007/s10980-018-0612-5
- Rwanga, S. S., & Ndambuki, J. M. (2017). Accuracy assessment of land use/land cover classification using remote sensing and GIS. International Journal of Geosciences, 8(4), 611. https://doi.org/10.4236/ijg.2017.84033
- Said, M., Hyandye, C., Komakech, H. C., Mjemah, I. C., & Munishi, L. K. (2021). Predicting land use/cover changes and its association to agricultural production on the slopes of Mount Kilimanjaro, Tanzania. Annals of GIS, 27(2), 189–209. https://doi.org/10.1080/19475683.2020.1871406
- Sanare, J. E., Valli, D., Leweri, C., Glatzer, G., Fishlock, V., & Treydte, A. C. (2022). A socio-ecological approach to understanding how land use challenges human-elephant coexistence in Northern Tanzania. Diversity, 14(7), 513. https://doi.org/10.3390/d14070513
- Sanderson, E. W., Redford, K. H., Vedder, A., Coppolillo, P. B., & Ward, S. E. (2002). A conceptual model for conservation planning based on landscape species requirements. Landscape and Urban Planning, 58(1), 41–56. https://doi.org/10.1016/S0169-2046(01)00231-6
- Sarmah, H., & Hazarika, B. B. (2012). Determination of reliability and validity measures of a questionnaire. Indian Journal of Education and Information Management, 5(11), 508–517.
- Savci, S. (2012). Investigation of effect of chemical fertilizers on environment. APCBEE Procedia, 1, 287–292. https://doi.org/10.1016/j.apcbee.2012.03.047
- Scanes, C. G. (2018). Human activity and habitat loss: Destruction, fragmentation, and degradation. In Animals and human society (pp. 451–482). Elsevier. https://doi.org/10.1016/B978-0-12-805247-1.00026-5
- Scoon, R. N. (2018). Arusha national park (Mount Meru). In Geology of National Parks of Central/Southern Kenya and Northern Tanzania: Geotourism of the Gregory Rift Valley, Active Volcanism and Regional Plateaus (pp. 141–154). Springer International Publishing. https://doi.org/10.1007/978-3-319-73785-0_13.
- Secor, A. J. (2010). Social surveys, interviews, and focus groups. In G. Basil & P. J. John, Research Methods in Geography: A Critical Introduction (Vol. 6, pp. 194–205). https://citeseerx.ist.psu.edu/document?repid=rep1&type=pdf&doi=6f02e095c200516c6530aa197d6aef13bb73fd99#page=216
- Sharpley, A. N., McDowell, R. W., & Kleinman, P. J. A. (2001). Phosphorus loss from land to water: Integrating agricultural and environmental management. Plant and Soil, 237(2), 287–307. https://doi.org/10.1023/A:1013335814593
- Shirima, E. (2005). Benefits from dual purpose goats for crop and livestock production under small-scale peasant systems in Kondoa eroded areas, Tanzania. Livestock Research for Rural Development, 17, Article # 138. https://www.lrrd.cipav.org.co/lrrd17/12/shir17138.htm
- Sokhanvar, A., Çiftçioğlu, S., & Javid, E. (2018). Another look at tourism-economic development nexus. Tourism Management Perspectives, 26, 97–106. https://doi.org/10.1016/j.tmp.2018.03.002
- Suri, H. (2011). Purposeful sampling in qualitative research synthesis. Qualitative Research Journal, 11(2), 63–75. https://doi.org/10.3316/QRJ1102063
- Tahiru Doke, D. A., & Baatuuwie, B. N. (2020). Effect of land use and land cover changes on water quality in the nawuni catchment of the white volta basin, northern region, Ghana. Applied Water Science, 10(8), 1–14. https://doi.org/10.1007/s13201-020-01272-6
- Tiwari, M. K., & Saxena, A. (2011). Change detection of land use/landcover pattern in an around mandideep and obedullaganj area, using remote sensing and GIS. International Journal Technology Engineering System, 2(3), 398–402.
- Tuite, C. H.Tuite. (2000). The distribution and density of Lesser Flamingos in East Africa in relation to food availability and productivity. Waterbirds, 52–63. https://doi.org/10.2307/1522147
- Twisa, S., & Buchroithner, M. F. (2019). Land-use and land-cover (LULC) change detection in Wami River Basin, Tanzania. The Land, 8(9), 136. https://doi.org/10.3390/land8090136
- URT. (2009). Tanzania national parks. https://www.tanzaniaparks.go.tz/
- URT. (2010). Wildlife division. Tanzania national single species action plan for the conservation of lesser flamingo (phoeniconaias minor). Ministry of Natural Resources and Tourism, Dar es Salaam,Tanzania.
- URT. (2013). 2012 Population and housing census: population distribution by administrative areas. Dar es. National Bureau of Statistics. https//www.nbs.go.tz
- URT. (2015). Tanzania Tourism Sector Report 2015: https://www.tanzaniainvest.com/tourism/tanzania-tourism-sector-report.
- URT. (2017). Prime minister’s office regional administration and local government, Meru District Council Socio–economic Profile.
- URT. (2022). The 2022 Population and Housing Census: Administrative Units Population Distribution Report; Tanzania, December. https://www.nbs.go.tz/nbs/takwimu/Census2022/Administrative_units_Population_Distribution_Report_Tanzania_volume1a.pdf
- URT. (2023). Arusha National Park. https://www.arushapark.com/. Retrieved on December, 26.
- Veldhuis, M. P., Ritchie, M. E., Ogutu, J. O., Morrison, T. A., Beale, C. M., Estes, A. B, Ojwang, G. O., Parr, C. L., Probert, J., Wargute, P. W., Hopcraft, G. C., & Olff, H. (2019). The Serengeti squeeze: Cross-boundary human impacts compromise an iconic protected ecosystem. Science, 363(6434), 1424–1428. http://eprints.gla.ac.uk/183914/1/183914.pdf
- Vidon, P., Campbell, M. A., & Gray, M. (2008). Unrestricted cattle access to streams and water quality in till landscape of the midwest. Agricultural Water Management, 95(3), 322–330. https://doi.org/10.1016/j.agwat.2007.10.017
- Vijay, V. (2018). Understanding the impacts of agricultural expansion on biodiversity and habitat loss. [Duke University]. https://hdl.handle.net/10161/16968.
- Walton, C. R., Zak, D., Audet, J., Petersen, R. J., Lange, J., Oehmke, C., Wichtmann, W., Kreyling, J., Grygoruk, M., Jabłońska, E., Kotowski, W., Wiśniewska, M. M., Ziegler, R., & Hoffmann, C. (2020). Wetland buffer zones for nitrogen and phosphorus retention: Impacts of soil type, hydrology and vegetation. Science of the Total Environment, 727, 138709. https://doi.org/10.1016/j.scitotenv.2020.138709
- Wang, M., Duan, L., Wang, J., Peng, J., & Zheng, B. (2020). Determining the width of lake riparian buffer zones for improving water quality base on adjustment of land use structure. Ecological Engineering, 158, 106001. https://doi.org/10.1016/j.ecoleng.2020.106001
- Weng, Q. (2001). A remote sensing?GIS evaluation of urban expansion and its impact on surface temperature in the Zhujiang Delta, China. International Journal of Remote Sensing, 22(10), 1999–2014. https://doi.org/10.1080/01431160118847
- Wiethoelter, A. K., Beltrán-Alcrudo, D., Kock, R., & Mor, S. M. (2015). Global trends in infectious diseases at the wildlife–livestock interface. Proceedings of the National Academy of Sciences, 112(31), 9662–9667. https://doi.org/10.1073/pnas.1422741112
- Wittemyer, G., Elsen, P., Bean, W. T., Burton, A. C. O., & Brashares, J. S. (2008). Accelerated human population growth at protected area edges. Science, 321(5885), 123–126. https://doi.org/10.1126/science.1158900
- Wubie, M. A., Assen, M., & Nicolau, M. D. (2016). Patterns, causes and consequences of land use/cover dynamics in the gumara watershed of lake Tana basin, Northwestern Ethiopia. Environmental Systems Research, 5(1), 8. https://doi.org/10.1186/s40068-016-0058-1
- Wurtsbaugh, W. A., Paerl, H. W., & Dodds, W. K. (2019). Nutrients, eutrophication and harmful algal blooms along the freshwater to marine continuum. Wiley Interdisciplinary Reviews: Water, 6(5), e1373. https://doi.org/10.1002/wat2.1373
- Yanda, P., & Shishira, E. (2001). Forestry conservation and resource utilisation on the southern slopes of mount kilimanjaro: Trends, conflicts and resolutions. Water Resources Management in the Pangani River Basin: Challenges and Opportunities, 104–117. http://repository.costech.or.tz/handle/123456789/9695
- Zahoor, I., & Mushtaq, A. (2023). Water pollution from agricultural activities: A critical global review. International Journal of Chemical and Biochemical Sciences, 23, 164–176. https://www.iscientific.org/wp-content/uploads/2023/05/19-IJCBS-23-23-24.pdf
- Zanchett, G., & Oliveira-Filho, E. C. (2013). Cyanobacteria and Cyanotoxins: From Impacts on Aquatic Ecosystems and Human Health to Anticarcinogenic Effects. Toxins (Basel), 5(10), 1896–1917. https://doi.org/10.3390/toxins5101896
Appendix A
Figure A1. Farms and settlements of the local communities residing on the eastern side of Lake Big Momella, Tanzania (September 2021).
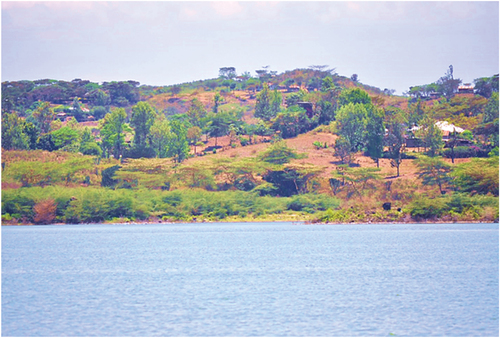
Figure A2. One of the residents captured grazing their livestock on the eastern side of Lake Big Momella shoreline, Tanzania (January 2021).
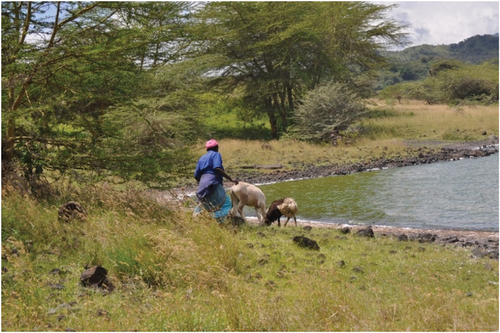
Figure A3. Past, current and projected human population size trend in the Meru District, Tanzania, as projected to 2032 (URT, Citation2013; URT, Citation2022).
Appendix B
Table B1. Area of the different land cover classes (in ha and %) over the years 1989 to 2019 and the annual rate of change (in %/year and ha/year) on the eastern side of the Momella lakes, northern Tanzania.
Table B2. Cross-tabulation of LULC classes between 1989 and 1999 in (ha).
Table B3. Cross-tabulation of LULC classes between 1999 and 2009 in (ha).
Table B4. Cross-tabulation of LULC classes between 2009 and 2019 in (ha).
Figure B1. Average annual rainfall pattern over the past three decades for the Arusha National Park, northern Tanzania, based on rainfall records and rainfall datasets extracted from the Center for Hydrometeorology and Remote Sensing (Nguyen et al., Citation2019). The red bars show the years on which remote sensing images were used.
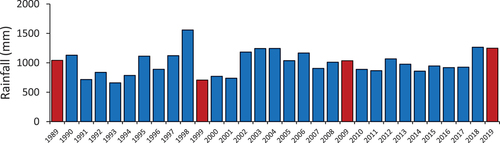
Appendix C
Table C1. Livestock numbers kept by local communities in the study area in Miririny village, northern Tanzania during our survey from February to March 2021. Livestock was kept mainly under free grazing practices. (Number of respondents, N = 31).
Table C2. Common types of fertilizers (frequency and percentages of application) used by local communities in Miririny village, northern Tanzania, supplied by agro-dealers and agrochemical shops revealed by the farmers who applied fertilizers in the study area (Number of respondents, N = 23).