
 ?Mathematical formulae have been encoded as MathML and are displayed in this HTML version using MathJax in order to improve their display. Uncheck the box to turn MathJax off. This feature requires Javascript. Click on a formula to zoom.
ABSTRACT
Understanding the urbanization and transformation trajectories of resource-based cities (RBCs) is pivotal for China’s sustainable development goals. This study introduces a novel regression-based algorithm for assessing urbanization patterns. We delineated the urban boundaries of 335 cities and employed time-series nighttime light data from 2001 to 2020, shifting the analysis from a pixel-scale to an urban-scale perspective. Our analysis reveals distinct disparities within the 125 RBCs when compared to the national average, leading to their categorization. The key findings include: (1) Within Forest and Coal RBCs, numerous areas have stabilized after experiencing contraction. Geographically, a significant number of RBCs in the Northeast, North, and Northwest regions are experiencing or have experienced substantial urban shrinkage. The developmental status of RBCs exhibits a spatial positive correlation. (2) Although the government categorized RBCs based on their development level in 2013, findings suggest that this classification may no longer accurately reflect the current development status of RBCs in the context of urbanization. (3) Utilizing spectral clustering, we categorized RBCs into five types, identified 10 RBCs undergoing shrinkage and 30 cities trending towards stabilization post-shrinkage. This research offers a refined evaluative method for urbanization, providing insights beneficial for policy-making concerning RBCs’ sustainable growth..
1. Introduction
Urbanization represents one of the most significant sociocultural transformations globally, particularly in developing countries (Gu Citation2019). As global urbanization accelerates, it brings challenges like increased resource consumption and environmental changes, posing threats to global sustainability (Perera et al. Citation2023). Resource-based cities (RBCs) are primarily driven by the extraction and processing of natural resources like minerals and forests. Such cities act as crucial strategic reserves for national energy resources, playing an indispensable role in the sustainable and healthy development of the nation’s economy. Benefiting from the vigorous expansion of the resource sector, these cities have experienced rapid growth in municipal infrastructure and economic development. However, these cities often face the resource curse (Douglas and Walker Citation2017; van der Ploeg Citation2011), a phenomenon where reliance on natural resources leads to economic decline, rising unemployment, ecological degradation, and urban shrinkage.
The Chinese government has consistently emphasized the transformative development of RBCs, introducing a series of policies to steer them toward a green and sustainable economic model. In 2001, Fuxin City was designated by the State Council as the pioneering city for economic transformation pilot projects concerning resource depletion, marking the inception of transformations for RBCs. The National Plan for the Sustainable Development of Resource-based Cities (2013–2020), hereafter referred to as the Plan, promulgated in 2013, exerts a profound influence on RBCs. It categorizes RBCs into Mature, Growing, Recessionary, and Regenerating types. This classification plays a pivotal role in the transformation and development of RBCs. At present, in light of the global sustainable development goals, China’s push towards ecological civilization, and dual carbon targets, the transformative development of RBCs has become increasingly urgent.
Presently, the urbanization and transformation of RBCs attract significant scholarly attention globally, with a focus on economic and political implications (Allcott and Keniston Citation2018; Manzano and David Gutierrez Citation2019), policy formulation and responses (Li, Long, and Chen Citation2013; Li et al. Citation2021; Wang et al. Citation2022), and assessments of sustainable development levels (Long et al. Citation2021). The urbanization process of RBCs typically deviates from that of other cities. While understanding the urbanization process, level, and characteristics of RBCs and the relationship between environmental changes and urbanization is crucial for the transformative development of RBCs, macro-level research in this domain remains notably limited.
While some scholars have utilized land use data (Jing et al. Citation2021; Ye et al. Citation2022) or land yearbook data (Song et al. Citation2022) to explore the urbanization of RBCs, these sources are hindered in capturing city shrinkage. Nighttime light (NTL) remote sensing data, indicative of human activity, offers a novel perspective for urbanization studies by strongly correlating with socio-economic factors (Zheng et al. Citation2023) and highlighting urban intensity shifts (Morshed, Chakraborty, and Mazumder Citation2022). Nevertheless, accurately extracting urban development information from this data remains challenging. Some researchers have determined change rates from the total digital number (DN) value of city NTL (Liu and Liu Citation2022; Sun et al. Citation2023) or analyzed trends (Zhou et al. Citation2021) by linear regression (LR) or various temporal characteristics from the total DN value to discern regional development patterns (Dong et al. Citation2021). Such approaches, however, might overlook minute details or neglect differences in pixel changes. Ju et al. (Citation2017) and Yang et al. (Citation2021) have introduced new methods at the pixel scale, enriching the application of NTL data in measuring urbanization. Yet, their choice to focus on city administrative boundaries as the research subject still leaves room for further discussion.
More than a decade has passed since the government last classified RBCs. During this time, governments at all levels in China, along with the academic community, have conducted extensive policy-making and research activities based on this classification, aiming to promote sustainable urban development through comprehensive management. However, whether this classification is still applicable today remains unknown. This study seeks to reevaluate these cities’ classifications from the perspective of the urbanization process. The goal is to provide new insights into the urbanization trajectory of RBCs, thereby facilitating the formulation of more precise and current urban development-aligned policies and plans. This study introduces a novel regression-based algorithm using time series NTL data from 2001 to 2020. This approach transitions urbanization assessment from pixel scale to urban scale, offering greater precision in identifying and categorizing complex urbanization processes within cities, including growth, stability, and shrinkage. This study aims to address the following questions:
Within the actual city boundaries, how can we evaluate and categorize the processes and characteristics of the NTL time series on a pixel-by-pixel basis?
What differences in urbanization processes are observed among RBCs with different locations and primary resources? How do these compare with the national urbanization levels? Whether there is a spatial autocorrelation relationship?
With the Plan’s implementation phase concluding, is its prior categorization still relevant or reflective of current urban development trends?
How can the overall urbanization processes of different RBCs be defined and categorized? What potential trajectories might urban development assume in the future?
2. Data and methods
2.1. Study area
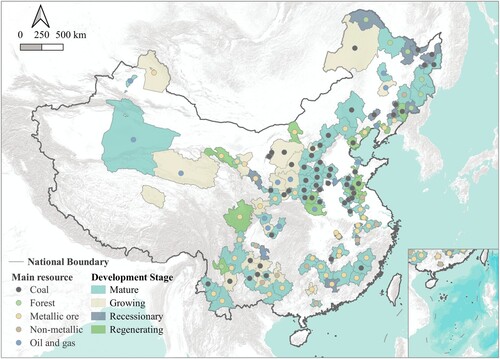
Based on the Plan, China has identified 262 cities of various levels as RBCs, of which 126 are prefecture-level administrative regions (Laiwu city merged with the non-RBC of Jinan in 2019, thus leaving 125 RBCs). RBCs represent about a third of the prefecture-level cities in China (Long et al. Citation2021). Since county-level RBCs have a smaller scale of resource industries and face less pressure for transformation and sustainable development compared to prefecture-level RBCs, and to ensure that our research results can be integrated with policy-making, this study focuses on these 125 RBCs and contrasts them with other prefecture-level non-RBCs for analysis (). According to the Plan, RBCs in China are categorized into Mature RBCs (65 cities), Growing RBCs (20 cities), Recessionary RBCs (24 cities), and Regenerating RBCs (16 cities). Based on the endowed resources (Wu and Bai Citation2022), these cities are further classified into Coal RBCs (56 cities), Forest RBCs (7 cities), Metallic ore RBCs (38 cities), Non-metallic RBCs (9 cities), and Oil and gas RBCs (15 cities).
Figure 1. Distribution of RBCs in China, main resource types, and the Plan’s classification.
2.2. Data sources
2.2.1. Land use and land cover data
Land Use and Land Cover (LULC) data are pivotal in understanding the spatial dynamics and patterns of the Earth’s surfaces and offer critical insights into the interaction between human activities and the environment (Song et al. Citation2023; Turner, Lambin, and Reenberg Citation2007). In urban studies, LULC data serve as indispensable tools in delineating urban extents, measuring urban sprawl, and comprehending the intricacies of urban growth.
The primary source of LULC data for this research was Globeland30 (Chen et al. Citation2015), which provides a comprehensive global LULC dataset at an acceptable spatial resolution of 30 meters. The Globeland30 dataset can be accessed via their official website at http://www.globallandcover.com. It categorizes land cover into ten principal classes: cultivated land, forest, grassland, shrubland, wetland, water bodies, tundra, artificial surfaces, bare land, and perennial snow and ice. According to multiple studies, the overall accuracy of GlobeLand30 exceeds 80% (Arsanjani, See, and Tayyebi Citation2016; Brovelli et al. Citation2015), so it satisfies the prerequisites of our investigation. For this study, we opted for the 2020 Globeland30 dataset specific to the China region to determine the physical delineations of the cities.
2.2.2. NTL data
In the process of urbanization, construction land typically expands consistently, posing challenges in effectively identifying areas of urban shrinkage using LULC data or remote sensing indices like the Building Index. NTL data is widely regarded as reflecting the distribution of human settlements and the dynamic changes in human activities. This study utilizes this data to monitor the urbanization process. The National Geophysical Data Center (NGDC) has released two prominent NTL data: the DMSP/OLS and the NPP/VIIRS datasets. However, these datasets differ in their sensors, spatiotemporal resolutions, and the interpretation of their pixel values. This study employs the EANTLI-Like NTL data from 2000 to 2020, published by Zhong, Yan, and Li (Citation2022), which is derived from the fusion and calibration of annual NTL data from DMSP/OLS and NPP/VIIRS and has undergone outlier processing. This dataset has strong temporal continuity and a high correlation with socio-economic data. Accuracy verification indicates that the dataset is reliable. To enhance our ability to discern and analyze the subtle changes within urban boundaries and ensure alignment with our concurrent projects leveraging MODIS 500 m resolution data for seamless future integration and application, we resampled the NTL data to a 500 m resolution. This resampling was executed using the nearest neighbor interpolation algorithm, which is known for its minimal impact on data distortion (Hong, Hendrickx, and Borchers Citation2009).
2.3. Analytical methods
2.3.1. Extraction of urban boundaries
In China, urban boundaries are often corresponded to administrative boundaries, which include multiple subordinate entities like districts and counties, often extending into large rural areas. The urbanization process in China is characterized by improved urban infrastructure, the expansion of developed areas, and the substantial migration of rural populations to urban centers (Li et al. Citation2020). According to data from the seventh national census, by the end of 2020, the rural population in China had decreased by 297.6 million compared to the year 2000 (Hu et al. Citation2023). Therefore, previous studies that measure urbanization progress by calculating the change in the total NTL within urban administrative boundaries may overlook reduced nighttime lighting in rural areas. According to the methodologies proposed by Imhoff et al. (Citation2010) and Lu and Weng (Citation2006), we employed the land use data to ascertain the physical boundaries using the following steps:
Extract built-up land pixels from the land use data, with the resolution resampled to 100 m to facilitate the analysis.
Implement a moving window approach to compute the percentage of built-up land pixels within a 5 km radius around each pixel, which indicates the construction density intensity for that pixel.
Designate pixels where the construction density intensity exceeds 50% as high-intensity built-up areas. Considering that the building density in suburban areas is lower than in city centers and drawing on the experience of urban boundary delineation in urban heat islands (Zhou et al. Citation2014) and air pollution studies (Li and Huang Citation2020), we applied a 2 km buffer to high-intensity built-up areas, and the area within this buffer is recognized as the physical urban area.
2.3.2. NTL classification algorithm
Traditional methods for analyzing time-series NTL data typically rely on straightforward comparisons of annual changes from start to end time or the application of LR analyses. These conventional approaches assume that changes in urban light intensity unfold uniformly and linearly over time. However, this assumption falls short of capturing the complex realities of urban growth and contraction. Such linear models often overlook the intricacies and nuances of urban development processes, including phases of rapid expansion followed by periods of stabilization or decline. This oversight can lead to a significant underestimation of the dynamic and often non-linear nature of urban changes (Jamali et al. Citation2014), such as processes of growth followed by reduction. Moreover, the task of classifying time-series NTL data to identify specific trends and developmental processes in urban areas presents unique challenges not adequately addressed by standard time-series clustering and classification methods (Aghabozorgi, Seyed Shirkhorshidi, and Ying Wah Citation2015). The difficulties stem from the considerable variability in the magnitude and timing of changes, as well as the diverse range of DN values across different urban pixels. This variability complicates the identification of clear patterns and the accurate quantification of areas undergoing distinct phases of urban development. Given these complexities, the application of both supervised and unsupervised machine learning techniques to NTL data requires careful consideration. The inherent variability and non-linearity in urban development patterns necessitate a more sophisticated analytical approach that can accommodate the multifaceted nature of urban growth and shrinkage. Thus, traditional linear and time-series methods, while useful for certain types of analysis, are not fully equipped to address the nuanced dynamics captured by NTL data in the context of urban development studies.
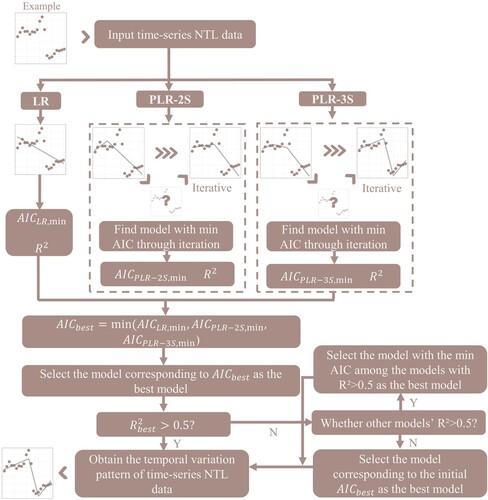
NTL data can reflect the urbanization level of a region. Urbanization is typically a slow and low-volatility process that spans several years (Reba and Seto Citation2020). In light of these considerations, we propose an AIC-Driven Adaptive Integer Piecewise Linear Regression (AAI-PLR) approach to analyze NTL time-series data. Our preliminary analysis began with randomly selecting 1000 pixels of NTL time-series data and visualizing them using line plots. This visualization indicated that fitting with 1–3 segments adequately captures the time-series changes. Given that LR requires sufficient data points for robust and reliable fitting, and considering that urbanization and urban shrinkage are slow processes often aligned with urban planning cycles of five years or more in China (Chen and Shi Citation2022), we stipulate that each segmented fitting must involve at least five data points. We ensured that the nodes for fitting are integer years and used the Akaike Information Criterion (AIC) (Akaike Citation1974) to control the quality of the fitting and prevent overfitting with (coefficient of determination) assisting in controlling the precision of the fit.
(1)
(1) Where n is the number of data points, SSE stands for the Sum of Squared Errors, representing the cumulative squared difference between observed and model-predicted values, and p signifies the number of parameters in the model.
The best-fitting model for the input pixel’s NTL time series data is then selected from three potential models: LR, Piecewise Linear Regression with 2 Segments (PLR-2S), or Piecewise Linear Regression with 3 Segments (PLR-3S). This approach offers a more comprehensive analysis, allowing for non-linear trends and providing segmented insights into urban transformation processes. The analysis also produces outputs for this series, including breakpoint, slope, AIC, and . The schematic of this methodology is illustrated in .
| 1. | LR (No breakpoints):
| ||||
| 2. | PLR-2S (Single Breakpoint Model)
| ||||
| 3. | PLR-3S (Double Breakpoint Model)
| ||||
Figure. 2. Implementation Process of AAI-PLR.
2.3.3. Identifying NTL trend transition nodes
To determine the trend of the NTL within a specified time range, we evaluated the slope, categorizing trends as Decrease (noted as ‘-’ in this study, where slope < −1 DN/y), Constant (‘0’, where −1 ≤ slope ≤ 1 DN/y), and Increase (‘+’, where slope > 1 DN/y). Accordingly, there are up to 39 potential variations in NTL changes: a maximum 3 for the LR model, 9 for the PLR-2S model, and 27 for the PLR-3S model.
One or two Breakpoints may be present for pixels modeled with PLR-2S and PLR-3S. We define a Breakpoint as an NTL Positive Transition Node (PTN) when the trend shifts from ‘-’ to ‘0’, from ‘−’ to ‘+’ or from ‘0’ to ‘+’ and as an NTL Negative Transition Node (NTN) when the trend shifts from ‘+’ to ‘0’, from ‘+’ to ‘−’ or from ‘0’ to ‘−.’ We can gauge the intensity and timing of NTL fluctuations by calculating the proportion of pixels with PTN and NTN for each year to the total pixels in the study area.
2.3.4. Spatial analysis
To reveal the spatial distribution characteristics of different types of pixels across various cities, this study employs both the Global Moran’s I index and the Local Moran’s I index for spatial autocorrelation analysis (Anselin and Syabri Citation2009; Han et al. Citation2022; Moran Citation1950). The Global Moran’s I index assesses the degree of spatial correlation and similarity of attribute values among adjacent cities. Its value ranges from −1 to 1, where a positive value indicates a positive spatial correlation, with higher values signifying stronger correlations. A negative value suggests a negative spatial correlation, with lower values denoting stronger dissimilarities. A zero value implies a random spatial distribution. The Local Moran’s I index measures the local spatial correlation and the differentiation between each city and its neighboring cities. Given that RBCs are not always geographically adjacent, this research adopts a kernel function method to construct the spatial weight matrix, ensuring a more accurate spatial autocorrelation analysis.
(5)
(5)
(6)
(6)
(7)
(7) where
is the total number of cities;
is the measurement value of city
;
is the deviation between the measured value and the average value on the
th city element;
is the standardized spatial weight matrix;
is variance.
2.3.5. Classification of urbanization processes
Although AAI-PLR can also be applied to the fitting analysis of the total DN values of cities on an annual basis, it may not be able to identify the phenomenon of shrinkage. Hence, we introduced a new urban development classification method based on the trends of expansion and contraction areas during urban development. Using AAI-PLR, we can understand the area percentage of pixels with different change characteristics in each city. Subsequently, combined with the spectral clustering method, we use this area percentage as the basis for classification to identify and categorize each city’s development processes and trends.
The optimal number of urban classifications is determined using the Calinski-Harabasz Index (Caliński and Harabasz Citation1974). In our study, we use the proportion of area as an indicator, meaning the sum of different indicators for each city equals one, which implies constraints among the indicators. Traditional clustering methods, such as K-means, which primarily rely on the Euclidean distance between data points, might not fully capture such constraint-laden data’s internal structures and patterns. Spectral clustering (Von Luxburg Citation2007), a graph-based method, initially transforms data into a graph structure and employs the graph’s eigenvalues for clustering. Compared to K-means, spectral clustering can identify non-convex distribution clusters, making it suitable for solving practical problems and offering flexibility and robustness (Jia and Jiao Citation2010). We use spectral clustering methods to ensure a more accurate and meaningful interpretation of diverse urban development patterns.
(8)
(8) Where
represents the number of clusters,
denotes the between-cluster dispersion or variance, capturing the distances between cluster centroids.
signifies the within-cluster dispersion or variance, which describes the distances of data points within a cluster to its centroid.
is the total number of data points.
3. Results
3.1. Results of AAI-PLR fitting
In our analysis, we delineated the physical boundaries of 335 cities at the prefectural level and above, including 125 RBCs. We conducted a comprehensive pixel-by-pixel time series analysis of NTL data from 2001 to 2020 within these urban areas. The results indicated that more than 98.02% of the pixels fitted with the AAI-PLR model had an R2 value of 0.7 or higher, of which 74.91% had an R2 value between 0.9 and 1 ((a)). These outcomes demonstrate the capability of AAI-PLR to accurately depict the change process of most pixels, forming a robust basis for subsequent analyses. Concerning selecting the best-fitting model a significant 84.23% of pixels were fitted using PLR-3S, and 14.28% were fitted using PLR-2S ((b)).
Figure 3. Results of AAI-PLR Fitting. (a) Distribution pie chart of R2 values. (b) The proportions of the three models. (c) Pie chart of NTL change process classification. (d-h) Visualization of five types of NTL change processes and their averages, with (d) ‘+-+’, (e) ‘0++’, (f) ‘+–’, (g) ‘0+’, and (h) ‘-++’.
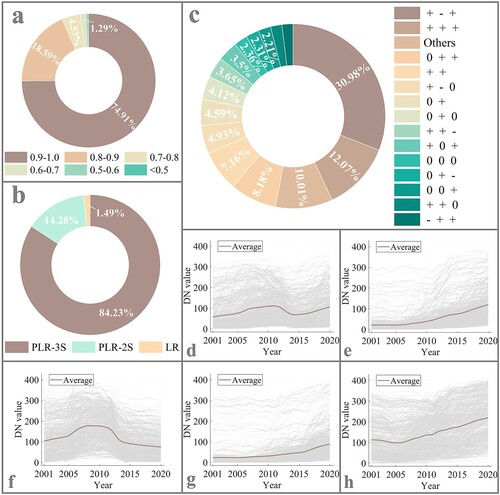
Following the classification principles outlined in section 2.3.3, pixels in the study area were categorized into 39 distinct types ((c)). Time-series NTL identified as ‘+-+’, ‘+++’, ‘0++’, and ‘++’ make up the most significant proportions, all exceeding 5%, while twenty-two types accounted for less than 1% of the total. This finding indicates that urban expansion was the leading trend in Chinese cities during the study period. We selected five categories: ‘+-+’ ((d)), ‘0++’ ((e)), ‘+–’ ((f)), ‘0+’ ((g)), and ‘-++’ ((h)), randomly selected 400 sets of time series from each category, and visualized them along with their averages. The results indicate that this classification strategy performs well.
3.2. NTL macro differences in RBCs under two classification systems
Based on the results of section 3.1, the 39 types of changes are classified into five categories: ‘Currently Rising’, ‘Rise then Stable’, ‘Consistently Stable’, ‘Decline then Stable’, and ‘Currently Declining’, as detailed in . Since this study aims to provide data support for policy-making, the classification scheme focuses more on the current characteristic trends of the NTL time series, as it can represent future development trends to a certain extent while also considering historical changes. This classification method simplifies the complexity of analysis, making the data more intuitive and easier to interpret. By aggregating this data, we gain a comprehensive view of the overall distribution and proportion of these pixel development types on a city scale. This aggregation is instrumental in deepening our understanding of the variations and nuances in the urbanization processes among cities.
Table 1. Classification principles of NTL change processes at pixel scale.
We quantified the area proportion of five types of pixels in different main resource RBCs, as illustrated in (a). The analysis revealed that the area categorized as ‘Currently rising’ in Forest RBCs constituted 42.84%, significantly lower than in other RBC types. Excluding Non-metallic RBCs, the ‘Currently rising’ area proportion was also generally lower in RBCs than in non-RBCs. The ‘Rise then stable’ category, indicative of a temporary completion of urbanization, was only notable in Non-metallic RBCs with a 3.63% proportion, falling below the national average. Forest and Coal RBCs had a ‘Decline then stable’ pixel proportion of 27.73% and 11.27% respectively, far above the national average, suggesting that these cities had a larger area where the decline temporarily ended. Oil and gas RBCs and Metallic ore RBCs have more areas that are ‘currently in decline’. Non-metallic minerals are widely used in industries like electronics and construction. Demand for these resources might remain stable or grow, and such cities are generally in a high development phase. In contrast, other RBCs declined more than the national average, especially Forest RBCs.
Figure 4. Distribution of RBCs proportions for different types under two city classification systems. (a) Categories of RBCs based on main resources. (b) Categories of RBCs by the Plan.
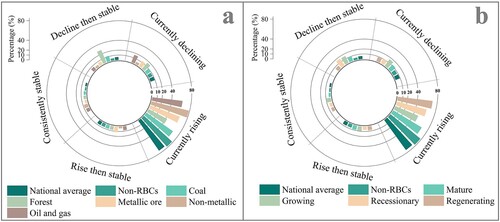
Based on the Plan classification of the development stages of RBCs in 2013, we also quantified the pixel proportion under this classification system. We observed that all development stages of RBCs had higher proportions of ‘Currently declining’, ‘Decline then stable’, and ‘Consistently stable’ pixels than non-RBCs ((b)). The pixel proportions for Regenerating RBCs were closer to the national average, to some extent indicating that these cities have transitioned well. In contrast, the Recessionary RBCs had the highest ‘Decline then stable’ proportion, reaching 16.14%, meaning more pixels have ended their decline. Notably, the Growing RBCs had the highest ‘Currently declining’ proportion and the least ‘Currently rising’, indicating that some cities in the Growing RBCs have reached a developmental bottleneck, the Plan classification may no longer be applicable.
We conducted a statistical analysis to compare the regional proportions of PTN and NTN under two major classification systems. It was observed that both RBCs and non-RBCs exhibited similar trends in the proportion of NTL trend change nodes (PTN and NTN) annually. Between 2008 and 2013, most urban areas in China, particularly Forest RBCs and Mine RBCs, experienced a shift from an increasing to a decreasing NTL DN value trend, with notable fluctuations ((a)). By around 2015, except for Non-metallic and Forest RBCs, the PTN proportion of other cities had peaked. Moreover, the peak time for Forest RBCs, whether in PTN or NTN proportions, was a year earlier than other cities.
Figure 5. Annual variation in the proportion of PTN and NTN. (a) Categories of RBCs based on main resources. (b) Categories of RBCs by the Plan.
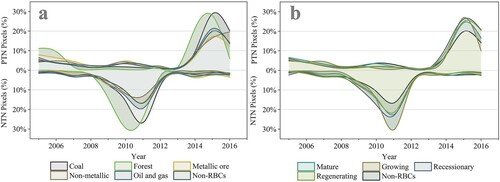
According to the classification by the Plan, the NTN proportion of Growing RBCs was the lowest in 2009 ((b)). However, from then until 2011, this ratio continued to rise, reaching 30.37% in 2011. Notably, whether in PTN or NTN proportions, non-RBCs always showed a lower value, suggesting potential instability in the urbanization process of RBCs.
3.3. Regional spatial pattern analysis of NTL classification
Spatial autocorrelation analysis of the proportion of areas classified according to NTL data reveals significant positive spatial autocorrelation for the categories ‘Currently declining’, ‘Decline then stable’, ‘Consistently stable’, and ‘Currently rising’, with Global Moran’s I indices of 0.242, 0.659, 0.161, and 0.330, respectively. The ‘Decline then stable’ category exhibits the most pronounced correlation among these. However, the ‘Rise then stable’ category exhibits a Global Moran’s I index of merely 0.024 and fails to pass the significance test, suggesting an absence of statistically significant spatial autocorrelation.
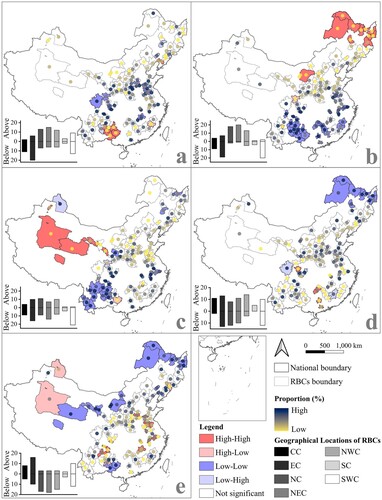
Based on geographical locations, cities in China are categorized into seven regions: Central China (CC), East China (EC), North China (NC), Northeast China (NEC), Northwest China (NWC), South China (SC), and Southwest China (SWC). To examine spatial clustering patterns, we created a Local Indicator of Spatial Association (LISA) map, showcasing clusters including high-high (H-H), low-low (L-L), high-low (H-L), and low-high (L-H). This map reveals distinct spatial autocorrelation characteristics in different regions (), and we counted the number of RBCs in each geographical area above and below the national average, as shown in the bar chart. In the border region between the SC and SWC, cities like Qiannan and Anshun are exhibiting a ‘Currently declining’ trend that significantly surpasses the national average, forming a H-H cluster as shown in (a). In northern China, most RBCs show a higher proportion of ‘Currently declining’ and ‘Decline then stable’ categories than the national average ((a and b)). Particularly in the NEC, of the 21 RBCs, only Panjin has a ‘Decline then stable’ ratio slightly below the national level. Cities like Daxinganling, Yichun, Shuangyashan, and Hegang have nearly half or more of their areas in the ‘Decline then stable’ category, creating a H-H cluster, indicating that a substantial portion of the urban areas in NEC has undergone shrinkage. In the CC, NWC, and SC, many RBCs have a ‘Rise then stable’ proportion above the national average ((d)), with Longnan city in the northwest notably having 47.86% of its areas in this category, suggesting that nearly half of the city has completed its urbanization process and has temporarily ceased expanding. In the EC and CC regions, over half of the RBCs have a ‘Currently rising’ ratio above the average, forming a H-H cluster ((e)). Interestingly, Jingdezhen, defined as a Recessionary RBC in the Plan had a pixel proportion for this category exceeding 90%, suggesting that the city has undergone a successful transformation in its development.
Figure 6. Geospatial distribution of NTL classification proportions in different cities, LISA mapping and comparison with the national average. (a) Currently declining. (b) Decline then stable. (c) Consistently stable. (d) Rise then stable. (e) Currently rising.
3.4. Classification of RBCs’ development status
The spatial pattern analysis in section 3.3 offered an intuitive understanding of the distribution of NTL pixel classification across cities. This section employed machine learning techniques for in-depth analysis to classify the RBCs qualitatively. Using the Calinski-Harabasz index to evaluate the optimal number of development status classifications, we employed the spectral clustering method to categorize 335 cities into five distinct types. We presented a bar chart ((a)) that displays the average proportions of the five-pixel types for each city category, illustrating the specific differences in urbanization statuses. We categorized cities into five urbanization stages using the differences in pixel-type proportions. These five categories include ‘Rapid expanding’ (undergoing swift urbanization), ‘Moderate expanding’ (undergoing steady urbanization), ‘Expanding with stable’ (cities growing but with a significant proportion of pixels remaining stable), ‘Mostly stable after shrinking’ (most areas of these cities have become stable after experiencing contraction), and ‘Predominantly shrinking’ (cities in the contraction phase). China’s shift from high-speed growth to high-quality development in the present day, coupled with recent slowdowns or even declines in population growth, suggests that these five classifications could represent the significant future developmental patterns of Chinese cities.
Figure 7. Number statistics and geographical distribution of RBCs in different stages of development. (a) The proportions of different pixel areas under the new classification system. (b) Comparison of the number of RBCs in different stages of development with non-RBCs. (c) Distribution of RBCs in different stages of city development.
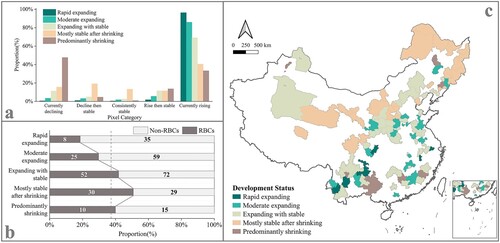
As depicted in (b and c), there are 10 RBCs classified as ‘Predominantly Shrinking’, including Daqing, Qiannan, and Fushun, scattered across different regions. Thirty cities fall under ‘Mostly stable after shrinking’, constituting over half of the cities in this category nationally, which implies that certain cities have reached equilibrium after the decline caused by resource exhaustion. This stability has both positive implications – signifying recovery after adjustments – and underscores the long-term effects after resource exhaustion, necessitating comprehensive planning and resource management. In the ‘Rapid Expanding’ category, 43 cities are identified nationwide, with only eight being RBCs, and all are located in Southern China, including Chuxiong, Jingdezhen, Huzhou, and Luzhou. The ‘Expanding with Stable’ category comprises 52 RBCs, which may grapple with resource or planning challenges, necessitating a careful balance between urbanization and resource exploitation.
4. Discussion
4.1. Comparative methodology
This research diverges from conventional studies that utilize NTL data to identify urbanization by introducing a novel approach to categorizing dynamic urban trends. This innovation enhances multi-scale analysis capabilities in urbanization studies. By transitioning from pixel to urban scales, our methodology does not just identify primary urbanization trends – contraction, expansion, and stability – but also intricately captures the transitional sequences among these states. Moreover, the AAI-PLR model proposed in this study effectively identifies pixel trends over recent years and offers predictive insights into future urban developments.
Observations from other works, which harness statistical yearbooks or nocturnal luminosity for urbanization recognition, corroborate our findings. For instance, He, Song, and Chen (Citation2023) utilized NTL data, deploying a three-year interval, to examine contraction trends in China’s RBCs. Notably, he discerned that cities within the Coal and Forest RBCs experienced the most pronounced contraction, a finding the same as ours. Yang et al. (Citation2021) defined the ‘urban shrinkage intensity index’ and identified the phenomenon of urban shrinkage in Chinese. He discovered that urban shrinkage in China was more severe from 2008 to 2013 than in other periods, which aligns with the findings in section 3.2 of this study. This phenomenon may be related to the global financial crisis that began sweeping in 2008. He et al. (Citation2017) grounded their research in government statistical yearbooks and, through historical reviews, deduced reasons behind Daqing’s decline as a Mature RBC and Pingxiang’s successful transition from a recessionary state, which in our research were categorized as ‘Predominantly shrinking’ and ‘Moderate expanding’, respectively.
However, discrepancies have arisen in comparison with certain research conclusions (Meng and Long Citation2022; Yang et al. Citation2022), particularly the identification of city contraction. One of the main reasons for these differences is the absence of a universally precise definition for ‘shrinking cities’ (Hartt Citation2018). While population outflux is a pivotal characteristic of urban contraction (Rieniets Citation2009), contemporary urban development in China bears unique nuances. Over the last three decades, urbanization has spread across various regions, with the primary demographic shift being from rural to urban areas and from less-developed to more-developed regions. Considering that the definition of urban boundaries in China often includes extensive rural areas, relying solely on population statistics or overall nighttime luminosity may not yield accurate measures of urban expansion or contraction. Consequently, we initiated by demarcating actual urban boundaries and gauging the development ratio of different NTL pixels, offering a fresh angle to depict the urbanization narrative.
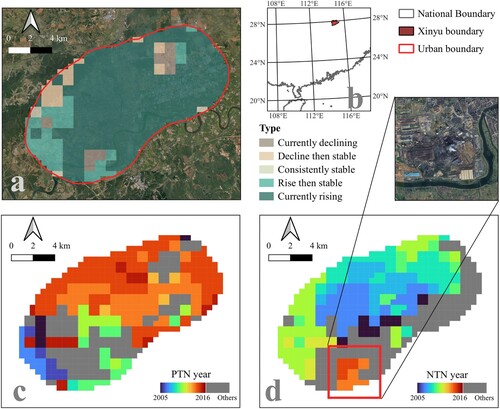
Our method can observe the locations and timings of urban contraction and expansion on a pixel scale. This capability could be demonstrated through a case study of Xinyu City, highlighting our method’s extensibility with visualizations of the years of PTN and NTN (). Xinyu City, located in Jiangxi Province, Eastern China, evolved into a city due to its steel industry and is classified as a Recessionary RBC by the Plan. According to the General Land Use Plan of Xinyu City, urban development is directed towards the east and north, consistent with our findings in (c), which show that these regions have started to prosper since 2014. (d) reveals a trend of shrinkage or stabilization in the city’s southwestern sector in recent years, a hub for the steel industry, likely related to resource depletion. According to the Development Plan for Transitioning Resource-Depleted Cities initiated in 2013, Xinyu aims to gradually increase the proportion of the workforce in non-resource industries, focusing on the deployment of emerging industries such as photovoltaics to reduce its dependency on traditional resources progressively. Our research identifies the city’s main development direction as northeast, with most areas in the west and south remaining stable and ultimately, Xinyu is characterized as ‘Expanding with Stable’, aligning with the city’s real development trajectory.
Figure 8. Visualizing the urban development process of Xinyu. (a) Spatial distribution of different NTL categories in Xinyu. (b) The location of Xinyu in China. (c) The time and location of PTN. (d) The time and location of NTN.
4.2. Is the urban development categorization as defined by the Plan still relevant?
Since its commencement in 2013, the Plan has substantially directed the growth trajectory of China’s RBCs, yielding commendable outcomes by 2020 (Yang et al. Citation2023). The Plan, formulated over a decade ago, was predicated on the resource assurance capacity and the construction status of cities at that time. Its primary aim was to classify RBCs to delineate clear development directions and key tasks for different city categories. However, the intervening years have witnessed profound changes in urbanization patterns across China, driven by the non-renewable nature of resources and significant shifts in economic bases and urban functions. These transformations have often outpaced the expectations set out by the Plan, leading to discrepancies between the prescribed urban categories and the current realities of urban development.
The Plan expired in 2020, and as of now, there is no national-level plan for the sustainable development and categorization of RBCs. Within this study’s ‘Predominant shrinking’ category, 8 out of 10 cities were previously categorized as Growing RBCs under the Plan. Such disparities accentuate a misalignment between some of the Plan’s’ categorizations and the present realities. Although intricate facets like resource production variations and potential resource exhaustion must be meticulously considered when determining RBCs’ development phases, the Plan’s categorizations undeniably warrant revision from the standpoint of urbanization progression.
Furthermore, our analysis in section 3.3 unveiled a notable discovery: the patterns of urban growth and shrinkage across various RBCs are not randomly distributed but exhibit significant spatial correlations. This finding suggests that regional factors influence the developmental trajectories of these cities and that these trajectories, in turn, contribute to the broader regional dynamics of urbanization. Given this interconnectedness, it is imperative for future policy-makers to adopt a holistic perspective that takes into account the regional imbalances and spatial dependencies among RBCs. To effectively address these challenges and leverage opportunities for balanced regional development, policies must be crafted with a nuanced understanding of these spatial correlations. This approach will ensure that interventions are not only tailored to the specific needs of individual cities but also contribute to harmonizing development across regions, mitigating disparities, and fostering a more equitable and sustainable urbanization process. Therefore, we strongly advocate for policy formulations to be grounded in a comprehensive spatial analysis, ensuring that regional imbalances and the interconnected nature of urban growth and shrinkage are fully integrated into the decision-making process.
4.3. The degree of resource dependence of RBCs and sustainable development
Typically, RBCs deeply rely on resource extraction and achieving sustainable development requires a harmonious balance between urbanization processes and resource dependency. In such cities, mining (or forestry) and manufacturing usually occupy the most significant proportion of the urban industrial structure (Liu Citation2009). Therefore, the ratio of employment numbers in these two industries (Equation 9) can be used to characterize the city’s fundamental economic activities’ dependency on resource extraction. The higher the K value (Resource-Manufacturing Relative Strength Index), the deeper the city’s dependency on resources. The China City Statistical Yearbook provides industrial employment data for prefecture-level cities. As the data collection ceased in 2020, we have chosen 2019 as the baseline, ultimately obtaining the industrial employment numbers of 115 RBCs, excluding autonomous prefectures. Cities with (the national average) are considered to have weak resource dependency and a developed manufacturing sector; cities with
are moderately resource-dependent, primarily focusing on processed resource goods or manufactured products; cities with
are strongly dependent on the resource industry, with their economies heavily reliant on resource extraction (Yan and Hu Citation2019).
(9)
(9) Where
represents the Resource-Manufacturing Relative Strength Index of the
th city;
is the number of employees in the mining (or forestry) industry in the
th city;
is the number of employees in the manufacturing industry in the
th city.
Our analysis shows 37 cities as strongly resource-dependent and 43 as moderately resource-dependent. Despite decoupling from resource extraction, we discovered that cities like Baise, Jilin, Shizuishan, and Jinchang are in a phase of shrinkage or post-shrinkage stability, urgently seeking paths for transformational development. Besides these four cities, the rest of the ‘Predominantly Shrinking’ and ‘Mostly Stable After Shrinking’ cities exhibit strong or moderate dependency on resources. When cities begin to shrink or have shrunk, their industrial structures remain linked to limited resource extraction, contrary to sustainable development principles.
The nation should reassess and reposition different RBCs, conducting detailed classification and planning according to their location and resource characteristics, laying a solid foundation from top to bottom for China’s green and sustainable development. The findings of this paper can provide rich details for macro-level decision-making, formulating different sustainable development strategies based on the varying urbanization statuses and states of dependency on resource production. For cities that are still urbanizing and dependent on resource industries, governments are advised to focus more on green resource extraction and balancing resource supply with environmental protection. Concurrently, enhancing urban infrastructure construction and exploring the development of other pillar industries are recommended to prepare for economic transformation post-resource depletion. For ‘Predominantly Shrinking’ and ‘Mostly Stable After Shrinking’ cities still dependent on resource industries, administrators should swiftly improve protective policies and perfect the exit mechanisms for resource enterprises. Efforts should be made to integrate traditional resource industries with modern technology, create a green, low-carbon circular economy, and gradually remove traditional resource dependency. For cities gradually decoupling from resources but still experiencing significant shrinkage, it’s advisable to leverage their lower land costs and relaxed environmental policies to attract more small and micro-enterprises, fully utilizing the industrial sites left by the resource industry and developing service industries like industrial tourism.
4.4. Scalability, applicability, and limitations of the study
From the relative stability of yearly NTL data and its limited 20-year span, AAI-PLR demonstrates commendable applicability in the study area. Theoretically, this approach can be extrapolated to evaluate urbanization trends across different global regions, especially in areas undergoing significant urban transformations. Furthermore, it can be adapted to annual NDVI remote sensing data or other statistical sets with similar temporal patterns.
This study primarily measured the urbanization processes of RBCs from a macro perspective. The scope of the research and its focus on an extremely high number of cities resulted in specific constraints to make it possible, which determined particular limitations. For one, it didn’t employ higher-resolution NTL datasets to allow for analysis and comparison between a high number of cities. Secondly, the study did not incorporate actual economic data as a supplementary reference, which may lead to biases in classifying urban development states. While we’ve instituted a threshold requiring at least five years of data for reliable fitting, this could inadvertently overlook genuine inflection points. In the future, we will analyze the applicability of the AAI-PLR algorithm to NTL data of different resolutions. We will attempt to expand the relevance of this method, using it to study the direction, intensity, and reasons for the expansion and contraction of typical cities.
5. Conclusion
In this study, we introduced the AAI-PLR model, a novel tool for pixel-level identification of NTL trajectory characteristics, which serves as a foundation for classifying urbanization processes. By delineating urban physical boundaries coupled with the area proportion of diverse NTL types across cities, we deployed spectral clustering to categorize the urbanization statuses of China’s RBCs. Our findings include: (1) The AAI-PLR model demonstrates positive performance in capturing the nuances of NTL changes at the pixel level; (2) RBCs, when compared to the national level, exhibit a higher number of regions where NTL is decreasing or has transitioned from declining to stable. The development patterns of RBCs vary considerably, depending on their primary resource types. Notably, a clear trend of decline is evident in Forest RBCs. While the overall NTL change trend in RBCs is akin to non-RBCs, the urbanization process in RBCs appears less stable; (3) Geographically, southern Chinese RBCs demonstrate a more robust urbanization level, whereas numerous RBCs in the northeast are either contracting or on the verge of doing so; Particularly, the ‘Decline then stable’ pixel category demonstrates a distinct positive spatial autocorrelation regarding its share among various cities, signifying a noticeable tendency for similar proportions to be geographically clustered. (4) Segmenting RBCs into five distinct categories revealed that 10 RBCs are undergoing shrink, and 30 cities are classified as ‘Mostly stable after shrinking’. The 2013 classification of RBCs by the Chinese government no longer accurately reflects their current urbanization trajectories.
Compared to traditional methods of exploring urbanization processes using NTL data, our study offers an innovative perspective. We have overcome the limitations of merely analyzing the total value of NTL in a region to measure urbanization intensity and have developed the capability to identify changes at both the pixel and city scales. This method is especially relevant for areas like China, with uneven development and varying timelines. Our study not only delineates the urbanization process of RBCs but also offers a novel framework for identifying and analyzing urban shrinkage, enabling a nuanced reclassification of RBCs based on their current developmental realities. This reclassification provides a critical reference for policy-makers and national departments, guiding the strategic realignment of sustainable development initiatives for RBCs. Utilizing the pixel-based AAI-PLR model, our approach pinpoints specific areas within cities experiencing shrinkage and quantifies these trends, thereby furnishing urban managers with a powerful tool to tailor transformation and development strategies effectively. Moreover, recognizing the global universal challenges faced by resource-based urban areas, we are committed to further refining our methodology. We aim to extend its applicability beyond China, exploring how these insights can inform sustainable urban development strategies in other countries and regions. By doing so, we aspire to contribute to the global discourse on urban management and planning, providing a replicable model for addressing the complexities of urban shrinkage and regeneration in RBCs worldwide.
Author statement
Jiazheng Han: Data curation, Writing-original draft, Formal analysis. Zhenqi Hu: Conceptualization, Supervision, Funding acquisition. Payam Sajadi: Review & Editing, Supervision. Shijin Li: Review & Editing, Data curation; Yuhang Zhang: Data curation, Visualization. Ruihao Cui: Visualization. Francesco Pilla: Supervision, Funding acquisition, Editing.
Acknowledgements
The authors are sincerely grateful to the editors as well as the anonymous reviewers for their valuable suggestions and comments that helped us improve the quality of this paper significantly.
Disclosure statement
No potential conflict of interest was reported by the author(s).
Data availability statement
The data that support the findings of this study are available from the corresponding author(s) upon reasonable request.
Additional information
Funding
References
- Aghabozorgi, S., A. Seyed Shirkhorshidi, and T. Ying Wah. 2015. “Time-series Clustering – a Decade Review.” Information Systems 53:16–38. https://doi.org/10.1016/j.is.2015.04.007.
- Akaike, H. 1974. “A New Look at the Statistical Model Identification.” IEEE Transactions On Automatic Control 19 (6): 716–723. https://doi.org/10.1109/TAC.1974.1100705.
- Allcott, H., and D. Keniston. 2018. “Dutch Disease or Agglomeration? The Local Economic Effects of Natural Resource Booms in Modern America.” Review of Economic Studies 85 (2): 695–731. https://doi.org/10.1093/restud/rdx042.
- Anselin, L., and I. Syabri. 2009. “Geoda: An Introduction to Spatial Data Analysis.”
- Arsanjani, J., L. See, and A. Tayyebi. 2016. “Assessing the Suitability of globeland30 for Mapping Land Cover in Germany.” International Journal of Digital Earth 9 (9): 873–891. https://doi.org/10.1080/17538947.2016.1151956.
- Brovelli, M., M. Molinari, E. Hussein, J. Chen, and R. Li. 2015. “The First Comprehensive Accuracy Assessment of globeland30 at a National Level: Methodology and Results.” Remote Sensing 7 (4): 4191–4212. https://doi.org/10.3390/rs70404191.
- Caliński, T., and J. Harabasz. 1974. “A Dendrite Method for Cluster Analysis.” Communications in Statistics-Theory and Methods 3 (1): 1–27. https://doi.org/10.1080/03610927408827101.
- Chen, J., J. Chen, A. Liao, X. Cao, L. Chen, X. Chen, C. He, et al. 2015. “Global Land Cover Mapping at 30 m Resolution: A Pok-based Operational Approach.” ISPRS Journal of Photogrammetry and Remote Sensing 103:7–27. https://doi.org/10.1016/j.isprsjprs.2014.09.002.
- Chen, P., and X. Shi. 2022. “Dynamic Evaluation of China’s Ecological Civilization Construction Based on Target Correlation Degree and Coupling Coordination Degree.” Environmental Impact Assessment Review 93:106734. https://doi.org/10.1016/j.eiar.2021.106734.
- Dong, B., Y. Ye, S. You, Q. Zheng, L. Huang, C. Zhu, C. Tong, S. Li, Y. Li, and K. Wang. 2021. “Identifying and Classifying Shrinking Cities Using Long-term Continuous Night-time Light Time Series.” Remote Sensing 13 (16): 3142. https://doi.org/10.3390/rs13163142.
- Douglas, S., and A. Walker. 2017. “Coal Mining and the Resource Curse in the Eastern United States.” Journal of Regional Science 57 (4): 568–590. https://doi.org/10.1111/jors.12310.
- Gu, C. 2019. “Urbanization: Processes and Driving Forces.” Science China-Earth Sciences 62 (9): 1351–1360. https://doi.org/10.1007/s11430-018-9359-y.
- Han, J., Z. Hu, Z. Mao, G. Li, S. Liu, D. Yuan, and J. Guo. 2022. “How to Account for Changes in Carbon Storage from Coal Mining and Reclamation in Eastern China? Taking Yanzhou Coalfield as an Example to Simulate and Estimate.” Remote Sensing 14 (9): 2014. https://doi.org/10.3390/rs14092014.
- Hartt, M. 2018. “The Diversity of North American Shrinking Cities.” Urban Studies 55 (13): 2946–2959. https://doi.org/10.1177/0042098017730013.
- He, S. Y., J. Lee, T. Zhou, and D. Wu. 2017. “Shrinking Cities and Resource-based Economy: The Economic Restructuring in China’s Mining Cities.” Cities 60:75–83. doi:https://doi.org/10.1016/j.cities.2016.07.009.
- He, T., H. Song, and W. Chen. 2023. “Recognizing the Transformation Characteristics of Resource-based Cities Using Night-time Light Remote Sensing Data: Evidence from 126 Cities in China.” Resources Policy 85:104013. https://doi.org/10.1016/j.resourpol.2023.104013.
- Hong, S., J. M. H. Hendrickx, and B. Borchers. 2009. “Up-scaling of Sebal Derived Evapotranspiration Maps from Landsat (30 m) to Modis (250 m) Scale.” Journal of Hydrology 370 (1–4): 122–138. https://doi.org/10.1016/j.jhydrol.2009.03.002.
- Hu, Z., Y. Li, H. Long, and C. Kang. 2023. “The Evolution of China’s Rural Depopulation Pattern and its Influencing Factors from 2000 to 2020.” Applied Geography 159:103089. https://doi.org/10.1016/j.apgeog.2023.103089.
- Imhoff, M. L., P. Zhang, R. E. Wolfe, and L. Bounoua. 2010. “Remote Sensing of the Urban Heat Island Effect Across Biomes in the Continental USA.” Remote Sensing of Environment 114 (3): 504–513. https://doi.org/10.1016/j.rse.2009.10.008.
- Jamali, S., J. Seaquist, L. Eldundh, and J. Ardo. 2014. “Automated Mapping of Vegetation Trends with Polynomials Using NDVI Imagery Over the Sahel.” Remote Sensing of Environment 141:79–89. https://doi.org/10.1016/j.rse.2013.10.019.
- Jia, J., and L. Jiao. 2010. “Image Segmentation by Spectral Clustering Algorithm with Spatial Coherence Constraints.” Journal of Infrared and Millimeter Waves 29 (1): 69–74. https://doi.org/10.3724/SP.J.1010.2010.00069.
- Jing, Z., J. Wang, Q. Tang, B. Liu, and H. Niu. 2021. “Evolution of Land use in Coal-based Cities Based on the Ecological Niche Theory: A Case Study in Shuozhou City, China.” Resources Policy 74:102245. https://doi.org/10.1016/j.resourpol.2021.102245.
- Ju, Y., I. Dronova, Q. Ma, and X. Zhang. 2017. “Analysis of Urbanization Dynamics in Mainland China Using Pixel-based Night-time Light Trajectories from 1992 to 2013.” International Journal of Remote Sensing 38 (21): 6047–6072. https://doi.org/10.1080/01431161.2017.1302114.
- Li, J., and X. Huang. 2020. “Impact of Land-cover Layout on Particulate Matter 2.5 in Urban Areas of China.” International Journal of Digital Earth 13 (4): 474–486. https://doi.org/10.1080/17538947.2018.1530310.
- Li, L., X. Li, B. Hai, X. Wang, and J. Xu. 2020. “Evolution of Rural Settlement in an Inland Nonmetropolitan Region of China at a Time of Rapid Urbanization: The Case of Gongyi.” Journal of Rural Studies 79:45–56. https://doi.org/10.1016/j.jrurstud.2020.08.003.
- Li, H., R. Long, and H. Chen. 2013. “Economic Transition Policies in Chinese Resource-based Cities: An Overview of Government Efforts.” Energy Policy 55:251–260. https://doi.org/10.1016/j.enpol.2012.12.007.
- Li, Q., F. Zeng, S. Liu, M. Yang, and F. Xu. 2021. “The Effects of China’s Sustainable Development Policy for Resource-based Cities on Local Industrial Transformation.” Resources Policy 71:101940. https://doi.org/10.1016/j.resourpol.2020.101940.
- Liu, Y. 2009. “The Functional Classification and the Characteristics of Functional Transition of Chinese Resource-based Cities.” Geographical Research 28 (1): 153–160. https://doi.org/10.1016/S1874-8651(10)60080-4.
- Liu, Z., and S. Liu. 2022. “Urban Shrinkage in a Developing Context: Rethinking China’s Present and Future Trends.” Sustainable Cities and Society 80:103779. https://doi.org/10.1016/j.scs.2022.103779.
- Long, R., H. Li, M. Wu, and W. Li. 2021. “Dynamic Evaluation of the Green Development Level of China’s Coal-resource-based Cities Using the Topsis Method.” Resources Policy 74:102415. https://doi.org/10.1016/j.resourpol.2021.102415.
- Lu, D., and Q. Weng. 2006. “Use of Impervious Surface in Urban Land-use Classification.” Remote Sensing of Environment 102 (1–2): 146–160. doi:https://doi.org/10.1016/j.rse.2006.02.010.
- Manzano, O., and J. David Gutierrez. 2019. “The Subnational Resource Curse: Theory and Evidence.” Extractive Industries and Society 6 (2): 261–266. https://doi.org/10.1016/j.exis.2019.03.010.
- Meng, X., and Y. Long. 2022. “Shrinking Cities in China: Evidence from the Latest Two Population Censuses 2010–2020.” Environment and Planning a-Economy and Space 54 (3): 449–453. https://doi.org/10.1177/0308518X221076499.
- Moran, P. 1950. “Notes on Continuous Stochastic Phenomena.”
- Morshed, M., T. Chakraborty, and T. Mazumder. 2022. “Measuring Dhaka’s Urban Transformation Using Nighttime Light Data.”
- Perera, A., K. Javanroodi, D. Mauree, V. Nik, P. Florio, T. Hong, and D. Chen. 2023. “Challenges Resulting from Urban Density and Climate Change for the EU Energy Transition.” Nature Energy 8 (4): 397–412. https://doi.org/10.1038/s41560-023-01232-9.
- Reba, M., and K. C. Seto. 2020. “A Systematic Review and Assessment of Algorithms to Detect, Characterize, and Monitor Urban Land Change.” Remote Sensing of Environment 242:111739. https://doi.org/10.1016/j.rse.2020.111739.
- Rieniets, T. 2009. “Shrinking Cities: Causes and Effects of Urban Population Losses in the Twentieth Century.” Nature + Culture 4 (3): 231–254. https://doi.org/10.3167/nc.2009.040302.
- Song, Y., M. Kalacska, M. Gasparovic, J. Yao, and N. Najibi. 2023. “Advances in Geocomputation and Geospatial Artificial Intelligence (Geoai) for Mapping.” International Journal of Applied Earth Observation and Geoinformation 120:103300. https://doi.org/10.1016/j.jag.2023.103300.
- Song, Y., G. Yeung, D. Zhu, Y. Xu, and L. Zhang. 2022. “Efficiency of Urban Land Use in China’s Resource-based Cities, 2000–2018.” Land Use Policy 115:106009. https://doi.org/10.1016/j.landusepol.2022.106009.
- Sun, M., G. Shang, X. Zhang, Z. Yan, Y. Gao, C. Zhang, and Y. Liu. 2023. “Analysis of the Space-time Transformation of Urban Structure in Beijing-Tianjin-Hebei Using NPP-VIIRS Night-time Light Data.” International Journal of Remote Sensing, 1–20. https://doi.org/10.1080/01431161.2023.2202341.
- Turner, B. L. I., E. F. Lambin, and A. Reenberg. 2007. “The Emergence of Land Change Science for Global Environmental Change and Sustainability.” Proceedings of the National Academy of Sciences of the United States of America 104 (52): 20666–20671. https://doi.org/10.1073/pnas.0704119104.
- van der Ploeg, F. 2011. “Natural Resources: Curse or Blessing?” Journal of Economic Literature 49 (2): 366–420. https://doi.org/10.1257/jel.49.2.366.
- Von Luxburg, U. 2007. “A Tutorial on Spectral Clustering.” Statistics and Computing 17 (4): 395–416. https://doi.org/10.1007/s11222-007-9033-z.
- Wang, Y., H. Chen, R. Long, Q. Sun, S. Jiang, and B. Liu. 2022. “Has the Sustainable Development Planning Policy Promoted the Green Transformation in China’s Resource-based Cities.” Resources Conservation and Recycling 180. https://doi.org/10.1016/j.resconrec.2022.106181.
- Wu, J., and Z. Bai. 2022. “Spatial and Temporal Changes of the Ecological Footprint of China’s Resource-based Cities in the Process of Urbanization.” Resources Policy 75:102491. https://doi.org/10.1016/j.resourpol.2021.102491.
- Yan, T., and Y. Hu. 2019. “Classification of Resource-based Cities from the Perspective of Resource Decoupling.” Resources Science 41:2172–2181. https://doi.org/10.18402/resci.2019.12.02.
- Yang, J., F. Chen, Y. Wang, J. Mao, and D. Wang. 2023. “Performance Evaluation of Ecological Transformation of Mineral Resource-based Cities: From the Perspective of Stage Division.” Ecological Indicators 154:110540. https://doi.org/10.1016/j.ecolind.2023.110540.
- Yang, Y., J. Wu, Y. Wang, Q. Huang, and C. He. 2021. “Quantifying Spatiotemporal Patterns of Shrinking Cities in Urbanizing China: A Novel Approach Based on Time-Series Nighttime Light Data.” Cities 118:103346. https://doi.org/10.1016/j.cities.2021.103346.
- Yang, S., X. Yang, X. Gao, and J. Zhang. 2022. “Spatial and Temporal Distribution Characteristics of Carbon Emissions and their Drivers in Shrinking Cities in China: Empirical Evidence Based on the NPP/VIIRS Nighttime Lighting Index.” Journal of Environmental Management 322:116082. https://doi.org/10.1016/j.jenvman.2022.116082.
- Ye, X., L. Dong, L. Lv, and Y. Shang. 2022. “Spatiotemporal Evolution Law and Driving Force of Mining City Patterns.” Environmental Science and Pollution Research 29 (7): 10291–10307. https://doi.org/10.1007/s11356-021-16488-5.
- Zheng, Q., K. C. Seto, Y. Zhou, S. You, and Q. Weng. 2023. “Nighttime Light Remote Sensing for Urban Applications: Progress, Challenges, and Prospects.” Isprs Journal of Photogrammetry and Remote Sensing 202:125–141. https://doi.org/10.1016/j.isprsjprs.2023.05.028.
- Zhong, X., Q. Yan, and G. Li. 2022. “Long Time Series Nighttime Light Dataset of China (2000–2020).” Digital Journal of Global Change Data Repository 6.
- Zhou, Y., C. Li, W. Zheng, Y. Rong, and W. Liu. 2021. “Identification of Urban Shrinkage Using NPP-VIIRS Nighttime Light Data at the County Level in China.” Cities 118:103373. https://doi.org/10.1016/j.cities.2021.103373.
- Zhou, D., S. Zhao, S. Liu, L. Zhang, and C. Zhu. 2014. “Surface Urban Heat Island in China’s 32 Major Cities: Spatial Patterns and Drivers.” Remote Sensing of Environment 152:51–61. https://doi.org/10.1016/j.rse.2014.05.017.