
 ?Mathematical formulae have been encoded as MathML and are displayed in this HTML version using MathJax in order to improve their display. Uncheck the box to turn MathJax off. This feature requires Javascript. Click on a formula to zoom.
ABSTRACT
Soil erosion, a major factor contributing to land degradation, poses significant environmental challenges across sub-Saharan Africa, including Ethiopia. This study identifies erosion-prone sub-watersheds in southern Ethiopia's middle Omo-Gibe River basin using digital elevation model data, analyzed using a geomorphometric and statistically weighted sum priority approach in a Geographic Information System environment. Additionally, hypsometric analysis, lithology, land use/cover analysis, and field observations were integrated to enhance methodological reliability in assessing soil erosion patterns and subsequent land degradation in the basin. Results highlight sub-watersheds with varying degrees of erosion sensitivity, emphasizing morphometric parameters and landscape characteristics. Furthermore, hypsometric analysis confirms a moderate to high susceptibility of sub-watersheds to soil erosion. Moreover, half of the river basin consists of shrubland, encompassing scrubs, range lands, and small wooded areas. These are less efficient in mitigating erosion compared to forests, especially in the face of significant summer rainfall and ensuing runoff. Statistical prioritization identified 19 sub-watersheds, covering 43% of the basin's total area, as highly prone to soil erosion and land degradation. The study's findings are valuable for Ethiopian watershed management decision-makers, enabling informed resource allocation and targeted interventions to control soil erosion and protect water resources by utilizing the outputs of this study.
1. Introduction
Land degradation is a growing concern globally, particularly impacting the economies and environments of developing regions due to its close association with ecological resource utilization (Berkhout et al. Citation2021; IPBES Citation2018). This, coupled with desertification and drought, has already impacted over three billion people, especially disadvantaged rural communities, small-scale farmers, indigenous groups, and other vulnerable populations worldwide (Hossain, Krupnik, and Timsina Citation2020; Nachtergaele et al. Citation2011). Considering the extent and impacts of problems incurred through land degradation, the United Nations Convention to Combat Desertification has recognized it as a significant socioeconomic and environmental challenge, particularly in the world's arid regions (UNCCD Citation2020). Subsequently, the global discourse on environmental issues prioritizes addressing land degradation due to its adverse environmental impact and potential to increase threats to global food security. Soil erosion, influenced by natural elements such as water and wind, which are further modulated by human activities, stands as a primary contributor to land degradation (Ziadat et al. Citation2021).
Conversely, land degradation can worsen soil erosion by compromising soil structure and reducing its capacity to retain moisture and nutrients, making the land more prone to erosion by water and wind (Kirui, Mirzabaev, and von Braun Citation2021). Furthermore, the accelerated global rate of soil erosion degrades the depletion of agricultural productivity by removing topsoil from farmland, particularly impacting impoverished developing regions such as the African continent. For instance, the global erosion rate was estimated at 35.9 peta-grams per year using a global potential soil erosion model (Mosbahi, Benabdallah, and Boussema Citation2013). Moreover, according to Africa's Economics of Land Degradation report, about 375.6 and 61.5 million ha of land have experienced loss of topsoil and chemical degradation from soil erosion, respectively (Pushpam Kumar et al. Citation2015). The African continent, particularly Sub-Saharan Africa (SSA) is mainly vulnerable to land degradation, and it is the most severely affected region, with around 55% of the land areas at high risk of further degradation (UNEP Citation2023).
Among the SSA countries, Ethiopia is particularly threatened by land degradation due to high dependence on agriculture, population growth, frequent famine, and poverty. In Ethiopia, soil erosion by water severely threatens the national economy and costs around US$ 100 billion annually (Bewket and Teferi Citation2009; Yesuf et al. Citation2007). Ethiopia's measured average soil loss ranges between 35–300 tons per hectare per year (Fenta et al. Citation2021). The Ethiopian highlands are mostly influenced by severe land degradation due to the combination of deforestation, rainfall erosivity, steep slopes, overgrazing, and agricultural systems like stagnation agricultural techniques (Nyssen et al. Citation2015). Consequently, land degradation affects over 85% of the population in the highlands and over 40 million hectares of land in Ethiopia (Samuel Gebreselassie and Mirzabaev Citation2016). The Omo-Gibe River (OGR) basin is a significant part of the highlands, and shows mean annual soil loss exceeds 60 tons per hectare per year (Girma and Gebre Citation2020; Keddi Lencha and Moges Citation2016; Tesfaye Citation2018). As a result, the problem of soil erosion and land degradation is still a significant issue in much of the Ethiopian highlands, and it is likely to get worse in the future due to projected population growth and the recurrence of extreme precipitation events during the twenty-first century (Nyssen et al. Citation2015). Therefore, soil erosion assessment is a primary goal in a decision support system for reversing the ever-increasing problem of land degradation. Many studies worldwide, including Ethiopia, have started to look at the situation and have developed various assessment and monitoring methods to study issues at the watershed scale.
Moreover, the study of soil erosion and consequential land degradation at the watershed scale is not considered simply as the hydrological unit but also as a socio-economic and ecological entity. It is crucial to comprehend the optimum interaction and synergetic effect of land and water resources in the context of natural and human factors (Arabameri et al. Citation2020; Hossain, Krupnik, and Timsina Citation2020; Kant, Kumar, and Meena Citation2023). In recent years, the use of watersheds as the fundamental unit in morphometric analysis has gained prominence. Remote sensing (RS), in conjunction with Geographic Information Systems (GIS), has emerged as a powerful tool for capturing and expressing various aspects of the current climate, natural resource degradation, structural characteristics, geomorphology, and geology of watersheds. The geospatial-based analysis of geomorphometric parameters is a widely used technique for characterizing, classifying, mapping, and presenting various geological, topographic, and hydrological characteristics of watersheds and their geophysical and environmental processes (Anshumali1 Citation2019; Hossain, Krupnik, and Timsina Citation2020; Subhash Chavare Citation2013). It also provides a quantitative description of the drainage system, relief features, hydrological processes, shape, and geological formations of the watersheds (Strahler Citation1957).
Moreover, the morphometric analysis also helps to identify the relationship between geomorphometric parameters and their effects on soil erosion, erodibility, and land degradation in watersheds (Gajbhiye, Mishra, and Pandey Citation2014; Malik, Kumar, and Kandpal Citation2019; Rahaman et al. Citation2015; Rai et al. Citation2017; Verma, Patel, and Choudhari Citation2023). The morphometric parameters can be measured by grouping them into essential characteristics, linear features, drainage area, and landscape/relief aspects of morphometry. These aspects, directly and indirectly, determine the degree of soil erosion and land degradation and are important indicators for the planning and implementation of watershed development strategies and programs (Boitt and Bebeto Citation2020; Kumar et al. Citation2022; Rahaman et al. Citation2015; Wagh, Manekar, and Vallabhbhai Citation2021). Moreover, the land degradation and topological changes within watersheds, accomplished by weathering processes, stream erosion patterns, and sediment transportation by surface runoff, are determined by the hypsometry of drainage basins (Strahler Citation1957). The hypsometric curve is related to the volume of the soil mass in the basin and the amount of erosion that had occurred in a basin against the remaining mass (Francis Lucazeau Citation1997). Besides, examining land use practices through land use or cover maps aids in understanding land use conversion resulting from unsustainable practices such as excessive wood harvesting, overgrazing, and intensified agriculture on arable lands and steep slopes. These practices accelerate the depletion of ecosystem services and the process of land degradation within the watershed (Bajocco et al. Citation2012; Choto and Fetene Citation2019; Mirzabaev et al. Citation2016). Therefore, combining hypsometric analysis, land use/cover analysis, and geomorphometric analysis supported by field observations can strengthen the methodological reliability when assessing soil erosion patterns, a preference evident in recent studies.
The OGR basin, a significant part of Ethiopia's south-central highland, has been attracted to observe soil erosion severity in recent years. Moreover, the majority of the catchments in the river basin are occupied and cultivated by a vast number of smallholder farmers. The poor land management methods, combined with the area’s rugged topography, erosive rainfall pattern, and nutrient depletion, pose severe to the farmers’ livelihood (Dagnachew et al. Citation2020; Dagne, Assefa and Teferi Citation2024). Besides, the Middle Omo-Gibe River (MOGR) basin is currently renowned for its Omo-Gibe III hydroelectric power plant, which has a substantial supply of energy sources for the country. However, the reservoir is continuously threatened by soil erosion and subsequent sedimentation from dense stream networks and sub-watersheds of the basin, resulting in siltation and nutrient enrichment, creating significant problems in the reservoir (Kanito, Bedadi, and Feyissa Citation2023).
In recent years, efforts have been made to quantify and map soil erosion-prone areas using various remote sensing-based analyses in the Ethiopian highlands, including the OGR basin. However, most previous studies have mainly focused on the physical forms of degradation and have applied single parameters to monitor the risks of soil erosion and land degradation. These studies primarily analyzed the cause and consequences of land degradation using field surveys, and few of them analyzed morphometric factors for soil erosion assessment (Berkhout et al. Citation2021; Meseret Citation2016; Wubie Citation2015). However, there were no significant previous research studies in the river basin that addressed the inter-consequential relationships between geomorphometric factors and soil erosion in the context of prioritizing sub-watersheds prone to soil erosion (Dagne et al. Citation2024; Fenta et al. Citation2021; Mohammed, Adugna, and Takala Citation2018). The present study aims to fill the gaps mentioned above by analyzing the detailed geomorphometric parameters of more than 90 sub-watersheds of the MOGR basin, using the geospatial and statistical techniques with the supplement of field observations to prioritize the sub-watershed in terms of their erosional potential for the sustainability of agriculture, natural resource management, and livelihood activities. By leveraging morphometric and hypsometric features and weights derived from the correlation matrix, the current research highlights the effectiveness of a non-subjective statistically computed weighted sum priority (WSP) method for ranking sub-watersheds prone to soil erosion. The study also highlights the influences of morphometric factors on soil erosion and land degradation, which have been neglected in previous studies. The findings from this research significantly contribute to the knowledge of assessing, quantifying, and mapping the distribution and severity of soil erosion, thus addressing the growing concerns of land degradation in the MOGR basin of southern Ethiopia.
2. Regional settings of the study area
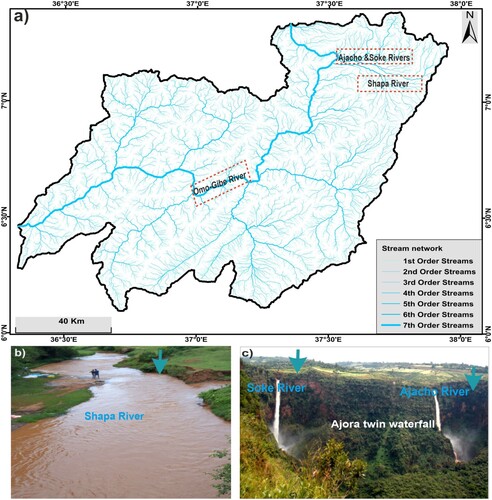
The study is carried out in southern Ethiopia's sub-watersheds of the MOGR basin. It is extended between the geographic coordinates of 6° 06’ 23'‘ N -7° 23’ 15” N latitude and 36° 17’ 35” E – 37° 56’ 23” E longitude ((a)). The MOGR basin covers a total basin area of 14,382.3 km2. The basin, part of the Omo River, holds economic significance for the country, supplying approximately 2,474 megawatts (MW) of hydroelectric power through its series of power plants constructed within the basin. The physiography of the river basin is characterized by mountains, sloppy hills, dissected terrain features, steep-sided river valleys, small plateaus, and prolonged gulleys influenced by the river and its tributaries. The relief of the basin ranges from 491 meters (m) to 3554 m above mean sea level (a.m.s.l) ((a)). It spans the south-central highlands of Ethiopia, including Hambaricho, Damota, Guge, Dawuro, and Konta highlands. The basin exhibits dense stream networks, deep gorges, and waterfalls. For instance, the Ajora waterfalls, located between the Kambata and Wolaita administrative zones, with substantial volume of rivers flow contribute significantly to the water and sediment flow of the MOGR basin ((c)). The climate of the MOGR basin typically includes tropical, sub-humid, and semi-arid environments. It varies from hot and semi-arid climates in the southern part of the basin to tropical and humid in the highlands (Chaemiso, Abebe, and Pingale Citation2016). The mean annual rainfall ranges from 800 millimeters (mm) to over 1800 mm, and the mean yearly temperature is around 23°C. The geology of the MOGR basin is dominated by fault feature origin associated with the Great Rift Valley of Ethiopia (Gathogo Citation2017). It comprises the geological processes and events of the Precambrian to the Quaternary period of the Cenozoic era ((b)). It dominantly comprises the tertiary extrusive and intrusive rocks followed by Quaternary extrusive and intrusive rocks and Precambrian rocks, which are relatively soft and weathering rocks particularly susceptible to soil erosion ((b,c)). Most of the geomorphology of the river basin was highly disturbed by exogenesis processes such as landslides, weathering and erosion, and human activities. The dominant soil types covering the study area are Eutric Nitosols, Eutric Combisols, Orthic Acrisols, Ochric Andosols, Calcaric Fluvisols, Heplic Yermosols and Plinthic Ferralsols (Montanarella Luca et al. Citation2015).
Figure 1. Study area description: (a) Location of study area, (b) Geology, and (c) Lithology.
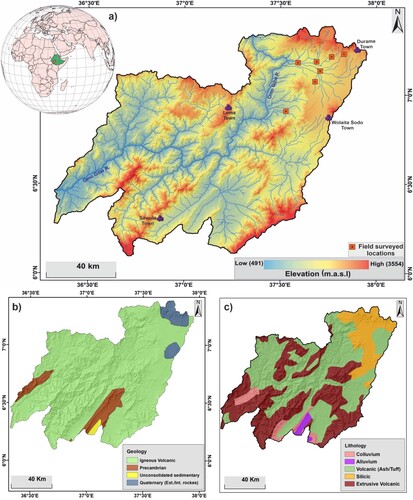
Figure 2. Drainage system of the MOGR basin: (a) drainage network map, (b) Shapa River, (c) Soke and Ajacho Rivers falling into Ajora twin waterfalls, and (d) Omo Gibe River.
3. Databases and methodology
3.1. Data sources and characteristics
A better resolution and accurate Digital Elevation Models (DEMs) are essential prerequisites for delineating watersheds and sub-watersheds, conducting morphometric analysis, and prioritizing sub-watersheds. This data consists of a grid of elevation values, enabling detailed quantitative studies of landforms and related topographic features. Several global open-source DEMs are available and usually used for morphometric and watershed prioritization studies, e.g. SRTM3v4 DEM, ASTER GDEM V2, ALOS World 3D (AW3D), ALOS PALSAR RT1, TanDEM-X DEM, NASADEM, Copernicus DEM (Adiri et al. Citation2022; Chymyrov Citation2021). The current study preferred and used the AW3D DEM among available open-source DEMs because of its better vertical and horizontal accuracy. It is also known as a world-leading accurate and precise global-scale elevation data source. AW3D DEM is a global DEM dataset derived from data collected by the Advanced Land Observing Satellite (ALOS), operated by the Japan Aerospace Exploration Agency (JAXA). This dataset provides global coverage with a spatial resolution of ∼ 30 meters. Numerous researchers across various global regions, including different areas within Africa, have evaluated the accuracy or suitability of this DEM in comparison to locally available or obtained datasets (Buckley et al. Citation2020; Ghannadi et al. Citation2023; Rahman et al. Citation2022; Santillan, Makinano-Santillan, and Makinano Citation2016). Their findings consistently highlight the AW3D DEM as their regions’ most accurate elevation model (Rahman et al. Citation2022; Tadono et al. Citation2014). Besides, the mean, standard deviation, and RMSE of AW3D DEMs versus 5121 control points distributed across 127 image tiles were −0.44, 4.38, and 4.40 m, respectively (Takaku, Tadono, and Tsutsui Citation2014). This DEM was downloaded from open sources of Opentopography databases (https://portal.opentopography.org/datasetMetadata). The dataset was transformed from the Geographic coordinates of the World Geodetic System (WGS)-1984 to the Universal Transverse Mercator (UTM) Zone-37 North (N) projected coordinate system of the study region. This conversion facilitated further processing and extraction of morphometric parameters in the metric system. In addition, the geomorphology/geology, soil maps, published reports provided by different organizations and researchers, and multi-spatial resolution satellite dataset of Sentinel-2A MultiSpectral Instrument (MSI) and Google Earth maps were taken as ancillary datasets for improving the results and extracting other parameters like land use/cover, soil, and lithology to support the inferences calculated in this study.
3.2. Delineation of stream network and sub-watersheds
The spatial analysis tool built within ArcGIS 10.8.2 is used to compute the flow accumulation threshold (FAT), generate stream networks, and delineate sub-watersheds. The FAT limit for extracting the stream network and then delineating sub-watersheds has been determined using Equation 1.
(1)
(1) Where FA refers to flow accumulation, CS is DEM cell size, and MFA refers to maximum flow accumulation limit, a user-defined value. The user-defined FAT value is determined based on the density of the drainage raster. This value is instrumental in hydrological modeling and watershed analysis, as it determines the delineation of watersheds, identification of stream networks, and various hydrological assessments. Upon defining the user-defined FAT limit, the stream raster is processed, and the stream network of the watershed is defined ((a)). Hence, this study meticulously selected and calibrated the FAT to accurately depict flow patterns and comprehensively analyze watershed dynamics, including associated environmental processes.
3.3. Geomorphometric analysis
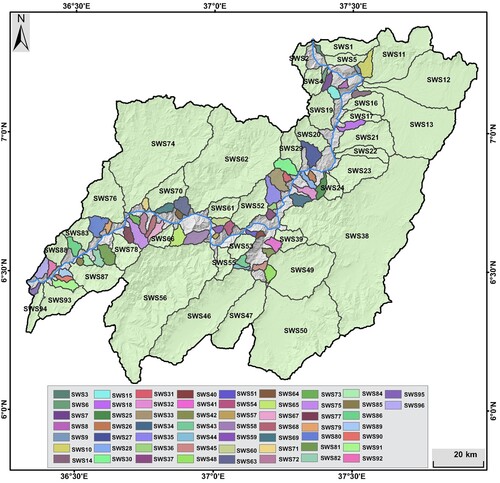
Geomorphometry, a quantitative analysis of digital topographic surfaces, is a widely available tool crucial for watershed prioritization and assessment of soil erosion and land degradation (Pike and Wilson Citation1971). It relies on the assumption that a form or surface contains valuable information about functionality, inner composition, and genesis. Morphometric analysis, initially introduced by Horton (Citation1945) in hydrology, has been pivotal in understanding stream characteristics. The stream network, essential for comprehending landform processes, physical soil traits, and land degradation states, can be more effectively analyzed by considering the drainage basin's areal, linear, shape, and relief features (Biswas Citation2015; Schumm Citation1956). Moreover, integrating morphometric data with other geospatial datasets, such as hypsometry, land cover, soil types, precipitation, and so on, enhances understanding of the complex interactions between landforms and hydrological processes (Raja Shekar and Mathew Citation2024). Accordingly, more than 30 morphometric parameters, i.e. basic, linear, drainage area, shape, and landscape/relief aspects, have been calculated and examined over 96 sub-watersheds within the study region ().
Figure 3. Sub-watersheds of the MOGR basin with the central part along the Omo Gibe River referring to the areas of the river valley and its main river channel.
The linear aspect denotes the orientation of stream channels and drainage lines within a watershed, which is crucial for delineating water flow paths and identifying erosion hotspots (). Meanwhile, the relief aspect encompasses elevation variations, including slope steepness and elevation differences, offering insights into terrain ruggedness that influences hydrological processes (). Additionally, the shape aspect refers to geometric characteristics like size, compactness, and drainage pattern, affecting water flow and sediment transport distribution within the watershed. These parameters were employed to prioritize soil erosion in the study watersheds. The ArcGIS 10.8.2 hydrology toolbox automatically extracted these parameters. Additionally, the study utilized the natural break technique, or the Jenks optimization method, to classify and group data into categories. This method is ideal for situations with distinct breaks or clusters in data distribution, facilitating meaningful classification into discrete categories or classes commonly applied in GIS and spatial analysis for data like soil erosion rates.
Figure 4. The methodology workflow for geomorphometric analysis and prioritization of sub-watersheds.
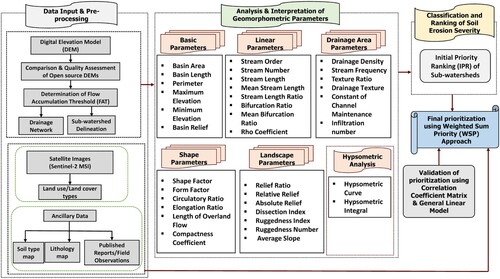
Table 1. Morphometric parameters and their standard definitions.
3.4. Hypsometric analysis
Hypsometric analysis assesses the landscape's morphometric characteristics, including elevation distribution and relief variability, aiding in understanding terrain complexity. This information influences geomorphological processes like soil erosion and sediment transport (O. Singh, Sarangi, and Sharma Citation2008). The basin hypsometry is computed using AW3D DEM, involving the estimation of the hypsometric integral (HI) and generating a hypsometric curve (). It deals with the relationship between the horizontal cross-sectional area of the watershed and its elevation in the dimensionless form (Shekar et al. Citation2023). The HI value of the basin and its sub-watersheds are computed using the Elevation-Relief Ratio (ERR) method proposed by (Pike and Wilson Citation1971). It is estimated by classifying the basin elevation into equal intervals and computing zonal statistics in ArcGIS 10.8.2. Moreover, the hypsometric curve is plotted on a graph using the ratios of relative elevation and relative area of the basin. The HI ratio value and the hypsometric curve shape are used to assess basin morphology, topographic complexity, and stage of watershed evolution.
3.5. Weighted sum priority (WSP) approach for sub-watershed prioritization
The prioritization of sub-watersheds in this study is accomplished using the weighted sum priority (WSP) approach (). The WSP approach integrates rigorous statistical methods with geospatial technologies to identify critical parameters necessary for the comprehensive analysis and prioritization of sub-watershed (Kulimushi et al. Citation2022). This approach efficiently generates weights, enabling the objective ranking of sub-watersheds while minimizing subjective biases in the results (Boitt and Bebeto Citation2020; Kadam et al. Citation2019; Kulimushi et al. Citation2022). The approach involves two key steps: the initial priority ranking (IPR) of sub-watersheds based on ranking selected morphometric parameters, and the final priority ranking (FPR) determined using weighted compound factors (WCF) derived from a cross-correlation matrix (Kulimushi et al. Citation2022).
3.5.1. Initial priority ranking (IPR)
Sub-watersheds’ IPR is based on morphological characteristics, encompassing linear, drainage area, shape, and landscape/relief parameters (). Linear, aerial, and landscape/relief parameters are directly proportional to soil erodibility factors, while shape parameters are inversely related to soil erosion (Biswas Citation2015; Gajbhiye, Mishra, and Pandey Citation2014; Malik, Kumar, and Kandpal Citation2019; Wagh, Manekar, and Vallabhbhai Citation2021_A*{). The compound factor (CF) for each sub-watershed is calculated by summing the rank values of linear, areal, shape, and landscape/relief parameters and then dividing by the number of parameters, as expressed in Equationequation 2(2)
(2) . The IPR is given based on the calculated CF value, where the sub-watershed with the lowest CF value is assigned the highest priority.
(2)
(2)
3.5.2. Weighted compound factor (WCF)
The correlation matrix among all selected morphometric parameters is estimated to measure the linear relationship between morphometric pairs for calculating WCF. The present study uses the Pearson correlation coefficient method to perform a correlation matrix using an open-source R software environment. Then, the WCF used for computing the WSP factor is calculated as a fraction between the sum of the correlation coefficient and the total correlation value, as expressed in Equation 3.
(3)
(3)
3.5.3. Final priority ranking (FPR)
The WSP approach assesses watershed prioritization using the previously calculated WCF for each sub-watershed. The results obtained from the IPR are then multiplied by the WCF to determine the WSP factor for the final prioritization of sub-watersheds. Accordingly, the final prioritization is determined by summing the multiplication values of all parameters, as outlined in Equation 4.
(4)
(4)
4. Results
4.1. Basic morphometric parameters of basin and sub-watersheds
The extracted morphometric parameters, including basin area, length, width, perimeter, elevation (maximum and minimum), relief, aspect, and slope (), are vital for prioritizing watersheds. They provide essential insights into watersheds’ physical characteristics and hydrological behaviour, thus influencing the calculation and assessment of other morphometric factors discussed in subsequent sub-sections (Gajbhiye, Mishra, and Pandey Citation2014; Saha Citation2020).
4.1.1. Basin area (A)
The total drainage area of the MOGR is 14,382.3 km2. The sub-watersheds with the largest and smallest basin are SWS38 (1961.5 Km2) and SWS57 (4.67 Km2), respectively (Supplementary Table 1). Among the sub-watersheds of the basin, 12.5% of the sub-watersheds are medium-sized sub-watersheds in their size of watershed classification. However, the sub-watersheds vary in size, ranging from small areas of 4.67 km² to larger watersheds with an area of 207.76 km² ((a)). A spatial distribution pattern was observed concerning basin extent, as the largest basins are grouped and located mainly on the eastern side compared to the western side.
Figure 5. Basic morphometric and topographic parameters: (a) Basin area & width, (b) Basin length & perimeter, (c) Maximum elevation, (d) Basin relief, (e) Basin slope, and (f) Basin aspect.
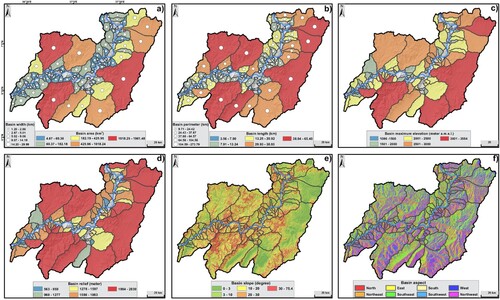
4.1.2. Basin length (Lb), width (Wb), and perimeter (p)
The basin length, or hydrologic length, signifies the distance over which surface drainage flows. It represents the longest dimension parallel to the main drainage line within the basin and is utilized to measure water travel time from the watershed outlet to the basin boundary (Arefin, Islam Mohir, and Alam Citation2020). The basin length of the MOGR basin is 198.78 km ((b)). The sub-watersheds with the lowest and highest basin lengths are SWS53 (3.56 km) and SWS68 (65.40 km). The mean basin width of the river basin computed as the ratio of basin area to basin length is 72.35 km ((a)). Meanwhile, the basin width of the sub-watersheds varies from 1.20 km (SWS6) to 29.99 km (SWS38) (Supplementary Table 1). The perimeter of the MOGR basin is 814.18 km ((b)). Moreover, the sub-watershed perimeter ranges from 9.71 km in SWS57 to 273.8 km in SWS38 (Supplementary Table 1). It influences the interaction between the watershed and its surrounding landscape, including land use practices, surface runoff patterns, and ecological connectivity.
4.1.3. Basin relief (Bh)
The relief of the watershed significantly influences its erosional characteristics. It plays a crucial role in shaping landforms, drainage patterns, surface runoff, groundwater recharge, permeability, and erosional properties of the terrain (Magesh, Chandrasekar, and Soundranayagam Citation2011). In the MOGR basin, elevations range from 3554 m a.m.s.l to a minimum of 491 m a.m.s.l ((c)). Among the 96 sub-watersheds, 25 (26%) have elevations exceeding 2500 meters, with SWS56, SWS38, and SWS50 having the highest peaks, while only 10% have maximum elevations below 1500 meters a.m.s.l (Supplementary Table 1). Moreover, the basin relief of the MOGR basin is 3063 m, with relief values ranging from 563 m in SWS85 to 2839 m in SWS38 ((d)). The 48% of sub-watersheds exhibit relief exceeding 1500 m, indicative of steeper terrain associated with rapid runoff and concentrated flow paths. These conditions may elevate susceptibility to erosion and sedimentation.
4.1.4. Basin aspect and slope
The aspect of the watershed typically denotes the direction a mountain slope faces, impacting the local climate and precipitation regime. In the MOGR basin, the majority of the area is categorized as northwest (13.2%), southwest (13.1%), and south (13.1%) ((f)). Moreover, the basin slope indicates the steepness of the terrain within the watershed, influencing surface runoff, erosion rates, and sediment transport. In the MOGR basin, slopes range from less than 5° to a maximum of 75° ((e)). Approximately 12% of the basin areas feature slope gradients exceeding 30°, while around 50% have slopes ranging from 10° to 30°. Consequently, steeper slopes across the basin and sub-watersheds typically result in accelerated runoff velocities and heightened erosion potential, contributing to increased sedimentation in downstream water bodies.
4.2. Linear morphometric parameters of the basin and sub-watersheds
4.2.1. Stream order (U) and stream number (Nu)
The stream order (U) is the first step in the morphometric analysis of drainage basins and is a measure of the position of streams in the hierarchy of tributaries (Strahler Citation1957). The MOGR basin consists of seven stream orders, with the Omo-Gibe River (OGR) representing the seventh-order stream (). This river typically divides the MOGR basin into two distinct parts ((a)). Most streams fall within the first and second-order categories, comprising approximately 94.66% of the total number of streams. Sub-watersheds featuring the second-highest stream order, i.e. sixth-order streams, are primarily situated on the left side of the Omo-Gibe River ((a)). Additionally, more than 50% of basin sub-watersheds are linked to minimum stream orders, corresponding to third-order streams. The highest stream number (Nu) are observed in SWS38, SWS56, and SWS74, with total stream numbers of 1,684, 1,195, and 1,107, respectively, and suggest a denser and more interconnected river network (Supplementary Table 1).
Figure 6. Linear Morphometry of sub-watersheds: (a) Stream number, (b) mean stream length, (c) Mean bifurcation ratio, and (d) Rho coefficient.
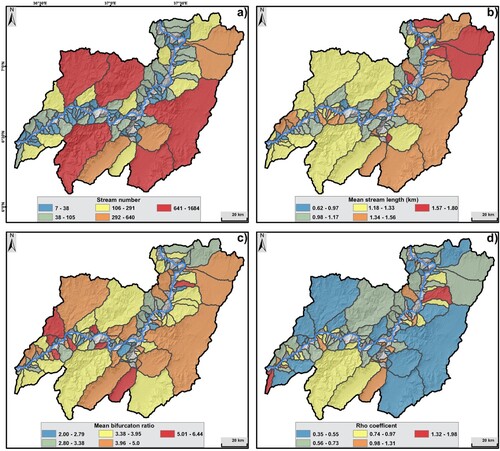
Table 2. Linear parameters of the MOGR basin.
4.2.2. Stream length (Lu), mean stream length (Lsm), and stream length ratio (RL)
The stream length (Lu) indicates the behavior of surface runoff in the basin, which has a significant role in the drainage basin system. The stream with longer lengths typically indicates a flatter gradient, whereas the smaller length is characteristic of areas with more extensive slopes and finer textures (Adhikari Citation2021). The total Lu of the MOGR basin is 16,939.64 km (). The total Lu of first-order streams of the river basin is 8,670.17 km. In contrast, the total Lu of the seventh order is 137.47 km, indicating more significant numbers of first-order streams with maximum cumulative distance. Moreover, the first and second-order streams contribute to 76% (12,856.4 km) of the total Lu of the river basin, while the remaining higher-order streams account for only 24% of the total Lu ((a)). There is an inverse relationship between stream order and length, and a direct positive relationship exists between a stream number and length in a corresponding stream order. The mean stream length (Lsm) of the MOGR basin is 1.33 km, which varies from 0.89 km in first-order streams to 51.92 km in sixth-order streams ((b)). The Lsm is higher for the left bank tributaries (northern section) of the main OGR than the right bank tributaries, further suggesting the well-developed drainage basin or watershed in the eastern section of the MOGR basin ((b)). The analysis of Lsm illustrates that the Lsm increases as the stream number decreases and vice versa, harmonizing with the low of Horton's stream order and length geometric relationship. The sub-watershed stream length ratio (RL) varies from 1.95 km to 3.27 km, and the mean RL of the MOGR basin is 2.36 km ().
4.2.3. Basin bifurcation ratio (Rb)
The bifurcation ratio (Rb) is the ratio between the total stream segments of one order and that of the next higher order in a drainage basin (Schumm Citation1956). If the Rb differs from one order to the next, these irregularities depend on the drainage basin's geological and lithological development (Strahler Citation1957). The Rb of the MOGR basin varies from 4.14 in the third order to 6 in the sixth order (). The sub-watersheds with the highest Rb are SWS38 (20.93), SWS74 (20.19), and SWS56 (19.734), whereas the lowest Rb are recorded at SWS3, SWS6, SWS36, SWS51, SWS57, SWS9, and SWS44 with less than five ratios (Supplementary Table 1). Strahler suggested that the Rb characteristically ranges between 2 and 5 for basins where the geologic structures do not disturb the drainage pattern. At the same time, structural controls play dominant roles where it is higher than 10 (Strahler Citation1957). The mean bifurcation ratio (Rbm) of the MOGR basin is 4.66, with variations observed among sub-watersheds ranging from 2 in SWS44 to 6.44 in SWS80 ((c)). The higher range in the variation of the Rbm of the sub-watersheds is ascribed to the geometrical dissimilarities among the sub-basins.
4.2.4. Rho coefficient (ρ)
The Rho coefficient (ρ) is a proportion of the stream length and bifurcation ratio (Horton Citation1945). The ρ is an important parameter that links drainage density to the physiographic growth of the basin, which is helpful for the assessment of the storage capacity of a stream network in watersheds (W. R. Singh, Barman, and Tirkey Citation2021). Thus, it is a determinant parameter that controls the ultimate degree of drainage growth in a given watershed. The ρ of the MOGR basin is 0.51 ((d)), while the ρ values of sub-watersheds range from 0.35 at SWS15 to 1.98 at SWS95 (Supplementary Table 1). As the ρ value increases, the probability of flood storage and the degree of soil erosion increases (Horton Citation1945). The approximate 70% of sub-watersheds exhibit a ρ value exceeding 0.55, indicating higher flood storage capacity and an amplified soil erosion effect within these sub-watersheds ((d)).
4.3. Drainage areal morphometric parameters and characterization
The drainage area aspects of parameters are a basin's two-dimensional properties that deal with the total projected area contributing overland flow to the channel area.
4.3.1. Stream frequency (Fs)
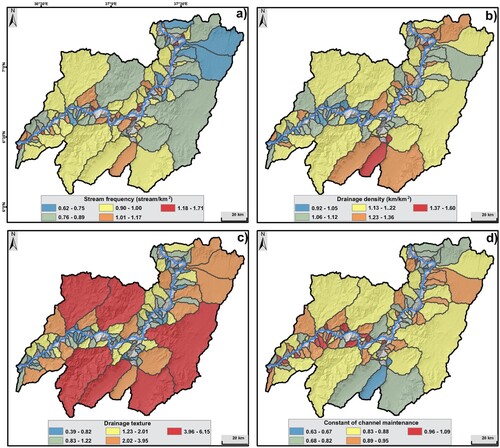
Stream frequency (Fs) is the ratio of the total number of stream segments of all the orders in the watershed to the total area of the watershed (Horton Citation1945). It is also known as stream density and is controlled by the watershed’s physical characteristics, climate, vegetation cover, lithology (rock and soil types), surface infiltration capacity, and area relief (Adhikari Citation2021). It is directly related to erodibility, as the higher the Fs, the higher the erodibility, and vice versa (Wagh, Manekar, and Vallabhbhai Citation2021). The Fs of the MOGR basin is 0.88 streams /km2 (Supplementary Table 2). Sub-watershed Fs vary from 0.62 streams/km2 in SWS13 to 1.71 streams/km2 in SWS57 ((a)). The 30% sub-watersheds exhibit Fs exceeding one stream/km2, suggesting a higher susceptibility to erosion processes.
Figure 7. Drainage area morphometry: (a) Stream frequency, (b) Drainage density, (c) Drainage texture, and (d) Constant of channel maintenance.
4.3.2. Drainage density (Dd)
Drainage density (Dd) is the ratio of total channel segment lengths cumulated for all orders within a basin to the entire basin area (Horton Citation1945). It depends on sub-surface elements’ permeability, vegetation cover types, and terrain relief. The Dd of the MOGR basin is 1.18 km/km2, which indicates that the river basin has a highly coarse surface and lower relief, with a higher recharge of subsoil in the basin ((b)). The Dd of sub-watersheds ranges from the lowest at SWS68 (0.92 km/km2) to the highest (1.6 km/km2) recorded at SWS47 (Supplementary Table 2). The lower Dd of the study area indicates that the area has permeable subsoil, dense vegetative cover, and coarse texture, whereas the higher Dd shows an inverse to these (Arabameri et al. Citation2020). In some cases, drainage patterns in different litho-units have demonstrated that the streams flowing over various rock units exhibit multiple types of channel development (Ghosh, Mukhopadhyay, and Jana Citation2021).
4.3.3. Drainage texture (Dt)
Drainage texture (Dt) is the ratio of stream number and perimeter of the basin (Horton Citation1945). It depends on several physical factors such as climate, rainfall, vegetation, rock, soil type, infiltration capacity, and soil evolutionary stage (Arabameri et al. Citation2020). The Dt of the river basin is classified into four categories: very coarse (<2), coarse (2-4), moderate (4-6), and fine or highland topography (>6) (Wischmeier and Smith Citation1978). The Dt of the MOGR basin is 15.6, which means that the basin is categorized into highland topography classes ((c)). The sub-watersheds with the highest record of Dt are at SWS38, accounting for 6.15, whereas the lowest Dt is 0.39, recorded at SWS44 (Supplementary Table 2). The results indicate that 79% of sub-watersheds are characterized by lower values of Dt, falling into the very coarse to coarse category, while the remaining 21% exhibit higher values of Dt, classified as moderate to fine Dt ((c)). Moreover, finer Dt often results in more concentrated flow paths, increasing the erosive power of water and leading to accelerated erosion rates within the watershed.
4.3.4. Constant of channel maintenance (C)
The constant of channel maintenance (C) parameter indicates infiltration and the control of flow to the basin outlet. It depends on the rock type and permeability, climatic regime, vegetation cover and relief, and the duration of erosion and climatic history (Raja Shekar and Mathew Citation2024). The C value is meager in areas of close dissection relief. In the present study, the value of C for the MOGR basin is 0.85 ((d)). The sub-watershed value ranges from a minimum of 0.63 at SWS47 to a maximum of 1.09 at SWS68 (Supplementary Table 2). The result indicates that all sub-watersheds of the basin have a C value >0.5, referring to a higher degree of susceptibility to soil erodibility and consequent land degradation. Accordingly, about 40 sub-watersheds of the river basin are the most erodible with their C values > 0.9 ((c)).
4.3.5. Infiltration number (If)
The infiltration number (If) is the outcome of drainage density and stream frequency, reflecting the infiltration potential of a surface (Prabhakaran and Jawahar Raj Citation2018). Higher If indicates lower runoff and less susceptibility to soil erosion and vice versa (Adhikari Citation2021; Arabameri et al. Citation2020). The If for the MOGR Basin is 1.04, whereas the If of the sub-watersheds ranges from a minimum of 0.59 (SWS68) to a maximum of 2.01 (SWS8) (Supplementary Table 2). Moreover, the higher If generally corresponds to lower erosion potential, while lower If may indicate higher erosion risk.
4.4. Shape morphometric parameters of basin and sub-watersheds
Shape morphometry is defined as the geometric features of a landmark configuration (Klingenberg Citation2016). Unlike other morphometric aspects, the shape parameters have an inverse relationship with erosion potential and land degradation process. The higher values of shape parameters illustrate the less likely erosional status and vice versa (Kadam et al. Citation2019).
4.4.1. Shape factor (Sf) and form factor (Ff)
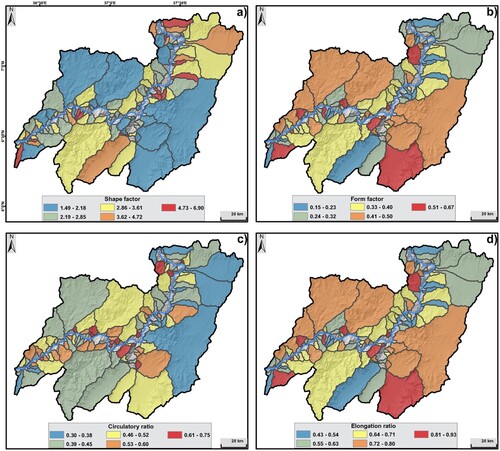
The shape factor (Sf) can be defined as the ratio of the square of the basin length to the basin area (Horton Citation1945). The Sf value for the MOGR basin is 2.75 (Supplementary Table 2). Comparatively, the sub-watersheds exhibit a range of Sf, with the minimum and maximum values recorded as 1.49 (SWS93) and 6.89 (SWS94), respectively ((a)). Approximately 54% of the sub-watersheds possess an Sf below 3, categorized as having lower Sf values. Meanwhile, 34% fall into the medium category, with Sf ranging between 3 and 5. The remaining 12% of sub-watersheds have higher Sf values (Supplementary Table 2). Moreover, the form factor (Ff) quantifies the relationship between a watershed's area and perimeter. It's computed by dividing the area of the watershed by the square of its perimeter. The Ff describes the shape of the basin and its flow intensity (Kulimushi et al. Citation2022). The smaller the value of the Ff, the more it will elongate the shape, and the more excellent value of the Ff indicates the circular shape of the basin. For the MOGR basin, the Ff is 0.36 (Supplementary Table 2). In comparison, sub-watersheds exhibit Ff values ranging from a minimum of 0.15 in SWS94 to a maximum of 0.67 in SWS93 ((b)). Basins with a high Ff value encounter more increased peak flow with a shorter duration and vice-versa.
Figure 8. Shape morphometry of sub-watersheds: (a) Shape factor, (b) Form factor, (c) Circulatory ratio, and (d) Elongation ratio.
4.4.2. Circulatory ratio (Rc)
Circulatory ratio (Rc) is defined as the ratio of the basin area to the area of the circle having the same circumference as the basin's perimeter (Schumm Citation1956; Strahler Citation1957). The value of the Rc varies from 0 (a line) to 1 (a circle). The computed Rc for the MOGR basin is 0.27, which indicates that the river basin is more of an elongated shape with impermeable and rough surfaces for enhancing soil erosion (Supplementary Table 2). However, the Rc for sub-watersheds ranges from 0.3 (SWS22) to 0.75 (SWS85) ((c)). Moreover, a higher Rc suggests a denser network of stream channels, improving drainage efficiency and dispersing runoff effectively, which can reduce surface runoff and erosion. However, excessively high Rc may increase erosion risk by promoting aggressive soil erosion, particularly during high-flow periods, due to excessive drainage density and closely spaced stream channels (Horton Citation1945; Udaipur, Singh, and Yadav Citation2020).
4.4.3. Elongation ratio (Re)
The elongation ratio (Re) refers to the ratio of the diameter of a circle having the same area as the basin and the maximum basin length (Schumm Citation1956). The value of the Re ranges between 0 and 1, where the weight closer to zero suggests the elongated shape, and closer to 1 confirms the circular shape of the watersheds (Topno et al. Citation2022). The Re of the MOGR basin is 0.68, which comparatively has a moderately elongated watershed shape. The Re for all sub-watersheds ranges between 0.43 and 0.93, indicating that watersheds are moderately elongated to oval ((d)). Sub-watersheds such as SWS1, SWS6, SWS18, SWS22, SWS25, SWS44, SWS67, SWS68, SWS90, and SWS94 demonstrate a Re value below 0.5, indicating a more elongated shape with steeper slopes. This configuration can accelerate runoff and intensify water erosive force (Rai et al. Citation2017; Shekar et al. Citation2023). Conversely, sub-watersheds like SWS19, SWS37, SWS40, SWS50, SWS53, SWS63, SWS72, SWS80, SWS85, and SWS93 exhibit a Re exceeding 0.8, indicating an oval-shaped form, which reduces susceptibility to erosion by minimizing concentrated runoff along the longer axis (Supplementary Table 2).
4.4.4. Length of overland flow (Lo)
The length of overland flow (Lo) is half of the reciprocal of drainage density (Melton Citation1957). It affects a basin's hydrological and physiographical processes because it suggests the length of water flow over the ground before it reaches a definite stream channel (Kulimushi et al. Citation2022). Generally, a higher value of the Lo reveals low relief, longer flow paths, and less surface runoff, and vice versa. The Lo for the MOGR basin is 0.59 km/km2, whereas the sub-watersheds value ranges from 0.46 km/km2 at SWS68 to 0.8 km/km2 at SWS47 (Supplementary Table 2). Among the sub-watersheds, 65 (68%) have less than 0.6 km/km2 Lo, referring to higher relief with steep slopes and shorter flow paths, which consequently causes high surface runoff and soil erosion.
4.4.5. Compactness coefficient (Cc)
The compactness coefficient (Cc) is defined as the ratio of the watershed perimeter to the circumference of the circular area equal to the watershed area (Arefin, Islam Mohir, and Alam Citation2020; Bendjoudi and Hubert Citation2002). The Cc closer to 1 indicates a more compact, circular shape, while values further from 1 suggest a more irregular or elongated shape. The Cc value of the river basin is 1.92 (). Moreover, sub-watershed Cc varies from the slightest record of 1.16 at SWS22 to the highest value of 1.82 at SWS85 (Supplementary Table 2). The Cc values for all sub-watersheds deviate from 1, indicating variations in the erosional potential of the land. Approximately 30% of sub-watersheds exhibit Cc values exceeding 1.5. Thus, the sub-watersheds with lower Cc (i.e. more circular or compact shapes) may have a more uniform distribution of water flow and sediment transport, potentially reducing the likelihood of erosion compared to sub-watersheds with higher Cc (i.e. more irregular or elongated shapes) where water may concentrate in specific areas, increasing erosion susceptibility.
Figure 9. Landscape/relief morphometry: (a) Absolute relief, (b) Relative relief, (c) Dissection index, (d) Relief ratio, (e) Ruggedness index, and (f) Ruggedness number.
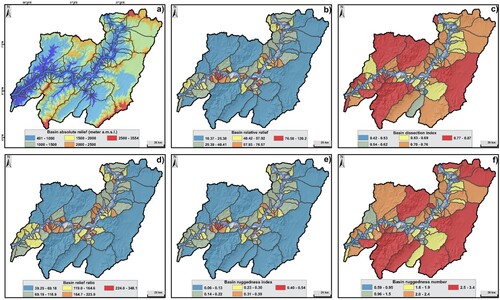
4.5. Landscape/relief morphometric parameters of the basin and sub-watersheds
Landscape/relief morphometric parameters refer to watersheds’ elevation and topographic features to analyze terrain characteristics. They are directly related to soil erosion, where the high rate of the parameters designates a higher risk of soil erosion and vice versa. The relief or landscape morphometry deals with three-dimensional parameters.
4.5.1. Basin absolute relief (Ar) and relative relief (Rr)
Absolute relief (Ar) refers to the maximum elevation of any region at the mean sea level. The Ar of the MOGR basin is 3554 m a.m.s.l ((a)). Relative relief (Rr) is the ratio of basin relief to the perimeter of the drainage basin (Melton Citation1957; W. R. Singh, Barman, and Tirkey Citation2021). It is the most reliable potential predictor of denudation rates (Gouri et al., Citation2013). There is a direct relationship between Rr and the denudational process of the watershed, where the more significant the Rr, the higher the denudational rate of the surface and vice versa. The calculated Rr of the MOGR river basin is 3.76, whereas the minimum and maximum Rr values of the sub-watersheds are recorded at SWS38 (10.37) and SWS9 (120.17), respectively ((b)). These varying Rr provide information about the local topographic variation within a landform feature and help assess its ruggedness or steepness (Melton Citation1957).
4.5.2. Relief ratio (Rh)
The relief ratio (Rh) is the ratio between basin relief and basin length. The higher Rh ratio represents the hilly relief and erodibility (Suresh and Krishnan Citation2022). The Rh of the MOGR basin is 15.41 ((d)). In comparison, the Rh for all sub-watersheds ranges from the lowest value, 39.25, to the highest value, 348.08, at SWS46 and SWS40, respectively (Supplementary Table 2). The 41% of sub-watersheds show Rh exceeding 150, indicating an increased susceptibility to soil erosion and land degradation.
4.5.3. Dissection index (DI)
Dissection Index (DI) is the ratio between relative relief and absolute relief of the watershed (Melton Citation1957). On average, the values of DI vary between 0 (complete absence of vertical dissection/erosion and hence the dominance of flat surface) and 1 (in exceptional cases, cliffs, it may be at the steep escarpment of hill slope or the seashore) (Salvi et al. Citation2023). The DI for the river basin is 0.86, indicating the higher vertical escarpment and vertical dissection with a higher degree of runoff and soil erosion ((c)). Meanwhile, the DI of the sub-watershed varies from 0.42 at SWS3 to 0.87 at SWS2 (Supplementary Table 2). The result confirms that all sub-watersheds except SWS3, SWS48, and SWS14 of the MOGR basin have higher DI, indicating steeper escarpment and consequent soil erosion.
4.5.4. Ruggedness index (RI) and number (Rn)
The Ruggedness index (RI) is the ratio between the mean minimum ruggedness and the subtracted value of maximum and minimum ruggedness (Melton Citation1957). The RI expresses the elevation difference between adjacent cells of a DEM (Riley, DeGloria, and Elliot Citation1999). The quantitatively calculated RI of the MOGR basin is 0.03 (Supplementary Table 2). Moreover, sub-watershed RI ranges from 0.06 to 0.54 at SWS74 and SWS9, respectively ((e)). The Ruggedness number (Rn) is computed from the watershed's basin relief and drainage density (Schumm Citation1956). It expresses the terrain's structural complexity and measures the surface's unevenness. The higher the Rn, the higher the surface unevenness and higher erosional intensity (Strahler Citation1957). The Rn of the MOGR basin is 3.61, which confirms that the river basin has higher structural complexity and rough surface with higher erosion sensitivity ((f)). The Rn value of the sub-watersheds ranges from 0.59 to 3.37(Supplementary Table 2).
4.6. Land use/land cover and soil erosion
The classified land use/land cover types indicate that more than 50% of the river basin is dominated by shrubland, which includes scrubs, range lands, and small woody and bush grounds (). Scrublands typically have shallow root systems and sparse canopy cover, making them less effective at preventing erosion than forests or grasslands. Moreover, intense rainfall and runoff, especially during intense rain storms, lead to significant soil erosion in the different sub-watersheds of the MOGR basin. Furthermore, the rangelands in various areas are primarily used for grazing livestock in the MOGR basin. Thus, overgrazing and improper management of rangelands can lead to vegetation degradation, soil compaction, and increased vulnerability to erosion in different sub-watersheds (). The agricultural land use is the following dominant coverage, accounting for 26% of the MOGR basin. This land use is mainly distributed across the upper parts of the MOGR basin, where dense rural settlements are dominated.
Figure 10. Land use land cover types and their effects on soil erosion.
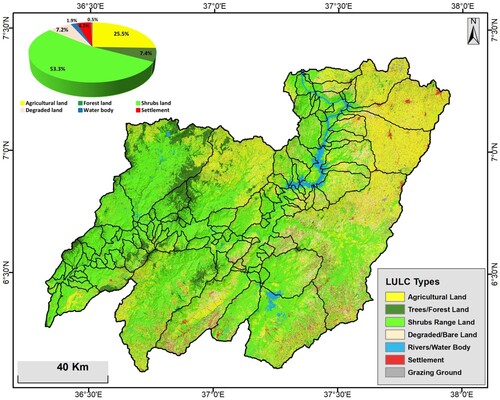
Moreover, intensive agricultural practices such as monoculture cropping and overcultivation in different sub-watersheds can lead to increased soil erosion. Additionally, bare soil between crop cycles is highly susceptible to erosion. The sub-watersheds with dominant bare grounds, cultivation, grazing lands, and settlement land uses exhibit higher rates of soil erosion and land degradation problems (). In the MOGR basin, the sub-watersheds around the northern, northeastern, and northwestern sides have higher effects of land cover and management practices, indicating a higher rate of soil erosion occurrences. However, dense trees and forest cover predominantly occupy the central, southern, and southwestern areas, resulting in lower soil erosion and land degradation effects. These results are consistent with the geomorphometric parameters of the MOGR basin.
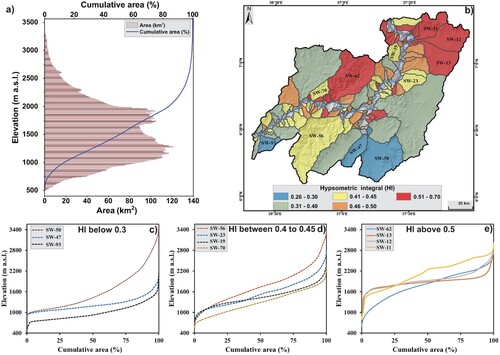
4.7. Hypsometry analysis of the basin and sub-watersheds
Hypsometry encompasses measuring and analyzing the altitude and basin area relationship to comprehend the degree of surface dissection and watershed development stages (Strahler Citation1957). Differences in the shape of the curve and the HI value are related to the degree of disequilibrium in the balance of erosive and tectonic forces (Weissel, Pratson, and Malinverno Citation1994). Hypsometric curves are non-dimensional measures of the proportion of the catchment area above a given peak (Strahler Citation1957). It is premeditated by considering relative height and relative area. It is obtained by plotting the relative area along the abscissa (x-axis) and relative elevation along the ordinate (y-axis). The hypsometric curve of the MOGR basin and most of the sub-watersheds with HI below 0.45 are S-shaped ((b)), which shows that the basin is at the equilibrium stage of development. Whereas some sub-watersheds with HI values greater than 0.5 have convex shapes that are more sensitive to soil erosion (O. Singh, Sarangi, and Sharma Citation2008). Therefore, HI helps prioritize the sub-watersheds based on the degree of soil erodibility when proposing soil and water conservation activities. Strahler (Citation1957) states that the HI value ≥0.6 shows youth stage/convex upward curves. The HI value between 0.35-0.6 represents the mature or equilibrium stage of the watersheds with an S-shaped curve line ((d)). The HI value ≤0.35 shows the old (monadnock) or peneplain stage of the watersheds with concave or downward curve shapes ((c)). The watershed in the youthful stage is more susceptible to erosion than the equilibrium or mature stage. The HI value of the MOGR basin ranges from 0.26-0.7, and the mean value is 0.45 referring to the increased susceptibility of sub-watersheds to soil erosion ((b)). The lowest values of HI and more concave curves are located in the southern part of the MOGR basin ((b)). Therefore, this area could represent a more mature stage perhaps due to a longer time of fluvial activity according to Strahler's landscape evolution model (Strahler Citation1957).
Figure 11. Hypsometry of the study area: (a) Hypsometric curve, (b) Hypsometric Integral, (c) Sub-watersheds with HI < 0.3, (d) Sub-watersheds of HI 0.4-0.45, and (e) Sub-watersheds with HI >5.
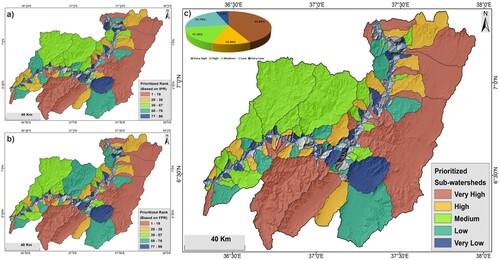
4.8. Prioritization of sub-watersheds
The study prioritizes sub-watersheds based on geomorphometric parameters and correlation coefficient matrix. The IPR is based on 17 geomorphometric parameters directly and inversely related to soil erosion and land degradation (Supplementary Table 3). Linear, areal, and landscape/relief morphometric parameters are directly related to soil erodibility, while shape morphometric parameters are inversely related. The last IPR ranking is determined by computing CF values from the preliminary ranking using the procedure expressed in Equation 2, and the results are presented in Supplementary Table 3. The top ten sub-watersheds with the highest IPR ranking are SWS75, SWS2, SWS56, SWS25, SWS24, SWS94, SWS55, SWS32, SWS68, and SWS67 ((a)). These sub-watersheds have the highest soil erosion susceptibility and land degradation, requiring critical watershed management practices. The least prioritized sub-watersheds based on IPR are SWS9, SWS59, SWS49, SWS14, SWS37, SWS27, SWS36, SWS26, SWS53, SWS48, and SWS85 (Supplementary Table 3). The final prioritization of sub-watersheds in the MOGR basin involves computing a WCF for each parameter, estimating WSP ranking values, and assigning soil erosion priority classes as calculated using equation 4. The highest priority ranking ‘1’ is assigned for the lowest summation compound value, while the lowest priority ranking is assigned for the highest summation value, and so on. Therefore, in the MOGR basin, the highest priority ranking is assigned to SWS75 with a WSP value of 31.27, followed by SWS25, SWS2, SWS32, SWS94, SWS68, SWS13, SWS12, SWS67, and SWS17. The lowest priority ranking is assigned to SWS85, with a WSP value of 71.8 ((a)). The sub-watersheds within the MOGR basin are categorized into five priority classes, ranging from very high to very low soil erosion proneness, based on the WSP factor. This classification is determined using a GIS-based natural break technique or the Jenks method to minimize the variance within each group while maximizing the variance between groups. Thus, the sub-watersheds of the river basin can be classified as very high (31.27–44.94), high (44.55–49.72), medium (49.73–52.41), low (52.42–56.93), and very low (56.94–71.8) prioritization classes of soil erosion proneness and consequent land degradation ((c)). The WSP factor-based final priority classifications of sub-watersheds illustrate that 19 of all sub-watersheds fall under the very high soil erosion priority classes, which account for 43% of the land area, equivalently about 5,693 km2 of total area ((c)). Similarly, another 19 sub-watersheds corresponding to 1,673 km2 (13%) of the river basin's total area are classified under high-priority classes, and 17% of the basin's total area is categorized under medium-priority classification (Supplementary Table 5).
Figure 12. Soil erosion severity classification: (a) Initial priority ranking of sub-watersheds, (b) Final prioritization based on proneness to soil erosion, and (c) Soil erosion severity classes.
4.9. Result validation of sub-watershed prioritization
The validation of geomorphometric analysis and conclusive outcomes of sub-watershed prioritization are authenticated through the utilization of both correlation coefficient matrix (CCM) and general linear model (GLM). The descriptive statistical parameters, such as minimum, maximum, means, and standard deviations, were computed for all morphometric variables to assess statistical deviations and variations. The multivariate analysis of morphometric parameters using a GLM uses the partial Eta-squared (η2) value, which measures the effect size of different variables in the analysis of variance (ANOVA) models. Hence, most parameters utilized for analysis exhibit significant variance and effect size in influencing the concurrent output of individual variables. Moreover, the results of the prioritization of sub-watersheds are also validated by using a CCM computed between morphometric parameters as well as the inter-correlation among the effects of CF and WCF approaches applied for prioritization of sub-watersheds (). Upon examination of the correlation analysis of the variables, it is evident that there are strong positive and negative relationships among the morphometric parameters used in this study.
Table 3. Inter-correlations among prioritization variables.
Additionally, a strong, significant positive correlation exists between the CF and WCF and between the IPR and FPR ranking. This result arises from the significant positive correlation between morphometric parameters and the effectiveness of the CCM. This reaffirms the importance of the selected parameters in categorizing soil erosion and subsequent land degradation within the sub-watersheds. It is worth noting that SWS75 and SWS85 have been assigned the same priority ranking, with SWS75 ranked first ‘1’ and SWS85 ranked last ‘96’ in both the CF and WSP approaches (Supplementary Tables 3 & 5). This consistency highlights the effectiveness of the variables in classifying soil erosion severity. Overall, the results of this analysis demonstrate the strong inter-relationships among the geomorphometric parameters and the suitability of certain variables for assessing soil erosion and land degradation in the sub-watersheds.
5. Discussion
Several studies have been conducted in different regions of Ethiopia, e.g. Blue Nile Basin, Angered Watershed, Wondo Genet watershed, Dera Woreda, Omo-Gibe upper basins, and so on in North-Western, southern, and central parts of Ethiopia to prioritize sub-watersheds based on their susceptibility to soil erosion and land degradation (Bogale Citation2021; Ermias Citation2024; Gudu Tufa Citation2018; Mekuria Citation2023; Jothimani, Lawrence, and Dawit Citation2020; Mohammed, Adugna, and Takala Citation2018). These studies typically utilize morphometric parameters, GIS, and remote sensing technology to assess soil erosion risk and prioritize intervention areas. Moreover, in the upcoming years, Ethiopia is expected to face heightened vulnerability to soil erosion and land degradation, primarily due to the worsening of various factors such as climate change, population growth, anthropogenic pressure leading to deforestation, intensified inappropriate agricultural activities, inadequate land management practices, and uncontrolled urbanization. In light of this evidence, the purpose of the present study is to prioritize sub-watersheds of the MOGR basin, located in the south-central Ethiopian Highlands, based on various geomorphological characteristics. The geomorphological features were calculated using a more realistic geospatial technique and analyzed using the most appropriate non-subjective statistically computed WSP and morphometric techniques with supplementing soil/lithology, land use data, and field observations. Recognition of sensitive areas vulnerable to soil erosion is essential if appropriate land and water management strategies are established and enforced.
The MOGR basin, shaped by geological and geomorphological processes linked to the formation of the Great Rift Valley of Ethiopia, features rugged terrain influenced by ongoing endogenic and exogenic forces (Gathogo Citation2017). This terrain, characterized by fault features, is highly susceptible to soil erosion and warrants further investigation ((a)). The mean HI value of 0.45 indicates the MOGR basin's later youth stage, reflecting the varied impact of fluvial and denudational processes on the terrain. The MOGR basin, with a total area exceeding 2,500 km2, falls within the category of a large watershed according to Strahler's classification criteria (Strahler Citation1957). However, the MOGR basin predominantly consists of small sub-watersheds with 3rd order streams vulnerable to soil erosion due to their sensitivity to high-intensity, short-duration rainfalls, posing a heightened risk of land degradation (Bogale Citation2021).
Figure 13. Relief features and associated effects: (A) Satellite image depicting the highlands and river valley, (B) Degraded gulley around Ajora waterfalls, and (C) Landslides along Hambaricho mountain.
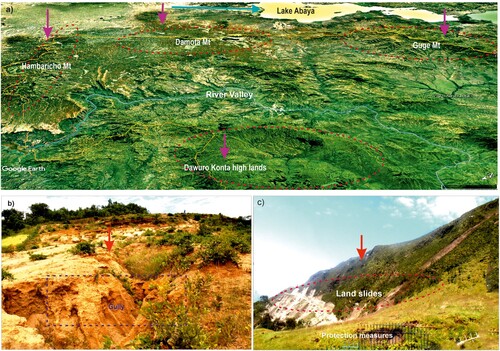
Moreover, the majority of sub-watersheds, along with the main OGR basin, exhibit shorter basin lengths and narrower widths, known to accelerate runoff and increase soil erosion potential in river channels, as evidenced by previous research (Anshumali1 Citation2019; Topno et al. Citation2022). The relief of the MOGR basin is characterized by the main river valley in the center, the Hambaricho, Damota, and Guge Mountain chains in the east, and the Dawuro-Konta highlands on the other side of the river basin ((a)). Significant variations in relief indicate increased surface runoff, weathering, and erosion rates within the sub-watersheds (Raja Shekar and Mathew Citation2024; Topno et al. Citation2022). Additionally, the orientation of the basin influences moisture distribution and evaporation rates, with west-facing slopes typically drier than east-facing slopes, which receive more rainfall and support greater vegetation (Bogale Citation2021; Schumm Citation1956). Moreover, over 60% of the study area exhibits slope gradients exceeding 20 degrees, accelerating runoff and soil erosion rates ((b)). This heightened slope steepness correlates with increased soil weathering and erosion, posing a significant risk of soil loss and degradation in most sub-watersheds (Mosbahi, Benabdallah, and Boussema Citation2013).
The linear morphometric parameters investigated in the MOGR sub-watersheds provide valuable insights into their physical structure, drainage network connectivity, and river system dynamics, influencing hydrological and geomorphological processes like erosion (Shekar et al. Citation2023). With higher proportions of U and Nu, the MOGR basin exhibits significant topographic influence on stream development. This configuration of drainage characteristics contributes to increased overland flow, indicated by higher Rb in the sub-watershed stream networks (Boitt and Bebeto Citation2020; Raja Shekar and Mathew Citation2024; Shekar et al. Citation2023). Specifically, 77% of sub-watersheds have Rbm exceeding 3, suggesting a higher stream branching, flash flood probability, and soil erodibility (Ojha et al. Citation2023). Similar research in Ethiopian watersheds, including the Upper Gibe catchment and Gilgal Abay watersheds, corroborates these findings, where Rbm ranged from 2.45 to 7.43 (Bogale Citation2021; Jothimani, Lawrence, and Dawit Citation2020; Mekuria Citation2023; Mohammed, Adugna, and Takala Citation2018; Tassew, Belete, and Miegel Citation2021). The study characterized the morphometric factors of drainage areas, highlighting their substantial contribution to soil erosion processes by directly shaping water flow dynamics and sediment transport within a watershed. For instance, the calculated Dd of the sub-watersheds ranges from 0.92 km/km2 to 1.60 km/km2, indicating lower to moderate Dd. This suggests slower water movement and reduced erosion potential, enabling water to spread over a larger area and infiltrate the soil more effectively. The prevalence of scrubland, range land, and agriculture areas with less forest cover in the MOGR basin suggests increased surface runoff and erosion despite lower Dd. This is due to fewer channels for water flow, leading to accumulation and concentration in certain areas (Arabameri et al. Citation2020; Wagh, Manekar, and Vallabhbhai Citation2021). As a result, localized erosion hotspots may develop, necessitating further investigation in future studies. Moreover, 30% of sub-watersheds exhibit higher Fs, suggesting a higher susceptibility to erosion processes. The findings reveal that 79% of sub-watersheds have lower Dt values, categorized as very coarse to coarse, with the remaining 21% having moderate to fine Dt values ((c)). Finer Dt creates more concentrated flow paths, intensifying water's erosive potential and accelerating erosion rates within the watershed (Mohammed, Adugna, and Takala Citation2018; Udaipur, Singh, and Yadav Citation2020). The study also revealed that most sub-watersheds possess a C value exceeding 0.5, suggesting a higher degree of susceptibility to soil erodibility and consequent land degradation as noted in Kulimushi et al. (Citation2022).
The examined shape morphometric parameters in the MOGR basin further elucidate characteristics influencing erosion susceptibility in the sub-watershed. For instance, approximately 60% of sub-watersheds have lower Sf, indicating higher water discharge in shorter time intervals and potentially efficient sediment disposal. Moreover, about 54% of sub-watersheds have an Rc of less than 0.5, potentially leading to irregular water flow distribution and increased erosion vulnerability ((b)). Furthermore, about one-third of sub-watersheds show lesser Re, suggesting steeper slopes that intensify runoff and erosive potential ((a)). The Lo ranging from 0.46 to 0.8 km/km², affects hydrological processes, with 68% of sub-watersheds having Lo below 0.6 km/km², indicating steep slopes and increased surface runoff and soil erosion in these sub-watersheds ((c)). The Cc varying from 1.16 to 1.82 indicates erosional potential, with higher Cc potentially leading to more uniform water flow and reduced erosion likelihood (Kadam et al. Citation2019).
Figure 14. Soil erosion status: (a) Degraded gully at Dubo village, (b) Satellite image depicting soil erosion, (c) Erosion-prone area at Wormuma village, and (d) degraded land after Deforested land in Senbeta catchment.
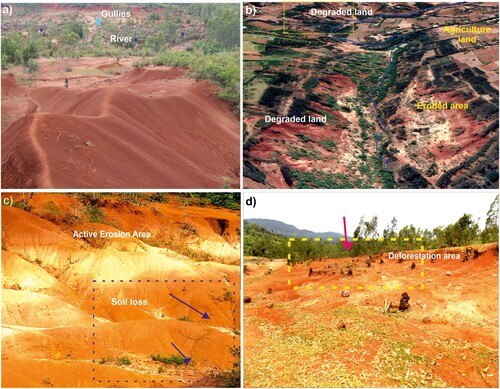
The study also examined landscape morphometric parameters concerning watershed erosion, focusing on elevation and topographic features. Results indicate that nearly half of the sub-watersheds have a DI exceeding 0.5, indicating steep slopes and elevation variations that increase erosion susceptibility. On the other hand, approximately 31% of the sub-watersheds exhibit higher topographic roughness and irregularities. Moreover, 30% of the sub-watersheds have a HI value >0.45, indicating a nearly immature basin development with a higher susceptibility to erosion and land degradation. Field observations across the MOGR basin confirm widespread challenges, including increased soil erosion, surface runoff, galleys, landslides, deforestation, and land degradation, primarily near river courses, mountain slopes, bare terrain, grazing areas, and farmlands ((a–c)).
The study utilized morphometric parameters and correlation coefficient matrices to prioritize sub-watersheds based on their susceptibility to soil erosion and land degradation. Initially, sub-watersheds on the eastern side of the main river channel were identified as highly susceptible, attributed to unstable landscapes, diverse slopes, and anthropogenic pressures. Further analysis using weighted sum factors and correlation matrices identified sub-watersheds on the northern, northeastern, eastern, and southeastern sides of the MOGR basin as having the highest soil erosion prioritization rankings. These areas exhibit increased surface runoff, topographic diversity, and soil erosion susceptibility. Out of the 96 sub-watersheds analyzed, 38 (56% of the total study area) located around the geographic coordinates of 6o15'58.79"- 7o17'16.76” N latitude and 37o15'24.87"- 37o38'05.04"E longitude are very high to highly susceptible to soil erosion and land degradation, requiring robust land management plans. Besides, 17% of the sub-watersheds fall under a medium-priority classification, while 20 sub-watersheds (5.5% of the basin) have very low soil erosion susceptibility due to dense vegetation and limited human activity. The intercorrelations between the morphometric parameters using GLM and a CCM validated the efficiency of morphometric parameters for sub-watershed prioritization. The results revealed a significant positive and negative correlation among various geomorphometric parameters with significance levels of 0.01 and 0.05 (Supplementary Table 4). These relationships validate their impact on geophysical processes and mutual reliance. The correlation analysis of the study supports the use of morphometric indicators in evaluating soil erosion and land degradation in the sub-watershed. Additionally, the multivariate analysis of the morphometric parameters conducted in the ANOVA's partial η2 reveals a significant proportion of variations accounted for by these parameters, demonstrating their strong influence.
Unlike previous studies, this study is the first in the region to analyze the maximum morphometric parameters, including hypsometric analysis to describe geophysical, hydrological, and environmental factors, and utilized a non-subjective statistically computed WSP approach for sub-watershed prioritization. Furthermore, the results of this study are consistent with research findings from other basins conducted in Ethiopian highlands (Ermias 2015; Gudu Tufa Citation2018; Jothimani, Lawrence, and Dawit Citation2020; Mekuria Citation2023; Mohammed, Adugna, and Takala Citation2018; Tassew, Belete, and Miegel Citation2021). For example, the study revealed that 38 sub-watersheds in the MOGR basin exhibit significant susceptibility to soil erosion and subsequent land degradation. Similar results were observed in the upper Gibe catchment of the OGR basin, where approximately 49% of sub-watersheds were at higher risk of soil erosion (Mohammed, Adugna, and Takala Citation2018). In addition, a study conducted in the Gojeb River basin, which is one of the sub-watersheds of the OGR, also classified over 30% of the research areas as being at a higher risk of soil erosion based on morphometric parameters.
Thus, these studies offer a valuable way of defining the priority areas to be identified for intervention to mitigate soil erosion. It provides a dynamic, cost-effective, sustainable alternative to conventional watershed prioritization approaches. The high to very high soil erosion-prone sub-watersheds identified in this study urgently require comprehensive watershed management strategies to mitigate the escalating risk of soil erosion and land degradation in the MOGR basin. It is recommended that government and non-government organizations implement various soil and water conservation practices such as terraces, soil bands, traditional rainwater harvesting methods like fanayaju, agronomic measures, vegetative practices, reforestation, and area closure techniques, mainly targeting farm and grazing lands, as well as bare or degraded lands. Furthermore, policy measures and exploring alternative options to alleviate population pressure and reduce dependency on limited land resources are essential considerations.
6. Conclusion
This study is the first in the region to analyses over 30 detailed morphometric parameters across 96 sub-watersheds in the MOGR basin to prioritize those prone to soil erosion and subsequent land degradation. It utilizes a geo-morphometric and statistical-based WSP approach in the GIS environment by integrating hypsometric analysis, lithology, land use/cover analysis, and field observations to enhance methodological reliability in assessing overall soil erosion patterns across the MOGR basin. The MOGR basin is situated in the southern part of the Ethiopian Highlands, where diverse lithological, land use/cover, and hydro-geomorphological characteristics cause the prevalence of soil erosion. This susceptibility is evaluated through various morphometric parameters and hypsometric analysis. Firstly, the linear geomorphometric parameters investigated in the study shed light on the dynamics of the river system and affected hydrological and geomorphic processes, including erosion. For instance, the MOGR basin's topography significantly influences stream development, increasing overland flow, as indicated by higher Rb in the sub-watershed stream networks. Notably, 77% of sub-watersheds have Rbm values exceeding 3, suggesting a higher degree of stream branching, flash flood probability, and soil erodibility. The studied drainage areal morphometric parameters emphasize their role in soil erosion by shaping water flow and sediment transport within watersheds (Ojha et al. Citation2023). For instance, the calculated Dd values for sub-watersheds range from 0.92 km/km² to 1.60 km/km², indicating slower water movement and reduced erosion potential. However, despite lower Dd, the prevalence of scrubland, range land, and agriculture areas with less forest cover in the MOGR basin suggests increased surface runoff and erosion and needs further investigation. Besides, 30% of sub-watersheds show higher Fs values, indicating increased susceptibility to erosion processes. The 21% of sub-watersheds have moderate to fine Dt values. Finer Dt intensifies water's erosive potential, accelerating erosion rates within the watershed (Boitt and Bebeto Citation2020). Moreover, the shape morphometric parameters studied in the MOGR basin reveal key characteristics influencing erosion susceptibility in sub-watersheds. For example, about 54% of sub-watersheds have Rc values below 0.5, potentially leading to irregular water flow distribution and increased erosion vulnerability. Moreover, one-third of sub-watersheds show lesser Re, indicating steeper slopes that intensify runoff and erosive potential. The 68% of sub-watersheds have Lo below 0.6 km/km², signifying steep slopes and increased surface runoff and soil erosion. Regarding landscape morphometric parameters, nearly half of the sub-watersheds have a DI exceeding 0.5, indicating steep slopes and elevation variations that increase erosion susceptibility. 30% of sub-watersheds have a HI value >0.45, indicating nearly immature basin development with a higher susceptibility to erosion and land degradation. The integrated geomorphometric and statistical-based WSP approach prioritized 38 sub-watersheds among the studied 96 sub-watersheds as being very high to highly susceptible to soil erosion and land degradation in the MOGR basin. Most of the sub-watersheds with very high to high susceptibility to soil erosion are situated in the northeastern (e.g. SWS12, SWS13, SWS17) and eastern (SWS22, SWS25, SWS32, SWS38) part of the MOGR basin. However, certain sub-watershed (e.g. SWS46, SWS58, SWS67, SWS68, SWS75, SWS94) in the southern part are also classified within this very high to high susceptibility category of soil erosion potential. These identified sub-watersheds urgently need comprehensive watershed management strategies to combat escalating risks of soil erosion and subsequent land degradation in the MOGR basin. Moreover, the study's findings are valuable for water management decision-makers, enabling informed decisions, resource allocation, and targeted interventions to control soil erosion and protect water resources across this region. Furthermore, the study holds considerable importance in achieving various sustainable development goals in Ethiopia, including promoting sustainable land management, conserving natural resources, enhancing climate resilience, improving livelihoods, and aligning with the United Nations’ 2030 agenda for global sustainable development. Finally, the study recommends that forthcoming research should concentrate on quantifying soil erosion in the highly prioritized sub-watersheds across the MOGR basin. This entails utilizing soil loss estimation models in conjunction with field observations to improve the formulation of enhanced adaptive measures for combating soil erosion and land degradation throughout this region.
Supplemental Material
Download MS Word (153.1 KB)Acknowledgments
This work is supported by the fellowship of the Indian Council for Cultural Relations (ICCR), New Delhi, India. The authors gratefully acknowledge the support from the Central University of Punjab, Bathinda, for facilitating the execution of this research. Special thanks are extended to Prof. Omvir Singh (Dr) and Rajan Bhandari (Dr) for their invaluable contributions in critically editing the language of the research paper. The authors also express their gratitude to Wachemo University, Hossana, Ethiopia, for supporting the field data collection for this research endeavor.
Disclosure statement
No potential conflict of interest was reported by the author(s).
Data availability statement
The dataset for generating digital elevation data sources for this research was obtained from freely available Open topography databases (https://portal.opentopography.org/datasetMetadata).
References
- Adhikari, Sandeep. 2021. “Morphometric Analysis of a Drainage Basin: A Study of Ghatganga River, Bajhang District, Nepal.” The Geographic Base 7 (3): 127–144. https://doi.org/10.3126/tgb.v7i0.34280.
- Adiri, Zakaria, Rachid Lhissou, Lhou Maacha, Abdelhakim Jilali, El Hassan Talbi, Amine Jellouli, and Mohcine Chakouri. 2022. “Comparison of ASTER GDEM3, SRTM3, NASADEM, TanDEM-X90, AW3D30, and ALOS PALSAR Data with TanDEM-X12: A Case Study of Tagragra of Akka Inlier, Moroccan Anti-Atlas.” Arabian Journal of Geosciences 15 (1): 21. https://doi.org/10.1007/s12517-021-09290-7.
- Arabameri, Alireza, Wei Chen, Marco Loche, Xia Zhao, Yang Li, Luigi Lombardo, Artemi Cerda, Biswajeet Pradhan, and Dieu Tien Bui. 2020a. “Comparison of Machine Learning Models for Gully Erosion Susceptibility Mapping.” Geoscience Frontiers 11 (5): 1609–1620. https://doi.org/10.1016/j.gsf.2019.11.009.
- Arabameri, Alireza, John P. Tiefenbacher, Thomas Blaschke, Biswajeet Pradhan, and Dieu Tien Bui. 2020b. “Morphometric Analysis for Soil Erosion Susceptibility Mapping Using Novel Gis-Based Ensemble Model.” Remote Sensing 12 (5): 874–824. https://doi.org/10.3390/rs12050874.
- Arefin, Riad, Md Mohirul Islam Mohir, and Jahangir Alam. 2020. “Watershed Prioritization for Soil and Water Conservation Aspect Using GIS and Remote Sensing: PCA-Based Approach at Northern Elevated Tract Bangladesh.” Applied Water Science 10 (4): 1–19. https://doi.org/10.1007/s13201-020-1176-5.
- Bajocco, S., A. De Angelis, L. Perini, A. Ferrara, and L. Salvati. 2012. “The Impact of Land Use/Land Cover Changes on Land Degradation Dynamics: A Mediterranean Case Study.” Environmental Management 49 (5): 980–989. https://doi.org/10.1007/s00267-012-9831-8.
- Bendjoudi, Hocine, and Pierre Hubert. 2002. “Le Coefficient de Compacité de Gravelius: Analyse Critique d’un Indice de Forme Des Bassins Versants.” Hydrological Sciences Journal 47 (6): 921–930. https://doi.org/10.1080/02626660209493000.
- Berkhout, Ezra, Elie Kodsi, Maurits van den Berg, Michele Meroni6 Zeist, Willem-Jan van, Richard Mwandendu Stefan van der Esch, Felix Rembold, and Michael Cherlet. 2021. “Future Perspectives on Land for Eastern Africa.” UNDP.
- Bewket, W., and E. Teferi. 2009. “Assessment of Soil Erosion Hazard and Prioritization for Treatment at the Watershed Level: Case Study in the Chemoga Watershed, Blue Nile Basin, Ethiopia.” Land Degradation & Development 20 (6): 609–622. https://doi.org/10.1002/ldr.944.
- Biswas, Mery. 2015. “Morphometric And Landuse And Landcover Change Analysis Of Lokjuriya River Basin, Jharkhand, India Using Remote Sensing and Gis Technique.” IOSR Journal Of Humanities And Social Science (IOSR-JHSS) 20 (7): 77–85. https://doi.org/10.9790/0837-20757785.
- Bogale, Alemsha. 2021. “Morphometric Analysis of a Drainage Basin Using Geographical Information System in Gilgel Abay Watershed, Lake Tana Basin, Upper Blue Nile Basin, Ethiopia.” Applied Water Science 11 (7): 1–7. https://doi.org/10.1007/s13201-021-01447-9.
- Boitt, Mark, and Nyamwamu Bebeto. 2020. “Morphometric and Change Detection Analysis for Prioritization of Sub Basin Conservation, Case Study of Taita Hills.” 2020: 591–612. https://doi.org/10.4236/ijg.2020.1110031.
- Buckley, S. M., P. S. Agram, J. E. Belz, R. E. Crippen, E. M. Gurrola, M. Kobrick, M. Lavalle, et al. 2020. “NASADEM, National Aeronautics and Space Administration Jet.”
- Chaemiso, Shiferaw Eromo, Adane Abebe, and Santosh Murlidhar Pingale. 2016. “Assessment of the Impact of Climate Change on Surface Hydrological Processes Using SWAT: A Case Study of Omo-Gibe River Basin, Ethiopia.” Modeling Earth Systems and Environment 2 (4): 1–15. https://doi.org/10.1007/s40808-016-0257-9.
- Choto, Misganaw, and Aramde Fetene. 2019. “Impacts of Land Use/Land Cover Change on Stream Flow and Sediment Yield of Gojeb Watershed, Omo-Gibe Basin, Ethiopia.” Remote Sensing Applications: Society and Environment 14:84–99. https://doi.org/10.1016/j.rsase.2019.01.003.
- Chymyrov, Akylbek. 2021. “Comparison of Different DEMs for Hydrological Studies in the Mountainous Areas.” The Egyptian Journal of Remote Sensing and Space Science 24 (3): 587–594. https://doi.org/10.1016/j.ejrs.2021.08.001.
- Dagnachew, Melku, Asfaw Kebede, Awdenegest Moges, and Adane Abebe. 2020. “Land Use Land Cover Changes and Its Drivers in Gojeb River Catchment, Omo Gibe Basin, Ethiopia.” Journal of Agriculture and Environment for International Development 114 (1): 33–56. https://doi.org/10.12895/jaeid.20201.842.
- Dagne, Habtamu, Engdawork Assefa, and Ermias Teferi. 2024. “Mapping and Quantifying Land Degradation in the Omo-Gibe River Basin, South-Western Ethiopia.” African Geographical Review 43 (3): 452–466. http://dx.doi.org/10.1080/19376812.2022.2164023.
- Fenta, Ayele Almaw, Atsushi Tsunekawa, Nigussie Haregeweyn, Mitsuru Tsubo, Hiroshi Yasuda, Takayuki Kawai, Kindiye Ebabu, Mulatu Liyew Berihun, Ashebir Sewale Belay, and Dagnenet Sultan. 2021. “Agroecology-Based Soil Erosion Assessment for Better Conservation Planning in Ethiopian River Basins.” Environmental Research 195:110786. https://doi.org/10.1016/j.envres.2021.110786.
- Francis Lucazeau, Jean Emmanuel Hurtrez. 1997. “Geophysical Research Letters - 1997 - Lucazeau - Length-scale Dependence of Relief along the South Eastern Border of Massif.Pdf.” Geophysical Research Letters 24 (14): 1823–1826. https://doi.org/10.1029/97GL01673.
- Gajbhiye, Sarita, S. K. Mishra, and Ashish Pandey. 2014. “Prioritizing Erosion-Prone Area Through Morphometric Analysis: An RS and GIS Perspective.” Applied Water Science 4 (1): 51–61. https://doi.org/10.1007/s13201-013-0129-7.
- Gathogo, Patrick Nduru. 2017. “Geology of the Omo-Turkana Basin of Eastern Africa: Tectonics and Climate in the Evolution of a Pliocene and Pleistocene Sequence; A Report, The University of Utah Graduate School Statement.”
- Ghannadi, M. A., S. Alebooye, M. Izadi, and A. Ghanadi. 2023. “CASE STUDY : TEHRAN AND JAM CITIES). X (February, 19–22.”
- Ghosh, Prasanta Kumar, Ritendu Mukhopadhyay, and Narayan Chandra Jana. 2021. “Quantitative Analysis of Drainage Basin Parameters Towards Better Management of Damodar River, Eastern India.” Journal of the Geological Society of India 97 (7): 711–734. https://doi.org/10.1007/s12594-021-1753-8.
- Girma, Rediet, and Eshetu Gebre. 2020. “Spatial Modeling of Erosion Hotspots Using GIS-RUSLE Interface in Omo-Gibe River Basin, Southern Ethiopia: Implication for Soil and Water Conservation Planning.” Environmental Systems Research 9 (1): 1. https://doi.org/10.1186/s40068-020-0163-z.
- Gouri Sankar Bhunia, Sumita Gayen. 2013. “Morphometric Analysis of Kangshabati-Darkeswar Interfluves Area in West Bengal, India using ASTER DEM and GIS Techniques.” Journal of Geology & Geosciences 02 (04). http://dx.doi.org/10.4172/2329-6755.
- Gudu Tufa, Fayera. 2018. “Morphometric Analysis of Kito and Awetu Sub Basins Jimma, Ethiopia.” American Journal of Water Science and Engineering 4 (3): 80. https://doi.org/10.11648/j.ajwse.20180403.14.
- Horton, B. Y. Robert E. 1945. “Erosional Development of Streams and Their Drain- Age Basins; Hydro Physical Approach to Quantitative Morphology.” Geological Society of America Bulletin 56 (3): 275–370. https://doi.org/10.1130/0016-7606(1945)56[275:EDOSAT]2.0.CO;2.
- Horton, R E. 1955. “Erosional development of streams and their drainage basins, hydrophyrical approach to quantitative morphology.” Nihon Ringakkai Shi/Journal of the Japanese Forestry Society 37 (6): 257–262.
- Hossain, Akbar, Timothy J. Krupnik, and Jagadish Timsina. 2020. “Agricultural Land Degradation: Processes and Problems Undermining Future Food Security.” Environment, Climate, Plant and Vegetation Growth. https://doi.org/10.1007/978-3-030-49732-3.
- IPBES. 2018. “Summary for Policymakers of the Assessment Report on Land Degradation and Restoration of the Intergovernmental SciencePolicy Platform on Biodiversity and Ecosystem Services.”
- Jothimani, Muralitharan, Francis Lawrence, and Zerihun Dawit. 2020. “Morphometric Analysis and Prioritization of Sub-Watersheds for Soil Erosion Using Geomatics Technologies in Megech River Catchment, Lake Tana Basin, North Western Ethiopia.” Ethiopian Journal of Science and Sustainable Development 8 (1): 2021. https://doi.org/10.20372/ejssdastu:v8.i1.2021.225.
- Kadam, Ajaykumar K., Tasadoq H. Jaweed, Sanjay S. Kale, Bhavana N. Umrikar, and Rabindranath N. Sankhua. 2019. “Identification of Erosion-Prone Areas Using Modified Morphometric Prioritization Method and Sediment Production Rate: A Remote Sensing and GIS Approach.” Geomatics, Natural Hazards and Risk 10 (1): 986–1006. https://doi.org/10.1080/19475705.2018.1555189.
- Kanito, Dawit, Bobe Bedadi, and Samuel Feyissa. 2023. ““Sediment Yield Estimation in GIS Environment Using RUSLE and SDR Model in Southern Ethiopia.” Geomatics, Natural Hazards and Risk 14 (1), https://doi.org/10.1080/19475705.2023.2167614.
- Kant, Chander, Gulshan Kumar, and Ray Singh Meena. 2023. “Modeling Morphometric and Geomorphological Parameters of Mountainous River Basin for Water Resource Management Using Remote Sensing and GIS Approach.” Modeling Earth Systems and Environment 9 (2): 2151–2163. https://doi.org/10.1007/s40808-022-01614-0.
- Keddi Lencha, Beshir, and Awdenegest Moges. 2016. “Identification of Soil Erosion Hotspots in Jimma Zone (Ethiopia) Using GIS Based Approach.” Ethiopian Journal of Environmental Studies and Management 8 (2): 926. https://doi.org/10.4314/ejesm.v8i2.7S.
- Kirui, Oliver K., Alisher Mirzabaev, and Joachim von Braun. 2021. “Assessment of Land Degradation ‘on the Ground’ and from ‘Above.’.” SN Applied Sciences 3 (3): 1–13. https://doi.org/10.1007/s42452-021-04314-z.
- Klingenberg, Christian Peter. 2016. “Size, Shape, and Form: Concepts of Allometry in Geometric Morphometrics.” Development Genes and Evolution 226 (3): 113–137. https://doi.org/10.1007/s00427-016-0539-2.
- Kulimushi, Luc Cimusa, Janvier Bigabwa Bashagaluke, Pandurang Choudhari, Md Masroor, and Haroon Sajjad. 2022. “Novel Combination of Analytical Hierarchy Process and Weighted Sum Analysis for Watersheds Prioritization. A Study of Ulindi Catchment, Congo River Basin.” Geocarto International 37 (25): 8456–8494. https://doi.org/10.1080/10106049.2021.2002426.
- Kumar, Atul, Sunil Singh, Malay Pramanik, Shairy Chaudhary, Ashwani Kumar Maurya, and Manoj Kumar. 2022. “Watershed Prioritization for Soil Erosion Mapping in the Lesser Himalayan Indian Basin Using PCA and WSA Methods in Conjunction with Morphometric Parameters and GIS-Based Approach.” Environment, Development and Sustainability 24. https://doi.org/10.1007/s10668-021-01586-8.
- Magesh, N. S., N. Chandrasekar, and John Prince Soundranayagam. 2011. “Morphometric Evaluation of Papanasam and Manimuthar Watersheds, Parts of Western Ghats, Tirunelveli District, Tamil Nadu, India: A GIS Approach.” Environmental Earth Sciences 64 (2): 373–381. https://doi.org/10.1007/s12665-010-0860-4.
- Malik, Anurag, Anil Kumar, and Himanshu Kandpal. 2019. “Morphometric Analysis and Prioritization of Sub-Watersheds in a Hilly Watershed Using Weighted Sum Approach.” Arabian Journal of Geosciences 12 (1): 4. https://doi.org/10.1007/s12517-018-4180-4.
- Mekuria, Eyasu Tafese. 2023. “Assessment of Morphometric Characteristics of Gojeb Watershed, Omo-Gibe Basin, Ethiopia.” https://www.researchsquare.com/article/rs-2704581/v1.” https://doi.org/10.21203/Rs.3.Rs-2704581/V1, 1–17.
- Melton, Mark A. 1957. “An Analysis of the Relations Among Elements of Climate, Surface Properties, and Geomorphology.” Office of Naval Research Technical Report No. 11, no. 11: 99.
- Meseret, Dessalew. 2016. “Land Degradation in Amhara Region of Ethiopia: Review on Extent, Impacts and Rehabilitation Practices.” Journal of Environment and Earth Science 6 (1): 120–130. www.iiste.org.
- Mirzabaev, Alisher, Ephraim Nkonya, Jann Goedecke, Timothy Johnson, and Weston Anderson. 2016. “Global Drivers of Land Degradation and Improvement.” In Economics of Land Degradation and Improvement - A Global Assessment for Sustainable Development, 167–195. Springer International Publishing. https://doi.org/10.1007/978-3-319-19168-3_7.
- Mohammed, Aisha, Tamene Adugna, and Wakjira Takala. 2018. “Morphometric Analysis and Prioritization of Watersheds for Soil Erosion Management in Upper Gibe Catchment.” Journal of Degraded and Mining Lands Management 06 (01): 1419–1426. https://doi.org/10.15243/jdmlm.2018.061.1419.
- Montanarella Luca, Mohamed Badraoui, Victor Chude, I Costa, Saurinda Dos Santos Baptista, Tekalign Mamo, Martin Yemefack, et al. 2015. “Status of the World’s Soil Resources. Intergovernmental Technical Panel on Soils.” http://www.fao.org/3/a-i5199e.pdf.
- Mosbahi, Manel, Sihem Benabdallah, and Mohamed Rached Boussema. 2013. “Assessment of Soil Erosion Risk Using SWAT Model.” Arabian Journal of Geosciences 6 (10): 4011–4019. https://doi.org/10.1007/s12517-012-0658-7.
- Nachtergaele, Freddy, Riccardo Biancalani Fao, Sally Bunning, John Mcdonagh, Janie Rioux, and Anne Woodfine. 2011. “Land Degradation Assessment in Dry Land. Manual for Local Level Assessment. Planning and Methodological Approach, Analysis and Reporting.”.
- Nyssen, Jan, Jean Poesen, Sil Lanckriet, Miro Jacob, Jan Moeyersons, Mitiku Haile, Nigussie Haregeweyn, et al. 2015. “Land Degradation in the Ethiopian Highlands.” In World Geomorphological Landscapes, 369–385. Springer. https://doi.org/10.1007/978-94-017-8026-1_21.
- Ojha, Susil, Lila Puri, Suraj Prasad Bist, Arjun Prasad Bastola, and Bishwabandhu Acharya. 2023. “Watershed Prioritization of Kailali District through Morphometric Parameters and Landuse/Landcover Datasets Using GIS.” Heliyon 9 (6): e16489. https://doi.org/10.1016/j.heliyon.2023.e16489.
- Pike, Richard J., and Stephen E. Wilson. 1971. “Elevation-Relief Ratio, Hypsometric Integral, and Geomorphic Area-Altitude Analysis.” Geological Society of America Bulletin 82 (4): 1079. https://doi.org/10.1130/0016-7606(1971)82[1079:ERHIAG]2.0.CO;2.
- Prabhakaran, A., and N. Jawahar Raj. 2018. “Drainage Morphometric Analysis for Assessing Form and Processes of the Watersheds of Pachamalai Hills and Its Adjoinings, Central Tamil Nadu, India.” Applied Water Science 8 (1): 1. https://doi.org/10.1007/s13201-018-0646-5.
- Pushpam Kumar, Mesfin Tilahun, Eric Mungatana, Ashbindu Singh, and Aaron Vuola. 2015. “The Economics of Land Degradation in Africa Benefits of Action Outweigh the Costs.” isbn 978),?92-808?6064-1%5CnThis ELD report was published with the support of the partner organisations of the ELD Initiative and Deutsche Gesellschaft fu?r Internationale Zusammenarbeit (GIZ) GmbH on behalf of the German Federal Ministry for Economic Coop.
- Rahaman, S. Abdul, S. Abdul Ajeez, S. Aruchamy, and R. Jegankumar. 2015. “Prioritization of Sub Watershed Based on Morphometric Characteristics Using Fuzzy Analytical Hierarchy Process and Geographical Information System – A Study of Kallar Watershed, Tamil Nadu.” Aquatic Procedia 4 (1): 1322–1330. https://doi.org/10.1016/j.aqpro.2015.02.172.
- Rahman, Mohd Faizuddin Abd, Ami Hassan Md Din, Amalina Izzati Abd Hamid, Nor Surayatul Atikah Alihan, Nornajihah Mohd Yazid, Andi Mohd Hairy Ansar, Muhammad Faiz Pa’Suya, Siti Nurshahira Mohd Yamen, Nor Fadilla Khalid, and Muhammad Arif Husaini Junid. 2022. “Accuracy Assessment of Open-Source Global Digital Elevation Models (GDEMs) with Global Navigation Satellite System (GNSS) Levelling.” IOP Conference Series: Earth and Environmental Science 1064 (1), https://doi.org/10.1088/1755-1315/1064/1/012018.
- Rai, Praveen Kumar, Kshitij Mohan, Sameer Mishra, Aariz Ahmad, and Varun Narayan Mishra. 2017. “A GIS-Based Approach in Drainage Morphometric Analysis of Kanhar River Basin, India.” Applied Water Science 7 (1): 217–232. https://doi.org/10.1007/s13201-014-0238-y.
- Raja Shekar, Padala, and Aneesh Mathew. 2024. “Morphometric Analysis of Watersheds: A Comprehensive Review of Data Sources, Quality, and Geospatial Techniques.” Watershed Ecology and the Environment 6: 13–25. https://doi.org/10.1016/j.wsee.2023.12.001.
- Riley, Shawn J., Stephen D. DeGloria, and Robert Elliot. 1999. “A Terrain Ruggedness Index That Qauntifies Topographic Heterogeneity.” Intermountain Journal of Sciences 5 (1–4): 23–27.
- Saha, Tusar Kanti Hembram and Sunil. 2020. “Prioritization of Sub-Watersheds for Soil Erosion Based on Morphometric Attributes Using Fuzzy AHP and Compound Factor in Jainti River Basin, Jharkhand, Eastern India. Environ Dev Sustain 22, 1241–1268 (2020).” Environment, Development and Sustainability 22:1241–1268. https://doi.org/10.1007/s10668-018-0247-3.
- Salvi, Sahil, Sudarshan Bobade, Anuja Rajgopalan, and Suraj Ahire. 2023. “Morphometric Analysis of Sina River Basin At Midsangavi Using Rs & Gis” 12 (5): 2630–52. https://doi.org/10.48047/ecb/2023.12.si5.2592023.04/07/2023.
- Samuel Gebreselassie, Oliver K. Kirui, and Alisher Mirzabaev. 2016. “Economics of Land Degradation and Improvement in Ethiopia.” In Economics of Land Assessment for Improvement – A Global Degradation and Sustainable Development 30.
- Santillan, Jojene R., Meriam Makinano-Santillan, and Ronald M. Makinano. 2016. “Vertical Accuracy Assessment of ALOS World 3D - 30M Digital Elevation Model over Northeastern Mindanao, Philippines.” International Geoscience and Remote Sensing Symposium (IGARSS) 2016-Novem (February 2018): 5374–77. https://doi.org/10.1109/IGARSS.2016.7730400.
- Schumm. 1956. “Evolution of Drainage Systems and Slopes in Badlands at Perth Amboy, New Jersey.” Bulletin of The Geological Society of America Evolution 67 (6): 597–646. https://www.ptonline.com/articles/how-to-get-better-mfi-results.
- Shekar, Padala Raja, Aneesh Mathew, P. S. Arun, and Varun P. Gopi. 2023. “Sub-Watershed Prioritization Using Morphometric Analysis, Principal Component Analysis, Hypsometric Analysis, Land Use/Land Cover Analysis, and Machine Learning Approaches in the Peddavagu River Basin, India.” Journal of Water and Climate Change 14 (7): 2055–2084. https://doi.org/10.2166/wcc.2023.221.
- Singh, W. R., S. Barman, and G. Tirkey. 2021. “Morphometric Analysis and Watershed Prioritization in Relation to Soil Erosion in Dudhnai Watershed.” Applied Water Science 11 (1): 9. https://doi.org/10.1007/s13201-020-01333-w.
- Singh, Omvir, Arjamadutta Sarangi, and Milap C Sharma. 2008. “Hypsometric Integral Estimation Methods and Its Relevance on Erosion Status of North-Western Lesser Himalayan Watersheds Hypsometric Integral Estimation Methods and Its Relevance on Erosion Status of North-Western Lesser Himalayan Watersheds,” no. November. https://doi.org/10.1007/s11269-008-9242-z.
- Strahler, Arthur N. 1957. “Quantitative Analysis of Watershed Geomorphology.” Eos, Transactions American Geophysical Union 38 (6): 913–920. https://doi.org/10.1029/TR038i006p00913.
- Strand, Robert I., and Ernest L. Pemberton. 1982. “Reservoir Sedimentation Technical Guidelines for Bureau of Reclamation.” US Bureau of Reclamation, Denver, Colorado 15 (7): 48.
- Subhash Chavare, Sambhaji D. Shinde. 2013. “Morphometric Techniques.” International Journal of Geomatics and Geosciences 4 (1): 224–231. https://www.researchgate.net/publication/265163916.
- Suresh, S., and P. Krishnan. 2022. “Morphometric Analysis on Vanniyar Basin in Dharmapuri, Southern India, Using Geo-Spatial Techniques.” Frontiers in Remote Sensing 3:1–23. https://doi.org/10.3389/frsen.2022.845705.
- Tadono, T., H. Ishida, F. Oda, S. Naito, K. Minakawa, and H. Iwamoto. 2014. “Precise Global DEM Generation by ALOS PRISM.” ISPRS Annals of the Photogrammetry, Remote Sensing and Spatial Information Sciences II 4:71–76. https://doi.org/10.5194/isprsannals-ii-4-71-2014.
- Takaku, Junichi, Takeo Tadono, and Ken Tsutsui. 2014. “Generation of High Resolution Global DSM from ALOS PRISM.” The International Archives of the Photogrammetry, Remote Sensing and Spatial Information Sciences XL-4 (4): 243–248. https://doi.org/10.5194/isprsarchives-XL-4-243-2014.
- Tassew, Bitew G., Mulugeta A. Belete, and K. Miegel. 2023. “Assessment and Analysis of Morphometric Characteristics of Lake Tana Sub-Basin, Upper Blue Nile Basin, Ethiopia.” International Journal of River Basin Management 195–209. https://doi.org/10.1080/15715124.2021.1938091.
- Tesfaye, Gizaw. 2018. “Soil Erosion Modeling Using GIS Based RUSEL Model in Gilgel Gibe-1 Catchment, South West Ethiopia.” International Journal of Environmental Sciences & Natural Resources 15:5. https://doi.org/10.19080/ijesnr.2018.15.555923.
- Topno, Amit Raj, Mintu Job, Dinesh Kumar Rusia, Vibhanshu Kumar, Birendra Bharti, and Samuel David Singh. 2022. “Prioritization and Identification of Vulnerable Sub-Watersheds Using Morphometric Analysis and an Integrated AHP-VIKOR Method.” Water Supply 22 (11): 8050–8064. https://doi.org/10.2166/ws.2022.303.
- Udaipur, Engineering, P. K. Singh, and K. K. Yadav. 2021. Assessment of Surface Runoff Using ArcSWAT for Rela Watershed, Rajasthan, India.” Journal of Geography, Environment and Earth Science International 24 (10): 22–32. https://doi.org/10.9734/jgeesi/2020/v24i1030260.
- UNCCD. 2020. “Land Degradation Neutrality Resilience at Local, National and Regional Levels.”.
- UNEP. 2023. “United Nations Environment Programme (UNEP).” Dictionary of Ecological Economics: Terms for the New Millennium. https://doi.org/10.4337/9781788974912.U.7.
- Venkatesh &, Anshumali. 2019. “A GIS-based assessment of recent changes in drainage and morphometry of Betwa River basin and sub-basins, Central India.” Applied Water Science 9, 157: 1–12. https://doi.org/10.1007/s13201-019-1033-6.
- Verma, Narender, Ramesh Kumar Patel, and Pandurang Choudhari. 2023. “Watershed Prioritization for Soil Conservation in a Drought Prone Watershed of Eastern India: Tel River Basin, Odisha.” Geology, Ecology, and Landscapes 405–418. https://doi.org/10.1080/24749508.2021.2022830.
- Wagh, Santosh, Vivek Manekar, and Sardar Vallabhbhai. 2021. “A GIS Based Morphometric Analysis of Watershed for Soil Erosion Planning.” https://doi.org/10.21203/rs.3.rs-795826/v1.
- Weissel, Jeffrey K., Lincoln F. Pratson, and A. Malinverno. 1994. “The Length-Scaling Properties of Topography.” Journal of Geophysical Research: Solid Earth 99 (B7): 13997–14012. https://doi.org/10.1029/94jb00130.
- Wischmeier and Smith. 1978. “Predicting Rainfall Erosion Losses. A Guide to Conservation Planning. Supersedes Agriculture Handbook No. 282, Science and Education Administration United States Department of Agriculture in Cooperation with Purdue Agricultural Experiment Station.”
- Wubie, Abebe Mengaw. 2015. “GIS Based Land Degradation Assessment for Sustainable Land Management: The Case of Bench Maji Zone, Ethiopia, Africa.” International Journal of Research and Innovations in Earth Science 2 (2): 2394–1375.
- Yesuf, Mahmud, M. K. Mohammed, A. Berresaw, and J. Pender. 2007. Cost of Land Degradation in Ethiopia : A Critical Review of Past Studies. Vol. 7939, 1–84. World Bank Publications.
- Ziadat, F. M., P. Zdruli, S. Christiansen, L. Caon, M. Abdel Monem, and T. Fetsi. 2021. “An Overview of Land Degradation and Sustainable Land Management in the Near East and North Africa.” Sustainable Agriculture Research 11 (1): 11. https://doi.org/10.5539/sar.v11n1p11.