
ABSTRACT
Infectious prions are resistant to degradation and remain infectious in the environment for several years. Chronic wasting disease (CWD) has been detected in cervids inhabiting North America, the Nordic countries, and South Korea. CWD-prion spread is partially attributed to carcass transport and disposal. We employed a forensic approach to investigate an illegal carcass dump site connected with a CWD-positive herd. We integrated anatomic, genetic, and prion amplification methods to discover CWD-positive remains from six white-tailed deer (Odocoileus virginianus) and, using microsatellite markers, confirmed a portion originated from the CWD-infected herd. This approach provides a foundation for future studies of carcass prion transmission risk.
Main text introduction
Forensic anthropological investigations have been solving human remains mysteries since the 19th century, with early pioneers developing methodologies that focused on anatomy and physical anthropology to solve crimes [Citation1]. Subsequent technological innovations have revolutionized forensic investigation, and the field of forensic science has progressed with key discoveries facilitating ultrasensitive DNA [Citation2,Citation3] and protein [Citation4] recovery from skeletal remains and surfaces. Because of these breakthroughs, 21st century forensics has the ability to answer biological and legal questions with remarkable accuracy and precision.
Despite the benefits of using animal models for human remains studies, animal-focused forensic investigations have lagged behind their human counterparts in the adoption of advanced technologies for veterinary forensics. In recent years, technologically advanced molecular, genetic, chemical, and statistical analyses of human applications have benefited investigations in the realm of conservation [Citation5] and wildlife mortality [Citation6]. Molecular and genetic advances have great utility in cases of animal abuse [Citation7], illegal animal trade and hunting [Citation8,Citation9], meat fraud [Citation10], and disease outbreaks [Citation11]. A key benefit of these technological advancements in many of these cases is the ability to collect salient information from samples of poor quality (e.g., low volume, degraded genetic material, contamination). Overall, the integration of classic and cutting-edge forensic techniques has great potential for broader application in veterinary forensic investigations.
Integrated forensic methods can enhance investigations that uphold regulations and control wildlife diseases. One such scenario is the management of chronic wasting disease (CWD). CWD is a contagious, 100% fatal neurodegenerative disease affecting cervids [Citation12] and is caused by a self-templating misfolded infectious form of the prion protein (PrPSc) [Citation13] that is shed through bodily fluids [Citation14], excrement [Citation15], and carcass decomposition [Citation16]. A combination of direct (cervid to cervid) and indirect (environmental) transmission contributes to the spread of CWD. Currently, CWD has been reported in five Canadian provinces, 32 American states, South Korea, and Nordic countries. Because PrPSc is highly resistant to degradation and weathering [Citation12,Citation13,Citation17,Citation18], it can remain within a given environment for substantial periods of time, leading to long-term environmental contamination. Multi-year environmental persistence [Citation16,Citation19,Citation20] and low-dose infection [Citation21] of PrPSc provide the logic behind regulations restricting carcass movement and disposal. Despite CWD-associated regulations, compliance is not absolute [Citation22], leading to scenarios in which veterinary forensics is a necessary addition for the management of CWD.
Official methods for the diagnosis of CWD include immunohistochemistry (IHC) and enzyme-linked immunosorbent assay (ELISA) and are effective for the detection of PrPSc in lymphoid and nervous tissues in live or freshly dead cervids. However, these immunodiagnostic methods have limited sensitivity and have not been validated for the detection of PrPSc in degraded tissues or atypical biological samples (i.e., non-lymphoid or non-nervous tissue) [Citation23]. Real-time quaking-induced conversion (RT-QuIC) is a prion detection assay developed for PrPSc of multiple prion diseases (e.g., CWD, scrapie, Creutzfeldt-Jakob Disease) [Citation24–26]. When compared to IHC and ELISA detection of PrPSc, RT-QuIC displays orders of magnitude greater level of laboratory sensitivity [Citation27] and similar levels of sensitivity at the population level under field conditions [Citation28]. Additionally, RT-QuIC is utilized for PrPSc detection in more diverse sample types than ELISA and IHC, such as faeces [Citation15], saliva [Citation14], urine [Citation14], and other tissues, including those that have undergone degradation [Citation24,Citation29–32].
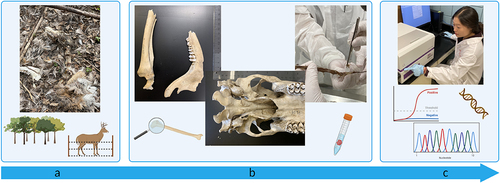
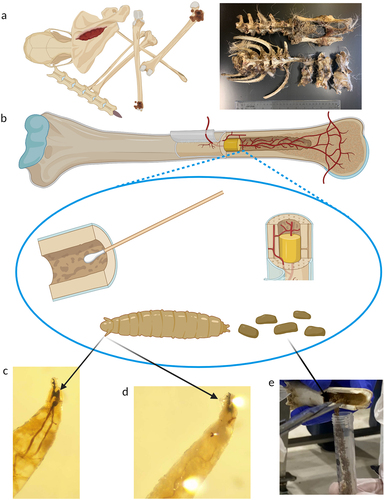
This veterinary forensics case study centres on CWD-prion detection, white-tailed deer (WTD; Odocoileus virginianus) genetics, and epidemiology associated with an illegal deer carcass disposal site (herein, dump site) of a CWD-positive captive deer facility. We employed an interdisciplinary forensic approach () to 1) determine the presence of CWD in carcass remains and associated biological materials, and 2) genetically-link the deer remains to the source herd. Our approach, termed here as ‘prion forensics,’ has applications in CWD management as a template for forensic investigations associated with other prion diseases.
Figure 1. Schematic of the chronic wasting disease (CWD) forensic analysis process. (a) Carcasses and remains were discovered at an illegal carcass dump site and within a white-tailed deer (WTD, Odocoileus virginianus) captive facility. Specimens were collected from both locations. (b) Specimens were anatomically assessed, age of the animals at time of death was estimated, and biological samples were collected. (c) Biological samples were tested through genetic and prion amplification methods. Data was analysed for the presence of CWD-causing prions, species identification, and the genetic relationship between individual samples and populations of WTD.
Results
Captive cervid facility investigation
In May 2021, a herd of 54 WTD was depopulated following CWD diagnosis in a single mortality (Supplementary Table S1). At the time of depopulation, official sampling and IHC testing were performed by the U.S. Department of Agriculture Animal and Plant Health Inspection Service (USDA-APHIS), which resulted in the detection of infection in 22% (n = 12) of the herd. Remains were discovered at the time of depopulation within the captive facility. These remains included individual intact bones, partial carcasses, and a whole carcass, suspected to represent at least three adults and five fawns aged <1 year. Using samples from which intact DNA could be extracted, we identified the individual deer (n = 8) that contributed to these remains using microsatellite analysis [Citation33]. Official USDA-APHIS and Minnesota Board of Animal Health (MN BAH) ear tag identification was present on one fully intact adult carcass (investigation sample ID = 66). One part of the carcass of an adult (ID = 55) included the midthoracic spinal column to the pelvis. Another partial carcass of an adult (ID = 65) included several cervical vertebrae that were attached to the head. We identified five adult long bones (IDs = 60 tibia, 61 femur, 62 metacarpal, 63 femur, and 64 femur). The adult partial carcasses and long bones may have been from the same animal(s) but that was indeterminate due to degraded DNA. The adult long bones were obtained from at least two animals, as there were two right femurs. Official identification was present in three nearly intact fawn carcasses (IDs = 57, 58, 59). Remains from two additional fawns included ribcage/thoracic vertebrae (ID = 53) and a nearly fully intact carcass (ID = 56). An articulated right rear leg from a fawn was identified (ID = 54) and confirmed to be the same animal as a partial carcass (ID = 56) via microsatellite analysis.
We used several methods to assess the age of WTD carcasses at the time of death. One adult carcass and three fawn carcasses contained official identification. Associated records revealed that the age of the animals at the time of discovery was seven years and 12 months. We estimated age at the time of mortality and assigned age classes (i.e., fawn < 1 year; yearling 1–2 years; adult > 2 years) to all remains through tooth eruption/replacement, tooth wear, epiphyseal closure of long bones, and size comparison [Citation34–36].
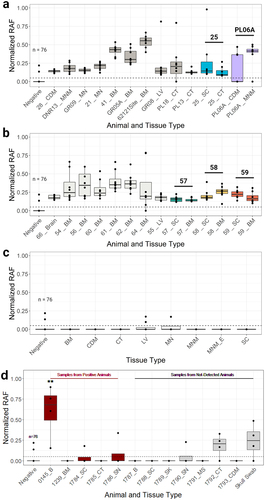
Because the remains were in various stages of decomposition, they were screened for CWD by RT-QuIC and not by IHC or ELISA. We tested 23 samples from the eight plus individuals, which included combinations of spinal cord (n = 6), bone marrow (n = 10), fly larvae within the spinal cord dura mater (n = 1), cranial dura mater (n = 2), connective tissue (n = 1), brain (n = 1), parotid lymph node (n = 1), and medial retropharyngeal lymph nodes (MRPLN, n = 1). Fourteen samples, representing at least six individuals, produced statistically significant prion seeding activity, indicating CWD positivity in the spinal cord (IDs = 57, 58, 59), bone marrow (IDs = 54, 56, 57, 58, 59, 60, 61, 62, 64), fly larvae (IDs = 55), and brain (ID = 66). These represented at least two adults and four fawns (, Supplementary Table S1). It was unclear whether the partial remains from CWD-positive adults (IDs = 55, 64) were from unique individuals, as the DNA was too degraded for genetic analysis.
Figure 2. Samples demonstrating prion seeding via RT-QuIC. The normalized rate of amyloid formation (RAF) was utilized for a more direct, accurate way to visually compare the rates of reactions across multiple plates. The average RAF of positive plate controls on all plates has an equal hypothetical value of 1/h. RAF of negative control wells across all plates are presented as ‘Negative’. (a, b) Normalized RAF was plotted using data collected across multiple 96-well plates from CWD-positive samples from white-tailed deer remains at the carcass dump site and the captive facility, respectively. All samples shown exhibited amyloid seeding activity deemed statistically significant by Mann-Whitney U-test and Dunnett's test (p < 0.01) as compared to the negative control for each 96-well plate. Samples from the same animal are indicated by the animal ID above the associated, coloured box and whisker plots. (c) Normalized RAF was plotted using data collected across multiple 96-well plates from a subset of the CWD-negative samples from remains at the carcass dump site, which are the same sample types as CWD-positive samples in panels a and b (for direct comparison), and includes a non-cervid sample (MNM_E). (d) Normalized RAF was plotted using data collected across multiple 96-well plates from samples representing controls from CWD-positive (‘Samples from Positive Animals’) and CWD-not-detected (‘Samples from Not-Detected Animals’) white-tailed deer as determined by IHC and/or ELISA on medial retropharyngeal lymph node and/or obex. Alphanumeric identifiers associated with each dump site sample represent a location designation, where a set of or single bones were recovered. The numeric identifiers within the captive facility represent individually identified carcasses or carcasses parts within the captive facility. Alphanumeric identifiers associated with each control sample represent a laboratory identifier. The horizontal dashed line represents the average RAF minus one standard deviation of a statistically significant (RT-QuIC and ELISA) CWD-positive WTD parotid lymph node for a relative comparison of RAF. **=statistically significant by Mann-Whitney U-test and Dunnett's test (p < 0.01) as compared to the negative control, BM=bone marrow. CDM=cranial dura mater, CT=connective tissue, MS=muscle, LV=larvae, B=Brain, MN=mandibular nerve, MNM=maxilla; neurocranium, MNM_E=maxilla; neurocranium equine, SC=spinal cord, SN=sciatic nerve, SK=skin. Normalized RAF = true RAF of sampled well/normalization factor calculated from positive plate controls.
Field site investigation
A publicly owned property located 1.5 km from the aforementioned captive facility was used by the captive herd owner to dispose of carcasses (i.e., the dump site). Site investigations were conducted in spring, summer, and fall in 2021 to locate and retrieve carcass materials. The remains were distributed among 45 locations across approximately six hectares and consisted of over 200 specimens of hair, skin, bones, and partial carcasses that included scant soft tissue material (Supplementary Table S2). We identified a group of specimens (location PL21; Supplementary Table S2) as equine based on the morphology of several molars and a distal phalanx. All other specimens were determined to be WTD based on hair identification, anatomical and morphological bone structure, and genetic analysis. We estimated the age class at the time of mortality based on tooth eruption/replacement, tooth wear, and epiphyseal growth plate closure. The 44 WTD locations included nine with adult remains, three with yearling remains, 19 with fawn remains, and 13 with remains from deer of unknown age. We estimated that at least 11 WTD carcasses were deposited solely on the maxilla or neurocranium; these included three adults, one yearling, six fawns, and one of unknown age. Genetic analysis revealed that the right scapula from location GR06 and the right humerus from location GR05A were from the same animal. Further genetic connections across locations were not possible because of degraded DNA. Three adult bones from three locations (atlas from PL06B, cervical vertebrae from 62,121, and occipital condyle from PL09A) appeared to have knife marks [Citation37], likely resulting from partitioning of the carcasses (Supplementary Figure S1).
We tested the biological materials from 56 samples obtained from 40 distinct specimens at 32 locations for CWD-PrPSc using RT-QuIC. Samples included spinal cord/spinal cord dura mater (n = 6), bone marrow (n = 11), mandibular nerve (n = 4), neurocranial cavity swab (n = 7), cranial dura mater (n = 4), muscle (n = 2), fly larvae/frass (n = 2), connective tissue (n = 14), skin (n = 3), and long bone medullary cavity swab (n = 3). Fourteen of the 56 samples produced statistically significant RT-QuIC prion seeding activity, indicating at least six CWD-positive animals, as identified by microsatellite and morphological analysis: two adults, one yearling, and three fawns (, Supplementary Table S2). The positive samples included 62,121 bone marrow, GR08 fly larvae, 041 bone marrow, 021 mandibular nerve, 025 spinal cord/spinal cord dura mater, 025 connective tissue, 028 cranial dura mater, DNR13 neurocranial cavity swab, GR05A bone marrow, GR09 mandibular nerve, PL06A neurocranial cavity swab, PL06A cranial dura mater, PL13 connective tissue, and PL18 connective tissue. The larvae were subsequently identified as Liopiophila varipes and Piophila nigriceps (personal communication J. Oliver and L. Lindsay).
Sample control experiments
To determine that CWD prion could be detected by RT-QuIC without interference from these degraded biological materials, we spiked nine field samples with a CWD-positive WTD palatine tonsil homogenate (ID = 1268-P) collected from a depopulated animal in the captive cervid facility. Compared to the 1268-P RT-QuIC reaction alone, samples 1218 (bone marrow), 1233 (connective tissue), 1225 (parotid lymph node), and 1226 (medial retropharyngeal lymph node) inhibited the reaction rate; sample 1059 (spinal cord) demonstrated no change in the reaction rate; and samples 1191 (muscle), 1212 (skin), 1179 (cranial dura mater), and 1177 (mandibular nerve) increased the reaction rate. A regression analysis depicting this information is shown in Supplementary Figure S2. Importantly, none of the samples completely inhibited the reaction even at low concentrations (e.g., 10−6) of the 1268-P spike.
To determine how sample types that are in similar states of decomposition from known CWD-positive and CWD-not-detected WTD react in the RT-QuIC assay, we collected known CWD-positive and CWD-not-detected WTD from the same or similar sample types as the field samples and tested them using RT-QuIC. This was limited by the extent of availability in our biorepository; therefore, the sciatic nerve was used instead of the mandibular nerve, and we did not have cranial dura mater or skull swab from CWD-positive WTD. The brain from a CWD-positive WTD (ID = 0145_B) showed statistically significant RT-QuIC seeding activity (). None of the other samples CWD-positive (bone marrow, spinal cord, connective tissue, sciatic nerve) and CWD-not detected (brain, spinal cord, skin, sciatic nerve, muscle, connective tissue, cranial dura mater, skull swab) WTD showed statistically significant RT-QuIC seeding activity.
Microsatellite analysis
We employed a panel of 11 microsatellites to determine the origin of the dump site WTD remains. We recovered sufficient DNA quantity and quality for this analysis from five RT-QuIC positive samples retrieved from five locations within the dump site. These were compared to DNA samples extracted from 58 WTD from the captive herd (captive group) and 202 wild WTD from throughout Minnesota (wild group). Locus OvirQ showed a pattern of allele sizes incongruent with its reported motif, as described by Miller et al. [Citation33] for samples collected in the northeast USA, with some peaks consistently separated by only one bp. Following a conservative approach, we excluded OvirQ from our analyses. We did not find evidence of linkage-disequilibrium (assessing the possibility of non-random association between alleles from different microsatellite markers) in the wild group, whereas there were 13 pairs of linked markers in the captive group. Analysis of molecular variance (AMOVA) showed that most of the genetic variability in our dataset was attributed to within-group differences (97.5%); however, the difference between groups was statistically significant (FST = 0.025; p < 0.00001).
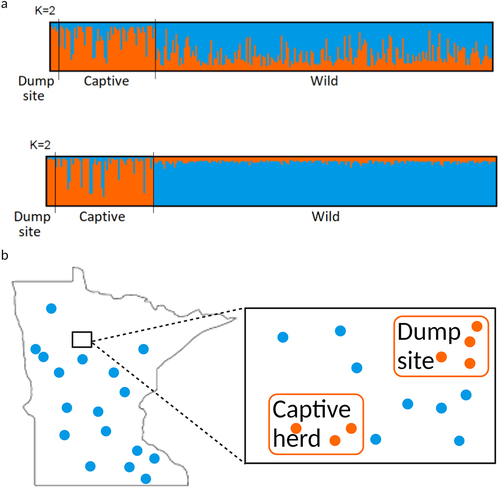
We also analysed genetic data using STRUCTURE (Bayesian clustering) to explore the likely source (wild vs. captive) of the recovered carcass materials. STRUCTURE results suggested the presence of two or three clusters, depending on whether the sample origin was used as a priori information (Supplementary Figure S3). In both cases, wild deer showed a different response to captive and dump site deer as the number of clusters increased. When information about sample origin was not specified, the genome of wild deer became increasingly partitioned, while most captive and dump site deer continued to show membership in a single cluster (, Supplementary Figure S4). When including the sampling location, the membership of wild deer did not change as the number of assumed clusters increased.
Figure 3. STRUCTURE results shown as barplots, with each bar representing an individual and its membership to assumed clusters (K = 2). (a) Top: Assignments obtained without including sample origin as a priori information. Bottom: assignments obtained including sample origin as a priori information. (b) Representative image demonstrating that the dump site and captive samples most closely aligned with each other and not with the wild samples collected near the sites and throughout Minnesota. Aligning with the bar colours in panel (a), the blue dots represent locations of wild population samples collected throughout the state, and orange dots represent samples from the dump site and captive herd and their relationship (locations are not exact).
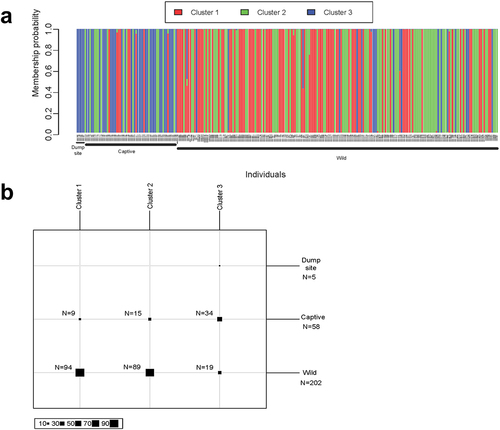
The find.clusters function of the adegenet package [Citation38] suggests the presence of three clusters (Supplementary Figure S5). Discriminant Analysis of Principal Components [Citation39] (DAPC) based on this grouping result revealed that most deer showed a high degree of membership to one of these clusters (). All individuals tested from the dump site were assigned to a cluster that was commonly assigned to samples from the captive herd (58.6% of captive deer belonged to this cluster) but rarely assigned to samples from the wild population (9.4% of wild deer belonged to this cluster).
Figure 4. Discriminant Analysis of Principal Components (DAPC) results. (a) Barplot displaying each individual’s membership to three inferred population clusters. (b) Number of individuals assigned to each cluster.
Discussion
The initial discovery of the carcass disposal site by State and Federal regulatory agencies led to the investigation of carcass remains reported here. As above-ground disposal sites for captive and wild cervid carcasses are common [Citation40,Citation41], instances such as those reported herein are unlikely to be anomalies. Using a combination of field collection methodologies, morphological characterization, next-generation prion diagnostic technology, and genetic analysis, we documented the illegal disposal of CWD-positive white-tailed deer, which we genetically linked to the source captive herd.
This investigation stemmed from the regulatory testing of a depopulated captive cervid herd from which CWD was detected using conventional diagnostic methods (i.e., IHC) during quarantine surveillance. However, conventional methods would not have been effective tools in this investigation, given the autolysed state of carcasses [Citation23]. We confirmed through morphological and microsatellite analyses the remains of an additional 12 RT-QuIC CWD-positive individual deer at the dump site (n = 6) and the captive facility (n = 6). We used unconventional sample types (e.g., bone marrow, dura mater, bone cavity swab, and larvae collection) with RT-QuIC to identify CWD-positive carcass remains (). Although novel to this type of investigation, sample types such as bone marrow [Citation42], swabs [Citation26,Citation43], and invertebrates [Citation44] have previously been used for prion detection using amplification methods. The RT-QuIC results from these and the other sample types produced similar sigmoidal curves and rates of amyloid formation in samples (e.g., WTD lymph nodes) with low-level prion content, consistent with the tens of thousands of RT-QuIC reactions performed in our laboratory [Citation28,Citation45].
Figure 5. Atypical samples collected for a chronic wasting disease (CWD) investigation. (a) Bone remains from cervids with minimal exterior soft tissue available for prion and genetic analysis. (b) Bone cavities were sampled for prion detection and genetic analysis using surface swabs, bone marrow, fly larvae, and fly larval frass. (c, d) Characteristic morphological structures of 2nd and 3rd instar larva. Larvae were subsequently identified as Liopiophila varipes and Piophila nigriceps. (e) Collection of fly larval frass from the medullary cavity of a white-tailed deer metatarsal.
The robustness of the prion detection results is evidenced by several means. First, the dump site location with equine remains (PL21) served as a negative control for swabbing bone surfaces, as it would not be expected to contain misfolded prions [Citation46]. Second, all sample types tested showed both RT-QuIC positive and negative results, suggesting that sample-specific factors were unlikely to cause false-positive results. Third, duplicate samples from the same animal and/or anatomical location were RT-QuIC positive (dump site samples: PL06A, 025; captive site samples: IDs = 54/56, 57, 58, 59), demonstrating consistency (). Fourth, laboratory control experiments indicated that, 1) RT-QuIC negative field samples did not contain inhibitory factors, resulting in a false-negative signal, and 2) statistically significant field samples were likely true RT-QuIC positives.
Control experiments also indicated that some RT-QuIC negative field samples may have come from CWD-positive animals, as some of the samples from known CWD-positive control animals were RT-QuIC negative. Conversely, no samples from CWD-not-detected animals in the control experiments demonstrated statistically significant seeding activity. Seeding activity occurred in one or three wells in three samples, but the robustness of the statistical analysis deemed those samples RT-QuIC negative, supporting the conservative claims of statistically significant, RT-QuIC positive field samples. Notably, CWD progression and detection can be dependent on factors such as individual animal genetics and overall health, as well as the potential strain(s) of CWD prion infecting the animal [Citation47,Citation48]. The field samples tested likely presented a variety of these factors. The CWD-positive control samples are known to originate from multiple animals at various stages of disease and from different populations of deer. For example, brain sample 0145 (RT-QuIC positive) came from a deer that was found dead and in a late stage of the disease, based on the IHC staining patterns of the obex and MRPLN. However, bone marrow sample 1239 came from a deer in a similar stage of disease yet was RT-QuIC negative, demonstrating the variability of sample type and likely animal individuality in detection assay results.
The deposition of CWD-positive cervid remains in the environment creates opportunities for CWD transmission via indirect (environment to animal) transmission. For example, disease transmission has manifested in captive mule deer via decomposed CWD-positive carcasses where only skeletal remains are present [Citation16] and from a CWD-contaminated environment [Citation49]. Therefore, regulatory agencies, both captive and wild, provide guidance on the proper disposal of cervid carcasses for the management of CWD and to reduce the risk of introduction to new areas or populations [Citation22,Citation50]. As deer are susceptible to very low doses of CWD prions [Citation21] and transmission from the specimens described in this investigation is possible [Citation16], the confirmation of CWD-positive carcasses in the environment presents a clear risk for further CWD transmission and subsequent spread to the local, free-living deer population. Human activities have been hypothesized to be the source of the geographic spread of CWD to locations that cannot be easily explained by natural cervid movement. Our study may be the first to provide evidence that improper carcass handling contributed to CWD spread, as two wild WTD tested CWD positive by ELISA/IHC on MRPLN through hunter-harvest surveillance in November 2022, approximately 65 km south of the dump site and more than 100 km from any other known CWD-positive source. This is the first case of CWD in the WTD in the area.
Prions can remain infectious in the environment for many years [Citation16,Citation19,Citation20] and may spread further through water [Citation51], scavengers [Citation52,Citation53], or invertebrates [Citation44]. Our investigation indicated remains were scavenged and were likely moved from the original point of deposition as individual bones were scattered across the 6ha site, some of which matched by microsatellite data. Given the research indicating the passing of prions through scavengers, such as crows and coyotes [Citation52,Citation53], there is potential that prions have been spread outside of the core dump site. Furthermore, given the recent discoveries of experimental cross-species transmission of CWD through rodents and meso-carnivores [Citation54], the risk of spreading to sympatric species is possible. Our findings indicate that carrion-associated invertebrates may also take up prions from infected carcasses, although their potential role as fomites in the spread or vectors in the transmission of CWD remains unclear. The full scope of prion movement throughout this environment is yet to be fully understood.
Our novel results provide a basis for the forensic utility of a highly sensitive amplification-based prion detection assay (RT-QuIC) combined with classical and genetic methodologies. In this study, we revealed the epidemiological links between a CWD-positive captive herd and CWD-positive remains recovered from an illegal carcass dump site and within the captive facility, demonstrating how the application of RT-QuIC functionality to carcass remains, in conjunction with genetic analysis, such as microsatellites, can facilitate disease investigations. The methods incorporated in this study and considerations for future environmental CWD research in association with carcass remains parallel those for other environmental contaminants. Turner et al. [Citation55] used an ecological approach to study anthrax (Bacillus anthracis) carcass sites over time to understand the infection risk to local animals through natural interactions with grass, soil, and water. The collective understanding of ecological prion interactions as a research community not only allows us to characterize past events but also better predict the risk of future outbreaks and control.
Materials and methods
This study used tissues obtained opportunistically from white-tailed deer that were culled or found deceased by the Minnesota Department of Natural Resources (MN DNR) and the MN BAH for surveillance purposes. None of the animals were specifically sacrificed for this study. No animal care and use protocol approval was required by the University of Minnesota (UMN) Institutional Animal Care and Use Committee.
Captive cervid facility
State and federal regulatory officials (MN BAH, USDA-APHIS) quarantined a Beltrami County Minnesota WTD captive herd (October 2020), reported CWD-positive IHC testing results in the herd (April 2021), and depopulated the remaining herd (n = 54) for further CWD testing (May 2021). Regulatory officials collected obex and MRPLN from 54 depopulated deer for official IHC testing. At the time of depopulation, regulatory officials collected the remains of multiple deer at various stages of decomposition within the enclosure of the facility. They provided the heads of depopulated deer and the collected remains to our University of Minnesota Center for Prion Research and Outreach (MNPRO) laboratory for CWD research. The specific locations of the remains within the enclosure were not disclosed. We collected neck muscle from depopulated animals for microsatellite analysis using methods described by Schwabenlander et al. [Citation45] All post-sampling remains were disposed via alkaline digestion at the UMN Veterinary Diagnostic Laboratory.
Field site investigation
State and federal regulatory officials (MN DNR, MN BAH, USDA-APHIS) identified a carcass dump site during the investigation of the Beltrami County, MN CWD-positive captive WTD herd. The herd owner illegally deposited an undisclosed number of WTD carcasses from the captive facility over an undisclosed amount of time at the dump site, which was located on county-managed tax-forfeit property approximately 1.5 km away from the captive facility. None of the WTD had been screened for CWD infection prior to disposal. MN DNR and MNPRO staff visited the dump site five times from April 28 through 30 September 2021, to locate and collect the remains. Staff marked the locations of the remains with stakes and flagging tape, recorded global positioning system (GPS) coordinates, and labelled each location with a unique location ID. A location was determined by the biological remains discovered within an approximate 4 m diameter. The locations were marked in a semi-permanent manner to enable the multi-year ecological monitoring of CWD contamination. Remains were bagged, labelled with location ID and date collected, and stored at −20°C until laboratory processing. We employed biosecurity measures during site visits, including site designated rubber boots disinfected with a 50% bleach solution (one part 5.25% sodium hypochlorite plus one part water), disposable personal protective equipment including boot covers, coveralls, nitrile gloves, and N95 respirators, disposable and site designated sampling equipment, and proper hazardous waste disposal via the UMN Waste Recovery Services’ infectious waste management.
Remains processing
We processed the remains from the dump site and those found at the captive facility following appropriate biosafety level 2 and prion-specific safety measures [Citation56]. To avoid cross-contamination, specimens were processed by location using clean, new nitrile gloves and 50% bleach solution (one part 5.25% sodium hypochlorite plus one part water) disinfected surfaces and instruments. The collection of biological samples was primarily dictated by the state of autolysis and extent of the remaining soft tissue suitable for diagnostic screening associated with each specimen. Suitable biological samples included desiccated muscle and connective tissue, bone marrow, dura mater, central nervous tissue, peripheral nerves, skin, hair, and lymph nodes. Invertebrate specimens were collected from the medullary and foramen cavities of bones. The samples were placed in 1.7 mL microcentrifuge tubes, 15 mL conical tubes, or 4-oz (118 mL) Whirl-Pak bags (Nasco, Fort Atkinson, Wisconsin, USA). The internal surfaces (e.g., long bone medullary cavity and internal neurocranium surface) of bones with no discernible soft tissue were swabbed with a phosphate-buffered saline (PBS) moistened foam swab (FisherbrandTM PurSwab Foam Swabs, Thermo Fisher Scientific, Waltham, MA, US). The swabs were placed in sterile 15 mL conical tubes. All samples were frozen at −80°C.
We estimated the age at the time of mortality for many of the remains based on tooth eruption/replacement, tooth wear, epiphyseal closure of long bones, and comparative size (Supplementary Figure S1). First, we used primary tooth eruption and replacement (mandibular and maxillary) [Citation34,Citation35] for deer up to 1.5 years of age. Beyond that age, we observed wear patterns of the three mandibular molar cusps [Citation34,Citation35] to estimate age as ≥ 2 years. For long bone specimens, we examined epiphyseal closure to estimate age based on Purdue’s [Citation36] description of the sequence and timing of fusion, which provides estimates up to approximately 3 years of age. Finally, for specimens that could not be determined through these ageing criteria, we made general comparisons of size to those specimens in which we were able to estimate age. We compared the age estimation between methods for specimens collected at the same site or from the same animal in which we performed more than one of the above evaluations. We placed specimens in the following age classes after reaching consensus using multiple methods: adult (> 2 years), yearling (1–2 years), fawn (< 1 year), and unknown (i.e., insufficient information available).
Sample control experiments
We performed laboratory control experiments to simulate the sample types and state of decomposition associated with remains collected at the captive cervid facility and field site. We designed control experiments to investigate two questions: 1) Do sample types collected from field specimens that were negative via RT-QuIC contain inhibitors that mask a true positive sample, and 2) how do sample types that are in similar states of decomposition from known CWD-positive and CWD-not-detected WTD react in the RT-QuIC assay? To answer the first question, we spiked nine field samples with a dilution series (10−3-10−6) of CWD-positive WTD palatine tonsil homogenate (ID = 1268-P) collected from a depopulated animal in the captive cervid facility. The nine samples represented the different sample types collected at the dump site or captive cervid facility and tested using RT-QuIC: bone marrow (ID = 63, 1218), connective tissue (ID = 65, 1233), parotid lymph node (ID = 66, 1225), MRPLN (ID = 66, 1226), skin (ID=GR06, 1212), muscle (ID=PL05A, 1191), mandibular nerve (ID=PL15A, 1177), cranial dura mater (ID=PL17, 1179), and spinal cord (ID=PL17, 1059). Spiked samples were compared to 1268-P RT-QuIC results to determine any significant changes in RT-QuIC reaction kinetics caused by the additional tissue homogenate. To answer the second question, we gathered from MNPRO’s biorepository sample types from known CWD positive and not-detected WTD that matched the sample types from the dump site or captive cervid facility. Samples from known CWD-positive WTD were originally collected in advanced stages of decomposition and included the bone marrow (ID = 1239), spinal cord (ID = 1784), brain (ID = 0145), nerve (ID = 1786), and connective tissue (ID = 1785). Samples 1239 and 0145 were from two separate deer that were both found dead in late-stage disease, based on IHC staining intensity in the obex and MRPLN. Samples 1784, 1786, and 1785 were obtained from hunter-harvested deer that showed no signs of clinical disease. We were unable to obtain skull swabs and cranial dura mater from known CWD-positive WTD. Samples from known CWD-not-detected WTD (wild source; hunter harvested or hit by car; RT-QuIC and ELISA or IHC tested on obex and/or MRPLN) included the spinal cord (ID = 1788), brain (ID = 1787), skull swab (ID=Skull Swab), skin (ID = 1789), nerve (ID = 1790), connective tissue (ID = 1792), muscle (ID = 1791), and cranial dura mater (ID = 1793). Tissue samples 1792 and 1793 were in advanced stages of decomposition. The remaining tissue samples were individually subsampled, placed in tissue cassettes, and placed in a sterile desiccator chamber under vacuum at room temperature for seven days to advance tissue autolysis.
RT-QuIC assay and data analysis
RT-QuIC assay and statistical analysis methodologies have been described previously [Citation43,Citation45]. Briefly, biological samples were dissected using disposable tools on fresh disposable benchtop paper. A 10% (w/v) suspension was prepared by adding 100 mg of tissue to 900 µL of PBS. Further enrichment was performed on the muscle and connective tissues following the freeze-thaw method described by Li et al. [Citation29]. Swab extraction methods have been described previously [Citation43]. Homogenized biological samples and swab extracts were further diluted to 10−3 and 10−1, respectively, in dilution buffer (0.1% sodium dodecyl sulphate, 1 × PBS, N-2 Supplement (Life Technologies Corporation, Carlsbad, CA, USA)). To determine any inhibitory effects that the samples might have on the reaction (see above section, ‘Sample control experiments’), samples were spiked with a CWD-positive control sample dilution ranging from 10−3-10−6. Next, two µL of the sample diluent was added to 98 µL of RT-QuIC master mix (1 × PBS, 500 µM EDTA, 50 µM Thioflavin T, 300 mM NaCl, and 0.1 mg/mL Syrian hamster rPrP prepared in-house [Citation45]) into each well on a black 96-well plate with clear bottoms. The plates contained appropriate positive and negative controls (6–8 replicates for each), were sealed with clear tape, and then shaken on a BMG FLUOstar® Omega microplate reader (BMG LABTECH Inc., Cary, NC, USA) with the parameters described by Schwabenander et al. [Citation45] for biological samples and Yuan et al. [Citation43] for swab samples.
The rate of amyloid formation (RAF) was calculated per well as the reciprocal of the time required for fluorescence to reach twice the background fluorescence. Samples exhibiting amyloid seeding were deemed statistically significant by the Mann-Whitney U-test and Dunnett’s test (p < 0.01). For positive control-spiked experiments, comparisons were performed on the rates using two-way ANOVA and an uncorrected Fisher’s LSD Test. Regression analysis was applied to various dilution series to determine the standard curves for each treatment. For non-spiked tissue samples, one-way ANOVA and an uncorrected Fisher’s LSD test were performed for each sample compared to the negative control. In all instances, the significance level was set at p < 0.05.
The normalized RAF was utilized for a more direct, accurate way to visually compare the rates of reactions across multiple plates () [Citation29]. Normalized RAF can be interpreted as an adjusted RAF, assuming that the average RAF of positive plate controls on all plates has an equal hypothetical value of 1/h. 1/h was chosen for ease of calculation; the normalization factor was calculated as the average RAF of positive plate controls divided by the hypothetical RAF. The normalization factor was identical to the average RAF of the positive plate controls.
Microsatellite analysis
Following the manufacturer’s instructions, we isolated DNA from RT-QuIC-positive samples from the dump site (n = 8) using the QIAamp Fast DNA Tissue Kit (Qiagen, Hilden, Germany). DNA from deer found dead within the captive facility (n = 23, Supplementary Table S1) was isolated using either the QIAamp Fast DNA Tissue Kit or DNeasy Blood and Tissue Kit (Qiagen, Hilden, Germany). Samples from the depopulated captive herd (n = 52) and wild deer harvested within a 50 km radius of the dump site (n = 10) had DNA extracted using the DNeasy Blood and Tissue Kit. All sample concentrations were determined using the Qubit dsDNA High Sensitivity or dsDNA Broad Range Kit (Invitrogen/Life Technologies, Carlsbad, CA). Samples with intact DNA were used for microsatellite analysis, representing five out of eight samples from the dump site, 58 samples from the captive cervid herd (all 52 depopulated samples; six of 23 found dead samples), and 202 samples of hunter-harvested and culled WTD from Minnesota to characterize the wild population. Preliminary analyses of the 202 wild WTD showed no genetic structure across the state; therefore, all our samples collected in the wild can be regarded as part of the same demographic unit (unpublished data).
Following the protocol described by Miller et al. 2019 [Citation33], we amplified a panel of 11 microsatellites previously used to study WTD populations: INRA011 [Citation57], OarFCB193 [Citation58], BL42, BM6438, BM4107 [Citation59], Cervid1 [Citation60], RT7, RT5, RT9 [Citation61], OvirQ and OvirP [Citation62]. Alleles were called using GeneMarker v. 2.6.3 [Citation63] and MsatAllele package [Citation64] in R v.3.6.3 [Citation65].
We ran the linkage disequilibrium test implemented by ARLEQUIN v.3.5.2.2 [Citation66], including samples from both wild and captive groups, to assess the possibility of non-random association between alleles from different markers, setting the number of permutations to 10,000 (Bonferroni corrected alpha = 0.001). We performed an analysis of molecular variance (AMOVA), computing FST as an estimate of the genetic distance between both groups, using 10,000 permutations to assign significance.
To evaluate the origin of deer found at the dump site, we used Bayesian clustering and a multivariate method. For the former, STRUCTURE v.2.3.4 [Citation67] was run with the following settings: 500,000 steps burn-in period followed by one million steps, K (number of assumed population clusters) from one to five, and 10 runs per K. We used an admixture model and correlated allele frequencies, leaving the remaining parameters to their default settings (inferring alpha and using a lambda value of 1.0). We repeated this process including sample origin (‘wild,’ ‘captive,’ or ‘dump site’) as prior information to assist the clustering. As mentioned in the software manual, this method can reveal patterns of genetic structure when the signal is too weak to be detected by the traditional method, without creating a biased spurious structure when no such patterns exist. The results were evaluated using STRUCTURE HARVESTER WEB v.0.6.94 [Citation68] to determine the number of clusters that were most likely to represent the population based on mean ln (likelihood) and Evanno’s ΔK [Citation69]. We used CLUMPAK [Citation70] to assess the convergence between different runs and created average bar plots for each K.
For the multivariate method, we performed Discriminant Analysis of Principal Components [Citation39] (DAPC) in R v.3.6.3. Unlike STRUCTURE, DAPC does not rely on assumptions regarding Hardy-Weinberg equilibrium or linkage equilibrium. Given that DAPC requires clusters to be defined a priori, we used the find.clusters function of the adegenet package [Citation38], as explained in the DAPC tutorial [Citation71], retaining all principal components and selecting the solution with the lowest Bayesian Information Criterion.
Author contributions
M.D.S., J.C.B., M.C., L.G., R.J.L., T.M.W., and P.A.L. conceived the study. M.D.S., M.L., G.R., and P.A.L. designed the RT-QuIC experiments. M.L., R.L.S, G.R., and S.S. performed RT-QuIC assay and data analysis. M.D.S, R.J.L, and T.M.W. performed anatomical analyses and data interpretation. A.F. and W.D.W performed genetic analyses and interpreted the data. M.D.S., A.F., M.L., and G.R. prepared the figures. M.D.S., A.F., G.R., T.M.W., and P.A.L. wrote the main manuscript. J.C.B, M.C., R.J.L., and W.D.W helped to interpret the results and write the manuscript. All authors have reviewed the manuscript.
Supplemental Material
Download JPEG Image (107.1 KB)
Supplemental Material
Download JPEG Image (45.5 KB)
Supplemental Material
Download JPEG Image (98.3 KB)
Supplemental Material
Download JPEG Image (2.5 MB)
Acknowledgments
We thank the staff of MN DNR, MN BAH, and USDA-APHIS for access to the sites and specimens and the performance and reporting of the official CWD testing results. We thank T. Garwood for assistance in processing specimens and J. Oliver and L. Lindsay for larval identification. , and Supplementary Figure S1 were created using BioRender.com.
Disclosure statement
M.D.S, M.L., G.R., R.J.L., and P.A.L holds financial and business interests in Priogen Corp., which has a license from the University of Minnesota to commercialize prion diagnostics technology. These interests have been reviewed and managed by the University of Minnesota in accordance with its Conflict of Interest policies.
Data availability statement
The data supporting the findings of this study are available from the corresponding author, M.D.S., upon reasonable request.
Supplementary material
Supplemental data for this article can be accessed online at https://doi.org/10.1080/19336896.2024.2343298.
Additional information
Funding
References
- Ubelaker DH. A history of forensic anthropology. Am J Phys Anthropol. 2018;165(4):915–923. doi: 10.1002/ajpa.23306
- Jeffreys AJ, Wilson V, Thein SL. Hypervariable ‘minisatellite’ regions in human DNA. Nature. 1985;314(6006):67–73. doi: 10.1038/314067a0
- Jeffreys AJ, Wilson V, Thein SL. Individual-specific ‘fingerprints’ of human DNA. Nature. 1985;316(6023):76–79. doi: 10.1038/316076a0
- Pérez-Martínez C, Prieto-Bonete G, Pérez-Cárceles MD, et al. Usefulness of protein analysis for detecting pathologies in bone remains. Forensic Sci Int. 2016;258:68–73. doi: 10.1016/j.forsciint.2015.11.009
- Haines AM, Webb SL, Wallace JR. Conservation forensics: the intersection of wildlife crime, forensics, and conservation. In: Underkoffler S Adams H, editors Wildlife biodiversity conservation: multidisciplinary and forensic approaches. Cham: Springer International Publishing; 2021. pp. 125–146.
- Viner TC, Kagan RA. Chapter 2 - forensic wildlife pathology. In: Terio K, McAloose D, and Leger J, editors Pathology of wildlife and zoo animals. Cambridge, MA: Academic Press; 2018. pp. 21–40.
- Parry NMA, Stoll A. The rise of veterinary forensics. Forensic Sci Int. 2020;306:110069. doi: 10.1016/j.forsciint.2019.110069
- Smart U, Cihlar JC, Budowle B. International wildlife trafficking: A perspective on the challenges and potential forensic genetics solutions. Forensic Sci Int Genet. 2021;54:102551. doi: 10.1016/j.fsigen.2021.102551
- Ciavaglia SA, Tobe SS, Donnellan SC, et al. Molecular identification of python species: development and validation of a novel assay for forensic investigations. Forensic Sci Int Genet. 2015;16:64–70. doi: 10.1016/j.fsigen.2014.12.002
- Cui W, Jin X, Guo Y, et al. Development and validation of a novel five-dye short tandem repeat panel for forensic identification of 11 species. Front Genet. 2020;11. doi: 10.3389/fgene.2020.01005
- Miller WL, David Walter W. Can genetic assignment tests provide insight on the influence of captive regression on the epizootiology of chronic wasting disease? Evol Appl. 2020;13(4):715–726. doi: 10.1111/eva.12895
- Williams ES, Young S. Chronic wasting disease of captive mule deer: a spongiform encephalopathy. J Wildl Dis. 1980;16:89–98. doi: 10.7589/0090-3558-16.1.89
- Prusiner SB. Novel proteinaceous infectious particles cause scrapie. Science. 1982;216(4542):136–144. doi: 10.1126/science.6801762
- Henderson DM, Davenport KA, Haley NJ, et al. Quantitative assessment of prion infectivity in tissues and body fluids by real-time quaking-induced conversion. J Gen Virol. 2015;96(1):210–219. doi: 10.1099/vir.0.069906-0
- Tennant JM, Li M, Henderson DM, et al. Shedding and stability of CWD prion seeding activity in cervid feces. PLOS ONE. 2020;15(3):e0227094. doi: 10.1371/journal.pone.0227094
- Miller MW, Williams ES, Hobbs NT, et al. Environmental sources of prion transmission in mule deer. Emerg Infect Dis. 2004;10(6):1003–1006. doi: 10.3201/eid1006.040010
- Yuan Q, Telling G, Bartelt-Hunt SL, et al. Dehydration of prions on environmentally relevant surfaces protects them from inactivation by freezing and thawing. J Virol. 2018;92(8):92. doi: 10.1128/JVI.02191-17
- Yuan Q, Eckland T, Telling G, et al. Mitigation of prion infectivity and conversion capacity by a simulated natural process—repeated cycles of drying and wetting. PLOS Pathog. 2015;11(2):e1004638. doi: 10.1371/journal.ppat.1004638
- Somerville RA, Fernie K, Smith A, et al. BSE infectivity survives burial for five years with only limited spread. Arch Virol. 2019;164(4):1135–1145. doi: 10.1007/s00705-019-04154-8
- Georgsson G, Sigurdarson S, Brown P. Infectious agent of sheep scrapie may persist in the environment for at least 16 years. J Gen Virol. 2006;87(12):3737–3740. doi: 10.1099/vir.0.82011-0
- Denkers ND, Hoover CE, Davenport KA, et al. Very low oral exposure to prions of brain or saliva origin can transmit chronic wasting disease. PLOS ONE. 2020;15(8):e0237410. doi: 10.1371/journal.pone.0237410
- La Sharr K, Hildebrand E, Carstensen M, et al. Surveillance and management of chronic wasting disease in Minnesota. Minnesota Department of Natural Resources; 2019. https://files.dnr.state.mn.us/wildlife/research/summaries/2019/ungulates/2019ug007.pdf.
- Haley NJ, Richt JA. Evolution of diagnostic tests for chronic wasting disease, a naturally occurring prion disease of cervids. Pathogens. 2017;6(3):35. doi: 10.3390/pathogens6030035
- Wilham JM, Orrú CD, Bessen RA, et al. Rapid end-point quantitation of prion seeding activity with sensitivity comparable to bioassays. PLOS Pathog. 2010;6(12):e1001217. doi: 10.1371/journal.ppat.1001217
- Atarashi R, Moore RA, Sim VL, et al. Ultrasensitive detection of scrapie prion protein using seeded conversion of recombinant prion protein. Nat Methods. 2007;4(8):645–650. doi: 10.1038/nmeth1066
- Orrú CD, Groveman BR, Hughson AG, et al. Rapid and sensitive RT-QuIC detection of human Creutzfeldt-Jakob disease using cerebrospinal fluid. MBio. 2015;6(1):6. doi: 10.1128/mBio.02451-14
- McNulty E, Nalls AV, Mellentine S, et al. Comparison of conventional, amplification and bio-assay detection methods for a chronic wasting disease inoculum pool. PLOS ONE. 2019;14(5):e0216621. doi: 10.1371/journal.pone.0216621
- Picasso-Risso C, Schwabenlander MD, Rowden G, et al. Assessment of Real-Time Quaking-Induced Conversion (RT-QuIC) assay, immunohistochemistry and ELISA for detection of chronic wasting disease under field conditions in white-tailed deer: a Bayesian approach. Pathogens. 2022;11(5):11. doi: 10.3390/pathogens11050489
- Li M, Schwabenlander MD, Rowden GR, et al. RT-QuIC detection of CWD prion seeding activity in white-tailed deer muscle tissues. Sci Rep. 2021;11(1):16759. doi: 10.1038/s41598-021-96127-8
- Cramm M, Schmitz M, Karch A, et al. Stability and reproducibility underscore utility of RT-QuIC for diagnosis of creutzfeldt-jakob disease. Mol Neurobiol. 2016;53(3):1896–1904. doi: 10.1007/s12035-015-9133-2
- Moško T, Galušková S, Matěj R, et al. Detection of Prions in brain homogenates and CSF samples using a second-generation RT-QuIC assay: a useful tool for retrospective analysis of archived samples. Pathogens. 2021;10(6):750. doi: 10.3390/pathogens10060750
- Soto P, Bravo-Risi F, Benavente R, et al. Identification of chronic wasting disease prions in decaying tongue tissues from exhumed white-tailed deer. mSphere. 2023;8(5):e0027223. doi: 10.1128/msphere.00272-23
- Miller WL, Edson J, Pietrandrea P, et al. Identification and evaluation of a core microsatellite panel for use in white-tailed deer (Odocoileus virginianus). BMC Genet. 2019;20(1):49. doi: 10.1186/s12863-019-0750-z
- Severinghaus CW. Tooth development and wear as criteria of age in white-tailed deer. J Wildl Manage. 1949;13(2):195–216. doi: 10.2307/3796089
- Guynn ST, Moore WF, Guynn DC Jr. A key for aging white-tailed deer using the tooth replacement and wear technique. Report No.: lGP 1093. Clemson (SC): Clemson Cooperative Extension; 2020. https://lgpress.clemson.edu/publication/a-key-for-aging-white-tailed-deer-using-the-tooth-replacement-and-wear-technique/
- Purdue JR. Epiphyseal closure in white-tailed deer. J Wildl Manage. 1983;47(4):1207–1213. doi: 10.2307/3808195
- Lewis JE. Identifying sword marks on bone: criteria for distinguishing between cut marks made by different classes of bladed weapons. J Archaeol Sci. 2008;35(7):2001–2008. doi: 10.1016/j.jas.2008.01.016
- Jombart T. Adegenet: a R package for the multivariate analysis of genetic markers. Bioinformatics. 2008;24(11):1403–1405. doi: 10.1093/bioinformatics/btn129
- Jombart T, Devillard S, Balloux F. Discriminant analysis of principal components: a new method for the analysis of genetically structured populations. BMC Genet. 2010;11(1):94. doi: 10.1186/1471-2156-11-94
- Bonhotal J. Natural rendering: a natural solution for mortality and butcher waste. Small Farm Q. 2003; 17.
- Vantassel SM, King MA Wildlife carcass disposal. Report No: 19. U.S. Department of Agriculture: Animal and Plant Health Inspection Service; 2018. https://digitalcommons.unl.edu/nwrcwdmts/19/
- Seelig DM, Mason GL, Telling GC, et al. Pathogenesis of chronic wasting disease in cervidized transgenic mice. Am J Pathol. 2010;176(6):2785–2797. doi: 10.2353/ajpath.2010.090710
- Yuan Q, Rowden G, Wolf TM, et al. Sensitive detection of chronic wasting disease prions recovered from environmentally relevant surfaces. Environ Int. 2022;166:107347. doi: 10.1016/j.envint.2022.107347
- Pritzkow S, Morales R, Camacho M, et al. Uptake, retention, and excretion of infectious prions by experimentally exposed earthworms. Emerg Infect Dis. 2021;27:3151–3154. doi: 10.3201/eid2712.204236
- Schwabenlander MD, Rowden GR, Li M, et al. Comparison of chronic wasting disease detection methods and procedures: implications for free-ranging white-tailed deer (Odocoileus virginianus) surveillance and management. J Wildl Dis. 2022;58(1). doi: 10.7589/JWD-D-21-00033
- Sola D, Artigas R, Mediano DR, et al. Novel polymorphisms in the prion protein gene (PRNP) and stability of the resultant prion protein in different horse breeds. Vet Res. 2023;54(1):94. doi: 10.1186/s13567-023-01211-8
- Haley NJ, Merrett K, Buros Stein A, et al. Estimating relative CWD susceptibility and disease progression in farmed white-tailed deer with rare PRNP alleles. PLOS ONE. 2019;14(12):e0224342. doi: 10.1371/journal.pone.0224342
- Otero A, Duque Velasquez C, McKenzie D, et al. Emergence of CWD strains. Cell Tissue Res. 2023;392(1):135–148. doi: 10.1007/s00441-022-03688-9
- Mathiason CK, Hays SA, Powers J, et al. Infectious prions in pre-clinical deer and transmission of chronic wasting disease solely by environmental exposure. PLOS ONE. 2009;4(6):e5916. doi: 10.1371/journal.pone.0005916
- U.S. Department of Agriculture. Chronic wasting disease program standards. Report No.: 9 CFR parts 55 and 81. Animal and Plant Health Inspection Service Veterinary Services; 2019. https://www.aphis.usda.gov/animal_health/animal_diseases/cwd/downloads/cwd-program-standards.pdf
- Nichols TA, Pulford B, Wyckoff AC, et al. Detection of protease-resistant cervid prion protein in water from a CWD-endemic area. Prion. 2009;3(3):171–183. doi: 10.4161/pri.3.3.9819
- Nichols TA, Fischer JW, Spraker TR, et al. CWD prions remain infectious after passage through the digestive system of coyotes (Canis latrans). Prion. 2015;9(5):367–375. doi: 10.1080/19336896.2015.1086061
- VerCauteren KC, Pilon JL, Nash PB, et al. Prion remains infectious after passage through digestive system of American crows (Corvus brachyrhynchos). PLOS ONE. 2012;7(10):e45774. doi: 10.1371/journal.pone.0045774
- Moore SJ, Carlson CM, Schneider JR, et al. Increased attack rates and decreased incubation periods in raccoons with chronic wasting disease passaged through Meadow Voles. Emerg Infect Dis. 2022;28(4):793–801. doi: 10.3201/eid2804.210271
- Turner WC, Kausrud KL, Beyer W, et al. Lethal exposure: an integrated approach to pathogen transmission via environmental reservoirs. Sci Rep. 2016;6(1):27311. doi: 10.1038/srep27311
- Centers for Disease Control and Prevention. Biosafety in microbiological and biomedical laboratories. Meechan PJ, Potts J editors. 6th. National Institutes of Health; 2020. https://www.cdc.gov/labs/pdf/SF__19_308133-A_BMBL6_00-BOOK-WEB-final-3.pdf
- Vaiman D, Osta R, Mercier D, et al. Characterization of five new bovine dinucleotide repeats. Anim Genet. 1992;23(6):537–541. doi: 10.1111/j.1365-2052.1992.tb00175.x
- Buchanan FC, Crawford AM. Ovine microsatellites at the OarFCB11, OarFCB128, OarFCB193, OarFCB266 and OarFCB304 loci. Anim Genet. 1993;24(2):145. doi: 10.1111/j.1365-2052.1993.tb00269.x
- Bishop MD, Kappes SM, Keele JW, et al. A genetic linkage map for cattle. Genetics. 1994;136(2):619–639. doi: 10.1093/genetics/136.2.619
- DeWoody JA, Honeycutt RL, Skow LC. Microsatellite markers in white-tailed deer. J Heredity. 1995;86(4):317–319. doi: 10.1093/oxfordjournals.jhered.a111593
- Wilson GA, Strobeck C, Wu L, et al. Characterization of microsatellite loci in caribou Rangifer tarandus, and their use in other artiodactyls. Mol Ecol. 1997;6(7):697–699. doi: 10.1046/j.1365-294X.1997.00237.x
- Jones KC, Levine KF, Banks JD. DNA-based genetic markers in black-tailed and mule deer for forensic applications. Calif Fish Game. 2000;86:115–126.
- Holland MM, Parson W. GeneMarker® HID: a reliable software tool for the analysis of forensic STR data. J Forensic Sci. 2011;56(1):29–35. doi: 10.1111/j.1556-4029.2010.01565.x
- Alberto F. MsatAllele_1.0: an R package to visualize the binning of microsatellite alleles. J Heredity. 2009;100(3):394–397. doi: 10.1093/jhered/esn110
- R Core Team. R: a language and environment for statistical computing. R Foundation for Statistical Computing, Vienna, Austria; 2022. https://www.R-project.org/
- Excoffier L, Lischer HEL. Arlequin suite ver 3.5: a new series of programs to perform population genetics analyses under Linux and windows. Mol Ecol Resour. 2010;10(3):564–567. doi: 10.1111/j.1755-0998.2010.02847.x
- Pritchard JK, Stephens M, Donnelly P. Inference of population structure using multilocus genotype data. Genetics. 2000;155(2):945–959. doi: 10.1093/genetics/155.2.945
- Earl DA, Vonholt BM. STRUCTURE HARVESTER: A website and program for visualizing STRUCTURE output and implementing the evanno method. Conserv Genet Resour. 2012;4(2):359–361. doi: 10.1007/s12686-011-9548-7
- Evanno G, Regnaut S, Goudet J. Detecting the number of clusters of individuals using the software STRUCTURE: a simulation study. Mol Ecol. 2005;14(8):2611–2620. doi: 10.1111/j.1365-294X.2005.02553.x
- Kopelman NM, Mayzel J, Jakobsson M, et al. Clumpak: a program for identifying clustering modes and packaging population structure inferences across K. Mol Ecol Resour. 2015;15(5):1179–1191. doi: 10.1111/1755-0998.12387
- Jombart T, Collins C A tutorial for Discriminant Analysis of Principal Components (DAPC) using adegenet 2.1. 0. Imperial College, London, United Kingdom; 2017. https://raw.githubusercontent.com/thibautjombart/adegenet/master/tutorials/tutorial-dapc.pdf