
Abstract
Lateral ankle sprains are the most common injuries in indoor and court sports, with ankle inversion being a primary injury driver. Stabilising the ankle during multidirectional changes is crucial for injury prevention. Conversely, increased shoe stiffness has been hypothesised to influence the magnitude of ankle inversion and may raise the risk for ankle injuries. Therefore, the purpose of this study was to investigate the influence of shoe longitudinal bending stiffness on ankle biomechanics during indoor and court sport-specific cutting movements. Biomechanical data from 19 participants were collected using a motion capture system and force plate. A jump-cut protocol with two different cutting directions after landing was performed in indoor shoes with and without carbon plate inserts of varying stiffness. Ankle kinematics and kinetics were analysed with statistical parametric mapping and repeated measures analysis of variance. A significant increase in ankle inversion during the 180° cut and a reduction in forefoot inversion (foot torsion) for stiffer footwear conditions during both the 45° and 180° cut were observed. While dorsiflexion moments differed during the last 10% of ground contact, ankle inversion moments did not significantly diverge between shoe conditions. Furthermore, a noteworthy correlation between footwear longitudinal bending stiffness and torsional stiffness was identified. In conclusion, increased bending stiffness significantly affected ankle and foot kinematics. The ankle compensated for restricted mobility and higher demands during high-degree jump-cuts, while foot torsion played a more prominent role in low-degree cuts. The heightened ankle inversion during high-degree cuts may induce an elevated risk for lateral ankle sprains. Further longitudinal studies are necessary to comprehensively understand injury incidence and the role of shoe stiffness in injury prevention.
1. Introduction
Lateral ankle sprains are the most frequent injuries in indoor and court sports (Delahunt & Remus, Citation2019). This injury is defined as the traumatic result from excessive rearfoot inversion, or a combined plantar flexion and adduction of the foot (Herzog et al., Citation2019). Inversion is the primary driver of ankle distortion in most cases, as confirmed by recent studies that used video analysis to investigate ankle injuries (Bagehorn, De Zee, et al., Citation2024; Lysdal et al., Citation2022). Moreover, multidirectional cuts and jump landings are crucial components of indoor and court sports, and a high frequency of these movements has been shown to be a risk factor for ankle sprains (McKay et al., Citation2001). Hence, to maintain ankle joint integrity during such movements, it appears crucial to stabilise the lateral ankle joint against excessive inversion. Additionally, a sudden increase in ankle joint inversion moment has been identified as a contributing factor to these injuries (Fong et al., Citation2009), along with the type of footwear used in indoor and court sports (Fahlström et al., Citation1998; W.-K. Lam et al., Citation2019) and the landing position at touchdown (Lysdal et al., Citation2022; Wright et al., Citation2000).
Modifying the longitudinal bending stiffness of sport shoes has been a key focus of research in recent years due to its impact on various aspects of athletic performance. While studies have shown its influence on running economy (Ortega et al., Citation2021), cutting performance (Stefanyshyn & Wannop, Citation2016), and jump height (Stefanyshyn & Nigg, Citation2000), little research exists on its influence on injury risk in indoor and court sports (Taylor et al., Citation2019). Recent research suggests that the longitudinal bending stiffness and torsional stiffness of a shoe are interconnected, implying that alterations in one may influence the other (Bagehorn et al., Citation2024b). However, the extent of this relationship when integrating a full-length carbon plate into the midsole, a common practice in contemporary footwear construction, remains unclear. Torsion is a critical movement for athletic performance as it describes the relative rotation of the forefoot with respect to the rearfoot (Michel et al., Citation2009). Shoes with increased torsional stiffness have been hypothesised to increase the magnitude of ankle inversion moment, as they alter frontal plane the movement of the foot and ankle. This restriction can lead to increased stress on the ankle joint and its supporting structures, potentially increasing the risk of ankle injuries (Graf & Stefanyshyn, Citation2013). This is a cause for concern, especially given the growing prevalence of carbon plates and high shoe bending and torsional stiffness in indoor sports. For example, a study by Martin et al. (Citation2023) found increased ankle inversion during 180° tennis cutting movements when comparing shoes of different torsional stiffness, suggesting that higher shoe stiffness may indeed increase ankle sprain risk. However, there is limited research investigating footwear-related ankle injuries in this area, which makes it challenging to understand the impact of different footwear bending stiffness on the ankle.
Evaluating ankle sprain injury risk in a laboratory setting involves ethical challenges when exposing participants to a higher risk of injury and must, therefore, be carried out under reasonable conditions. Due to the fact that landing from a jump is a typical mechanism of ankle sprain injuries (Dufek & Bates, Citation1991; Liu et al., Citation2016), researchers frequently use jump-landing protocols for studies linked to ankle injuries or athletic performance. This was demonstrated in studies that employed various types of jumping movements (Liu et al., Citation2016; Taylor et al., Citation2019). However, previous research did not consider the combination of jumps with the specific demands and mechanisms associated with changes of direction. Therefore, the aim of this study was to examine the influence of longitudinal bending stiffness on ankle kinematics and kinetics during indoor and court sport-specific changes of direction using a modified jump-cut protocol.
The first hypothesis was that increased longitudinal bending stiffness leads to an increase in ankle inversion. Additionally, the second hypothesis was that an increase in shoe longitudinal bending stiffness would lead to an increase in ankle inversion moment during the early landing phase.
2. Methods
2.1. Study design
In this experimental study, we investigated the effect of footwear with different longitudinal bending stiffnesses on the ankle kinematics and kinetics. For this purpose, participants performed a jump-cut protocol barefoot to eliminate prior shoe habituation and minimise any learning effect associated with the jump movement in subsequent shod conditions. Afterwards, participants underwent the same protocol with three different footwear conditions in a randomised order. No hints or time to inspect the shoes for potential differences were given to avoid priming.
2.2. Shoe conditions
Indoor sport shoes (Decathlon Allsix V100) were equipped with different full-length carbon plate inlays. Carbon plate inserts were provided by the supporting footwear company (Decathlon, France) which were matched to the size and shape of the shoe last (). This resulted in a considerable curvature in the forefoot area, making them fit perfectly into the shoe’s footbed. The carbon plates were positioned inside the shoe and underneath the sockliner. An electronically driven material testing machine (Zwick/Roell testControl II, Ulm, Germany) was used to perform a three-point-bend test (Roy & Stefanyshyn, Citation2006; Takahashi et al., Citation2016) and torsional stiffness test (Hillstrom et al., Citation2013) to evaluate shoe bending stiffness (). For the three-point-bend test the shoes were positioned on two bars which were 80 mm apart. A stamp (width = 50 mm, radius = 10 mm) positioned on the shoe insole at 70% of the shoe length moved 15 mm at a speed of 12.5 mm/s and caused the shoe to bend. The slope of the resulting force-deformation curve was calculated between an estimated bending angle of 15–30° (5.3–10.9 mm) and represented the longitudinal bending stiffness in the forefoot area (). Thirty repetitions were performed and the 29th cycle was taken for analysis. All tests were performed using the same shoe sample, with only the carbon plates being interchanged. Shoe conditions used for the measurements were the neutral shoe without plate (NEU), the shoe with a stiff plate (ST1), and the shoe with an even stiffer plate (ST2). The shoes and carbon plates used in the biomechanical testing remained identical throughout the entire data collection.
Figure 1. Force-deformation curves of the mechanical tests (A,D), test setup (B,E), carbon plates (C), and marker set (F). D: full line resembles shoe eversion, dashed line shoe inversion.
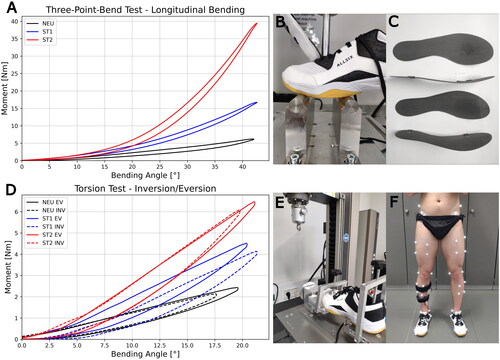
Table 1. Mechanical testing results for all shoe conditions.
For the torsion test the heel of the shoe was fixed in place while the forefoot was clamped to a platform that freely rotated around its long axis. A pully led over a wheel that rotated the forefoot platform at 10°/s. The slope of the force-deformation curve was calculated in 5-degree intervals between 0 and 15° and the highest value was reported as torsional stiffness ().
2.3. Ethical statement
Ethical approval was reviewed and given by the ethical committee of the German Sport University Cologne. Every participant received and signed a declaration of consent and data protection.
2.4. Participants
Sample size calculation was based on six fake-and-cut trials from a previously recorded ankle sprain injury (Bagehorn et al., Citation2024a). In these trials, the average initial inversion peak moment was 13 ± 8.9 Nm. In comparison, the occurring moment in the injury trial was eight times higher (105.2 Nm). Since there is a lack of inversion moment mean values and standard error in shod conditions for similar movements, which are necessary for the sample size calculation, the expected difference in testing conditions had to be anticipated. We assumed an increase of 50% for the shod condition compared to the reference measurements which would result in an inversion moment of 19.5 Nm. Sample size calculation (two-sample paired-means test, power = 0.8, α = 0.05) estimated a required number of seventeen (N = 17) participants. To match these requirements and take potential dropouts into account, twenty active male participants with and without previous ankle sprain injury history were recruited, of which nineteen were included in the analysis (26 ± 5.4 years, 1.82 ± 0.07 m, 79.4 ± 9.6 kg). Inclusion criteria were as follows: (1) no injury in the lower extremities during the last 6 months (including ankle sprains), (2) no fractures, surgery or medical interventions at the ankle or knee joint, (3) active in sports with current or recent participation in team, indoor or racket sports, (4) shoe size EU 43 or 44. Participants’ ankle stability score was identified by using the self-administered Cumberland Ankle Instability Tool (CAIT) (Hiller et al., Citation2006). The leg with the lowest CAIT score was selected as ‘weak leg’ and used as the landing leg for all jumps. If both legs had an identical score this selection was made randomly. Landing on the weaker leg was intended to further challenge participants and potentially expose shoe-related influences.
2.5. Experimental setup
A standardised warmup was performed which included 5 min of running on a treadmill in the neutral shoe condition and three active stretching exercises which consisted of heel raises, one leg balance, and lateral lunges. Afterwards, a maximum vertical jump test was performed where participants were instructed to jump off single-legged with the same number of steps as in the subsequent jump-cut task. The best result out of three jumps was used as the maximum jump height.
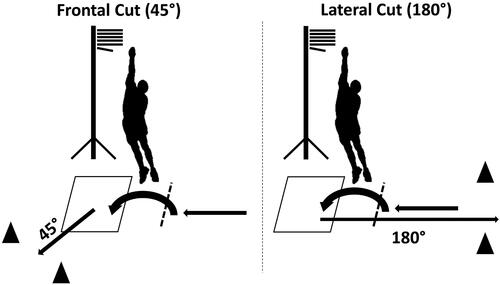
Participants were asked to perform forward-orientated 45° frontal cut (FC) and sideward-orientated 180° lateral cut (LC) following a preceding jump, based on a modified protocol used by Liu et al. (Citation2016) (). This challenging protocol incorporates sport-specific, multidirectional movements, and substantial vertical displacement. It was adapted to the heightened demands of changes of direction in court and indoor sports by adding subsequent cutting movements. Both jumps consisted of two preparatory steps (sideward shuffle steps for LC), followed by a single-legged take-off from their preferred leg and a jump to a height measurement device placed at 50% of the participant’s maximum vertical jump height. During the jump, participants were required to touch the device mid-air. Immediately after approaching the ground, the designated cut was initiated. Participants were instructed to approach the ground with their weaker leg first and aim for the centre of the force plate. This way the load was predominantly on their weaker leg, while they were able to include the other leg later during stance as support. The distance from the take-off line to the (centre of the) force plate was 70 cm. Five repetitions of each jump were performed in each of the three shoe conditions. Due to incomplete recordings of some participants the averages of four trials were utilised for kinematic analysis, while three trials were used for moment analysis.
Figure 2. Illustrations of the different jump-cut movements.
A three-dimensional marker-based motion analysis system (Qualisys, Gothenburg, Sweden, 24 cameras, 250 Hz) and one force plate (Kistler, Winterthur, Switzerland, 2500 Hz) were used for data recording. Forty-two retro-reflective markers were attached to prominent landmarks of the lower extremities and the shoes of the participants (). Marker trajectories and GRFs were filtered using a fourth-order low-pass Butterworth filter with a 20 Hz cut-off frequency. Joint angles were computed using the Cardan angle convention, and joint kinetics were determined using a standard inverse dynamic approach where all moments were reported as external moments (Hof, Citation1992). A raw vertical GRF threshold of 30 N was used for determining ground contact. All model calculations were performed using a custom MATLAB (R2021a, The Mathworks, Natick, USA) script.
2.6. Experimental outcomes
Time series data for the ankle and forefoot joints were extracted. In addition, distinct parameters such as peak ankle inversion, range of motion (ROM), and peak inversion velocity were calculated. Forefoot inversion and forefoot inversion ROM were defined as the movement of the forefoot relative to the rearfoot segment (foot torsion). Ankle moments in the frontal and sagittal plane were calculated and normalised to bodyweight. The ankle inversion moment represents the first peak in the frontal plane between 30 and 80 ms after ground contact. If no clear peak could be identified, then the maximum value of the moment curve within this time period was taken. This is the time window in which both, the first peak of ankle inversion and most ankle sprain injuries usually occur (Lysdal et al., Citation2022). Additionally, the distance of the point of force application towards the foot (POFA) and the GRF impulse were calculated to understand if the LBS stiffness and carbon plate design were sufficient to alter the participants’ kinetics. POFA was determined as the most distal point in the anterior-posterior direction from the metatarsophalangeal joint line (between 1st metatarsal and 5th metatarsal marker) during the latter half of ground contact. The first and last 5% of ground contact were excluded from the calculation of POFA due to possible noise errors. Impulse calculations were performed for all components of the ground reaction force.
2.7. Statistical methods
All data were checked for normality (Shapiro-Wilk test), homogeneity of variance (Levene test), and sphericity (Mauchly’s test). A repeated measures ANOVA (RMA) was performed, with the according experimental outcome as dependent variable and ‘shoe’ as independent variable. Afterwards, paired t-tests with Benjamini-Hochberg correction were performed to identify differences between conditions. If assumptions of normality, homogeneity, or sphericity were violated, logarithmic data transformation was applied. If violations persisted, corrected p-values were calculated using Welch t-test. Additional Statistical Parametric Mapping (SPM) time series analysis was performed to identify areas of intra-subject differences during the ground contact phase by using the provided repeated measure ANOVA function (Robinson et al., Citation2015). Post-hoc paired t-tests were performed to identify differences between conditions for these given areas (p = 0.05/n-tests). The alpha value for all other tests was set to 5% (p = 0.05). Power calculations were performed with the commercially available software Stata (StataCorp LLC, USA). For SPM, Python’s spm1d package (www.spm1d.org) was used, and for all other statistical analyses Python’s statistical package Pingouin (0.5.2) was employed.
3. Results
provides mean values, standard deviations, and the results of the RMA within-subject analysis (p-values). The p-values mentioned in the text represent post-hoc significance values.
Table 2. The mean kinematic and kinetic parameters, along with their standard deviations, computed for all cutting movements and shoe conditions.
There were no statistically significant differences in contact time observed between shoe conditions for either of the two jumps (). However, a significant increase in medial impulse was observed for ST1 during LC compared to both other conditions (p = 0.04).
3.1. Ankle kinematics
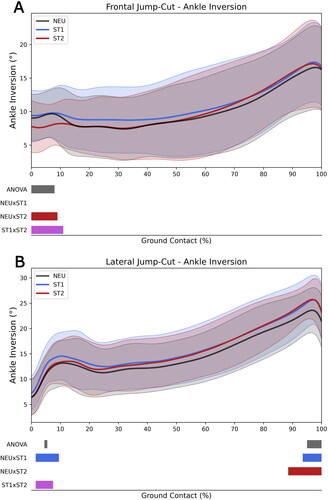
SPM analysis revealed significant differences (RMA, p = 0.03) in ankle inversion during FC immediately after ground contact, with ST2 showing lower values compared to NEU (p = 0.009) and ST1 (p = 0.006, ). During LC (RMA, p = 0.049 and 0.03) ankle inversion was significantly different right after ground contact (ST1 higher than NEU and ST2, p = 0.007 and 0.01) and at the end of ground contact (NEU lower than ST1 and ST2, p = 0.009 and 0.003).
Figure 3. Ankle inversion during ground contact for frontal (A) and lateral cuts (B). The bold lines represent average values, while shaded areas show standard deviations. Solid lines below the data illustrate results of the SPM analysis and indicate the time points where the threshold for significance was met. The grey area represents inter-subject repeated measure ANOVA among the three shoe conditions NEU, ST1, ST2 (p < 0.05). The red, blue, and magenta areas indicate post-hoc paired t-tests between shoe conditions (p < 0.05/n-tests).
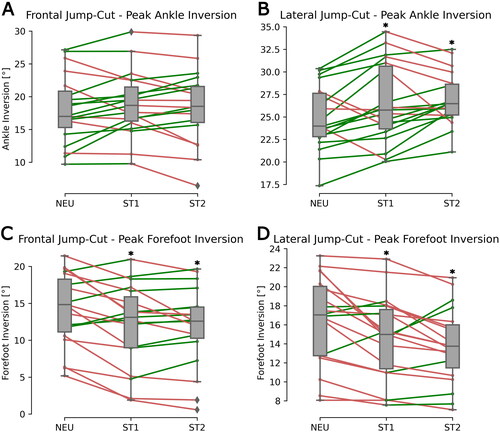
Differences between shoes in peak ankle inversion were observed during LC, with ST1 and ST2 showing a higher peak inversion compared to NEU (p = 0.036 and 0.003, ). During LC ankle inversion ROM increased significantly in the ST2 condition (p = 0.01 and 0.02). Ankle inversion at touchdown during FC significantly decreased in ST2 compared to NEU (p = 0.02) and ST1 (p = 0.01), and there was a trend for an increase in LC (RMA, p = 0.11). Ankle plantarflexion at touchdown increased in ST1 (p = 0.03) compared to NEU during LC and showed a strong similar trend for FC. No statistical differences were found for inversion velocity.
Figure 4. Paired plots of maximum ankle inversion (A,B) and forefoot inversion (C,D) during frontal (FC) and lateral cut (LC) across all four conditions. The ‘*’ symbol marks a significant difference compared to the NEU condition. Each line graph represents an individual participant. Green lines connecting conditions signify an increase in maximum angle, while red lines indicate a decrease.
3.2. Forefoot inversion
SPM analysis of all shoe conditions revealed significant differences in forefoot inversion during FC (RMA, p = 0.017) at the end of ground contact, with lower values for ST1 and ST2 than NEU (p = 0.008 and 0.004, ). Differences for LC were observed right after first ground contact (RMA, p = 0.046) and at the end of ground contact (RMA, p = 0.02) where both ST1 (p < 0.001, p = 0.015) and ST2 (p = 0.013, p = 0.003) were lower than NEU.
Figure 5. Forefoot inversion during ground contact for frontal (A) and lateral cuts (B). The bold lines represent average values, while shaded areas show standard deviations. Solid lines below the data illustrate results of the SPM analysis and indicate the time points where the threshold for significance was met. The grey area represents inter-subject repeated measure ANOVA among the three shoe conditions NEU, ST1, ST2 (p < 0.05). The red, blue, and magenta areas indicate post-hoc paired t-tests between shoe conditions (p < 0.05/n-tests).
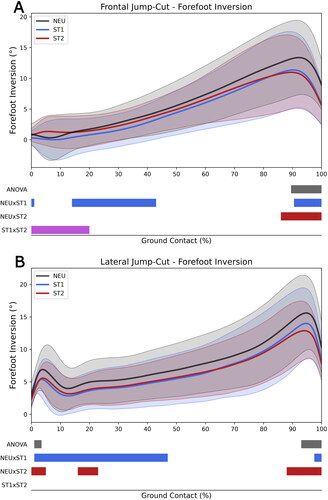
Peak forefoot inversion during FC and LC significantly reduced in ST1 (both p = 0.01) and ST2 (p = 0.01 and <0.001) compared to NEU (). Forefoot inversion ROM was significantly reduced in all stiffer shoe conditions and decreased with increasing shoe stiffness (p < 0.01), except NEU and ST1 during LC (p = 0.07).
3.3. Ankle kinetics
SPM analysis in the ankle frontal plane did not reveal any significant differences between the different footwear conditions. In the sagittal plane, the ankle dorsiflexion moment exhibited significant differences during FC (p = 0.045) at the end of ground contact (push-off) between NEU and ST2 (p = 0.013), with the stiff shoe condition displaying an increased moment ().
Figure 6. External dorsiflexion moment during ground contact for the frontal cut. The bold lines represent average values, while shaded areas show standard deviations. Solid lines below the data illustrate results of the SPM analysis and indicate the time points where the threshold for significance was met. The grey area represents inter-subject repeated measure ANOVA among three shoe conditions (NEU, ST1, ST2), while the yellow area includes the BF condition (both p < 0.05). The red, blue, and magenta areas indicate post-hoc paired t-tests between shoe conditions (p < 0.05/n-tests).
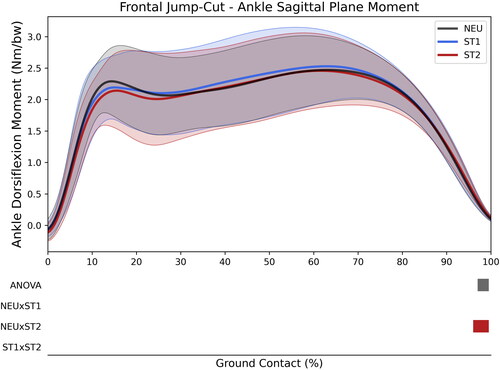
No statistically significant differences in the first peak ankle inversion moment could be observed between the different shoe conditions for any of the two jumps (Figure Sup1). Further analysis of the average dorsiflexion moment at 90–100% of ground contact revealed a similar, although not statistically significant, trend (p = 0.052) as the SPM analysis, indicating increased moments for ST2 (p = 0.02) and ST1 (p = 0.11) compared to NEU.
4. Discussion
This study aimed to assess the impact of longitudinal bending stiffness on the ankle and foot biomechanics during indoor and court sport-specific changes of direction, employing a modified jump-cut protocol. These findings may provide insights into the potential injury risk of lateral ankle sprains.
4.1. Kinematics
High longitudinal bending stiffness increased peak ankle inversion angle and ROM between the different shoe conditions during LC, which confirmed our first hypothesis. This observed increase might be due to a compensatory movement of the ankle caused by restricted foot mobility around its longitudinal axis (Graf & Stefanyshyn, Citation2013). These findings are in line with a previous study that found changes in ankle inversion during 180° tennis cutting movements (Martin et al., Citation2023). Cutting at an angle of 45° might not demand enough movement in the frontal plane of the foot to trigger this effect. This explenation is supported by previous simulations that predicted ankle inversion angles based on the cutting angle of athletes (Miller et al., Citation2021).
It is crucial to acknowledge that the increase in longitudinal bending stiffness, achieved through the implementation of carbon plates, is inherently linked to an increase in torsional stiffness. Our mechanical data supports this relationship between the two stiffness properties. Previous research by Graf and Stefanyshyn (Citation2013) has demonstrated that shoes with high torsional stiffness can increase ankle inversion and internal eversion moments, leading to an elevated risk of ankle sprains. Our study confirmed these findings specifically in relation to ankle inversion. Furthermore, as shoe stiffness increases, forefoot inversion is reduced, which compromises the natural torsional motion of the foot. This alteration in foot mechanics may explain the compensatory movement observed at the ankle joint, in the form of increased inversion angle and range of motion (ROM). Thus, it is evident that the combination of an increased forefoot bending stiffness and torsional stiffness affects ankle kinematics and likely contributes to an increased risk of ankle injuries. However, due to their reciprocal properties it was not possible to isolate their individual effects in this study.
The temporal characteristics of these effects provide valuable insights into the observed coping mechanism. Specifically, the peak ankle and forefoot inversion angles occur at the end of the ground contact phase. Notably, while both parameters exhibit differences during high-degree cutting movements, only forefoot peak inversion is significantly different during low-degree cuts. These findings suggest that the ankle compensates for the increased demand at the late stance phase of high-degree cuts, whereas foot torsion plays a more significant role during lower-degree cuts.
The SPM analysis revealed differences in ankle and forefoot inversion at the beginning of the ground contact phase, falling within the critical time window for ankle injuries between 30 and 80 ms (Lysdal et al., Citation2022). The kinematic analysis at touchdown indicated that ankle position was significantly affected in the stiffer shoe conditions. Although changes were inconsistent and varied between the two jump-cuts, these findings suggest that the approach towards the ground was altered with the stiffer shoe conditions. While inversion showed both a decrease and a trend for an increase, ankle and foot plantarflexion increased in both jumps at touchdown. Previous studies have suggested that a misalignment before initial contact can lead to ankle injuries (Bagehorn et al., Citation2024a; Gehring et al., Citation2013) and that specifically a more plantarflexed ankle position may make the ankle more susceptible for ankle sprains (Wright et al., Citation2000). Hence, the changed contact mechanics in the stiff footwear conditions may increase the likelihood of misalignment and an unfavourable ankle position at touchdown. In conclusion, the observations of this study, in combination with previous findings, indicate that stiff shoes put the ankle at a higher risk for lateral ankle sprain injuries during cutting manoeuvres, especially during high-degree cuts.
The curvature of the carbon plates inserted has been shown to be another crucial aspect affecting shoe performance (Ortega et al., Citation2021). Subjective feedback on comfort, stability, and fear of injury was collected from all participants after each shoe condition. Interestingly, no detectable differences were observed in any of the queried parameters, and the majority of participants reported an inability to perceive disparities between the various shoe conditions. This intriguing finding persisted despite the high stiffness of the shoe, implying that the curvature of the plates might facilitate a more natural rolling motion rather than active bending. A highly stiff shoe may be perceived as uncomfortable, and participants might encounter challenges in actively bending it, potentially having a negative impact on performance and compliance. Recent studies have shown that stiff carbon plate inserts can effectively influence the perception of participants negatively (Park et al., Citation2017), which was not the case in this study. Additionally, it should be noted that the forefoot bending stiffness used in this study was much higher than in numerous previous studies that focused on modifying torsion or forefoot bending stiffness, as well as in other carbon plate studies in running. In a recent review, among 15 studies, shoe stiffness ranged between 0.01 and 0.99 Nm/°, with a median of 0.16 Nm/°. Notably, only one study reported stiffer shoes compared to those used in the present study (Ortega et al., Citation2021). It is unlikely that participants were able to actively bend the shoe with a forefoot stiffness of 0.89 Nm/° (125 N/mm). The perceived bending is rather a result of compression of the shoe foam and a tilting movement of the plate. These findings demonstrate that the stiffness and geometry of the carbon plates can successfully alter human kinetics and kinematics while maintaining comfort and a natural rolling motion.
4.2. Kinetics
No meaningful difference in ankle inversion moment was observed between the different shoe conditions, therefore we could not confirm our second hypothesis. Consequently, an increase in longitudinal bending stiffness seems not to influence the ankle inversion moment during jump-cut movements. However, it is important to consider that this finding could be influenced by the jump-cut protocol used in this study. Nevertheless, other interesting changes in kinematics could be observed. During the frontal cut, we noted an increase in external dorsiflexion moments in the stiffest shoe condition (ST2) compared to the neutral condition (NEU) during the final 10% of the ground contact phase. Additionally, POFA shifted more distally during push-off with stiff shoes (ST1 and ST2) compared to NEU. Although the effect was not significant for the FC, there was a noticeable trend (p = 0.17), and it approached significance for the LC (p = 0.056).
Research investigating the contact time in footwear with increased longitudinal bending stiffness has yielded conflicting findings, as certain studies report alterations in contact time while others do not. (Ortega et al., Citation2021). The impulse of the GRF is linked to the contact time and is calculated by integrating the GRF over that period. An increased impulse, when contact time remains constant, implicates a higher GRF, potentially enhancing performance, as reflected in improved cutting times and jump height. Conversely, an extended contact time could have a negative impact on performance (Graf & Stefanyshyn, Citation2013). However, research on changes in ground contact time during studies involving changes of direction is limited. In a study by Graf & Stefanyshyn (Citation2013) that included cutting movements, no changes in ground contact time or impulse were observed. Contrarily, in our study, we observed an increase in medial GRF impulse solely for the ST1 condition during LC, while ground contact time remained constant across all shoe conditions. This implies heightened ground reaction forces in the ST1 condition and a potentially increased performance. Given that this pattern was not observed in any other conditions, it could be inferred that the longitudinal bending stiffness employed in the ST1 condition is likely the most optimal for enhancing 180° cutting performance.
The observed increase in GRF impulse, dorsiflexion moment, and the trend for distally shifted POFA could be associated with change in gear ratio at the ankle, implying potential alterations in triceps surae muscle contraction efficiency and energy expenditure (Ortega et al., Citation2021; Willwacher et al., Citation2014). However, it’s important to note that these findings exhibited trends or lacked consistency across various shoe conditions and movements. With a larger participant pool or more valid trials, these parameters could have achieved greater significance. Therefore, drawing definitive conclusions regarding the optimal bending stiffness for performance benefits remains challenging. Nevertheless, these findings indicate that stiff shoe conditions created a larger moment arm for the ankle during cutting movements. While we did not investigate the impact on power output, as our study focused on injury rather than performance, these findings clearly demonstrate that the carbon plates were able to successfully alter human kinetics and kinematics. And in conclusion, these findings serve as a great foundation for further research in this field.
Several studies have examined the performance implications of carbon plates or increased forefoot stiffness, but they did not observe significant changes in foot kinematics or kinetics (W. K. Lam et al., Citation2018; Park et al., Citation2017; Gregory et al., Citation2018). There could be several reasons for this lack of observed effects. Firstly, the differences in shoe stiffness may have been too small to elicit noticeable changes. Secondly, the protocols used in these studies may not have included cutting movements with a high enough degree of cutting angle, or thirdly, the overall demands of the protocol may not have been sufficient for an athletic population. Unfortunately, some studies (Tinoco et al., Citation2010; Worobets & Wannop, Citation2015) focused solely on reporting performance parameters and did not provide insights into potential alterations in foot and ankle kinematics.
Furthermore, it remains unknown whether the changes in kinematics are mainly caused by torsion or longitudinal stiffness. Our data revealed a strong correlation (R2 = 0.95) between longitudinal and torsional stiffness when utilising standard carbon plates. This finding suggests that modifications aimed at increasing longitudinal bending stiffness in footwear may inadvertently affect torsional stiffness as well. Future research should investigate this relationship in unmodified footwear and explore alternative technologies that can enhance longitudinal bending stiffness while maintaining low torsional stiffness. The benefits of increased longitudinal bending stiffness must be balanced against the increased injury risks, which are more significant in lateral sports with frequent changes of direction than in sagittal plane movements like running and walking.
4.3. Strengths and limitations
We observed a non-systematic change in frontal plane moments between shoes, along with a high standard deviation. Surprisingly, some participants primarily displayed an eversion moment, which contradicted our initial expectations. Previous studies reported initial inversion moments right after landing (Bagehorn et al., Citation2024a). We believe that this inconsistency may be attributed to the low repeatability of the performed jumps. Previous studies have indicated the challenges of assessing the functionality and health status of ankle joints in athletic cohorts due to their effective coping mechanisms (Liu et al., Citation2013). To address this, a high-complexity protocol was selected. However, the complexity of the preceding jumps might have influenced landing positions, resulting in varied compensational movements among participants and a wide variation in recorded ankle joint moments.
The external moments generated at the ankle are highly dependent on various factors such as POFA, force magnitude, and the estimated ankle joint centre. These moment calculations are relatively stable for the knee and hip, but minor changes in these parameters can result in significant changes for the ankle, which is located in close proximity to the ground. Moreover, the unstable GRF vector during the first milliseconds after ground contact is crucial for the moment calculation, and the initial inversion peak is expected to occur during this time window. However, due to several hardware issues, some force plate measurements showed a dramatic offset of the point of force application and were excluded from the moment calculations. As a result, we could only use three trials per condition and subject instead of the initially planned five trials, which has further weakened the statistical power of our calculations. The variations in jump-cut executions seem to be high, making it difficult to identify effects between shoe conditions. Although the intention was to standardise the intensity and increase the complexity of cutting movements, it was not beneficial for the moment calculations. In future studies, performing cutting movements from running movements and standardising with the help of light gates might be a better solution. Furthermore, while some investigated parameters did not exhibit significant differences, they displayed clear trends. These trends could become more pronounced by enhancing statistical power with an increased number of participants. Moreover, future studies should aim to explore sex differences, which were not feasible in the present study due to limitations in shoe and carbon plate sizes.
In this study, markers were attached to the heel elements and upper material of the shoes. This inhibits certain limitations because it is unclear how the foot moves inside the shoe. Ankle inversion in biomechanical models is commonly defined as the movement of the heel compared to the shank segment. Previous research has highlighted that the actual movement of the heel inside the shoe may be underestimated (Alcantara et al., Citation2018). This suggests that the range of motion and maximum inversion angle of the ankle could be even higher than reported, potentially increasing the risk of injury. The same could be true for forefoot-to-heel movement (foot torsion). However, in the context of the measurements conducted in this study, the observed shoe movement was primarily reduced by increased stiffness. The higher demanded force to bend the shoe was beyond the participants’ capacity, particularly in terms of torsional foot movement. As a result, compensatory movements at the ankle joint may have occurred, which potentially even exceeded the measured values. The authors of this study acknowledged the limitations associated with using external markers. Placing markers on the forefoot and heel through holes in the shoe without touching the shoe’s upper is challenging and can compromise the shoe’s integrity. This is particularly true when performing rapid changes of direction. Due to these challenges and the study’s exploratory design, the authors chose to place markers on the outside of the shoe.
5. Conclusion
The study sought to assess ankle sprain-related joint loading using an exploratory jump-cut protocol, measuring ankle kinematics and kinetics across various shoe conditions with a wide range of stiffness levels. In conclusion, footwear significantly impacts foot and ankle biomechanics during intense jump-cut movements. Increased longitudinal bending stiffness leads to higher torsional stiffness, affecting ankle and foot kinematics and potentially raising the risk of lateral ankle sprains. Further, longitudinal studies are needed to explore the actual injury occurrence in-depth and better understand the implications of shoe stiffness on injury prevention.
Supplemental Material
Download JPEG Image (1.1 MB)
Acknowledgements
We thank Leon Robertz for being a great support during data collection.
Disclosure statement
No potential conflict of interest was reported by the author(s).
Additional information
Funding
References
- Alcantara, R. S., Trudeau, M. B., & Rohr, E. S. (2018). Calcaneus range of motion underestimated by markers on running shoe heel. Gait & Posture, 63, 68–72. https://doi.org/10.1016/j.gaitpost.2018.04.035
- Bagehorn, T., De Zee, M., Fong, T. P., Thorborg, K., Kersting, U. G., & Lysdal, F. G. (2024). Lateral ankle joint injuries in indoor and court sports – A systematic video analysis of 445 non-consecutive case series. The American Journal of Sports Medicine (in press).
- Bagehorn, T., Bill, K., Mai, P., Krosshaug, T., & Kersting, U. G. (2024a). A biomechanical report of an acute lateral ankle sprain during a handball-specific cutting movement. Sports Biomechanics. https://doi.org/10.1080/14763141.2024.2319134
- Bagehorn, T., Bill, K., Mai, P., Krosshaug, T., & Kersting, U. G. (2024b). Impact of footwear bending and torsional stiffness on ankle biomechanics during handball specific fake-and-cut maneuvers. ISBS Conference Proceedings (Manuscript submitted for publication).
- Delahunt, E., & Remus, A. (2019). Risk factors for lateral ankle sprains and chronic ankle instability. Journal of Athletic Training, 54(6), 611–616. https://doi.org/10.4085/1062-6050-44-18
- Dufek, J. S., & Bates, B. T. (1991). Biomechanical factors associated with injury during landing in jump sports. Sports Medicine, 12(5), 326–337. https://doi.org/10.2165/00007256-199112050-00005
- Fahlström, M., Björnstig, U., & Lorentzon, R. (1998). Acute badminton injuries. Scandinavian Journal of Medicine & Science in Sports, 8(3), 145–148. https://doi.org/10.1111/j.1600-0838.1998.tb00184.x
- Fong, D. T., Chan, Y.-Y., Mok, K.-M., Yung, P. S., & Chan, K.-M. (2009). Understanding acute ankle ligamentous sprain injury in sports. BMC Sports Science, Medicine and Rehabilitation, 1(1), 14. https://doi.org/10.1186/1758-2555-1-14
- Gehring, D., Wissler, S., Mornieux, G., & Gollhofer, A. (2013). How to sprain your ankle – A biomechanical case report of an inversion trauma. Journal of Biomechanics, 46(1), 175–178. https://doi.org/10.1016/j.jbiomech.2012.09.016
- Graf, E. S., & Stefanyshyn, D. (2013). The effect of footwear torsional stiffness on lower extremity kinematics and kinetics during lateral cutting movements. Footwear Science, 5(2), 101–109. https://doi.org/10.1080/19424280.2013.789561
- Herzog, M. M., Mack, C. D. F., Dreyer, N. A., Wikstrom, E. A., Padua, D. A., Kocher, M. S., DiFiori, J. P., & Marshall, S. W. (2019). Ankle sprains in the National Basketball Association, 2013-2014 through 2016-2017. The American Journal of Sports Medicine, 47(11), 2651–2658. https://doi.org/10.1177/0363546519864678
- Hiller, C. E., Refshauge, K. M., Bundy, A. C., Herbert, R. D., & Kilbreath, S. L. (2006). The Cumberland Ankle Instability Tool: A report of validity and reliability testing. Archives of Physical Medicine and Rehabilitation, 87(9), 1235–1241. https://doi.org/10.1016/j.apmr.2006.05.022
- Hillstrom, H. J., Buckland, M. A., Slevin, C. M., Hafer, J. F., Root, L. M., Backus, S. I., Kraszewski, A. P., Whitney, K. A., Scher, D. M., Song, J., Furmato, J., Choate, C. S., & Scherer, P. R. (2013). Effect of shoe flexibility on plantar loading in children learning to walk. Journal of the American Podiatric Medical Association, 103(4), 297–305. https://doi.org/10.7547/1030297
- Hof, A. L. (1992). TECHNICAL NOTE. An expression for the moment in multibody systems. Journal of Biomechanics, 25(10), 1209–1211. https://doi.org/10.1016/0021-9290(92)90076-d
- Lam, W. K., Lee, W. C. C., Lee, W. M., Ma, C. Z. H., & Kong, P. W. (2018). Segmented forefoot plate in basketball footwear: Does it influence performance and foot joint kinematics and kinetics? Journal of Applied Biomechanics, 34(1), 31–38. https://doi.org/10.1123/jab.2017-0044
- Lam, W.-K., Kan, W. H., Chia, J. S., & Kong, P. W. (2019). Effect of shoe modifications on biomechanical changes in basketball: A systematic review. Sports Biomechanics, 21(5), 577–603. https://doi.org/10.1080/14763141.2019.1656770
- Liu, K., Glutting, J., Wikstrom, E., Gustavsen, G., Royer, T., & Kaminski, T. W. (2013). Examining the diagnostic accuracy of dynamic postural stability measures in differentiating among ankle instability status. Clinical Biomechanics (Bristol, Avon), 28(2), 211–217. https://doi.org/10.1016/j.clinbiomech.2012.11.003
- Liu, K., Dierkes, C., & Blair, L. (2016). A new jump-landing protocol identifies differences in healthy, coper, and unstable ankles in collegiate athletes. Sports Biomechanics, 15(3), 245–254. https://doi.org/10.1080/14763141.2016.1158859
- Lysdal, F. G., Wang, Y., Delahunt, E., Gehring, D., Kosik, K. B., Krosshaug, T., Li, Y., Mok, K.-M., Pasanen, K., Remus, A., Terada, M., & Fong, D. T. P. (2022). What have we learnt from quantitative case reports of acute lateral ankle sprains injuries and episodes of ‘giving-way’ of the ankle joint, and what shall we further investigate? Sports Biomechanics, 21(4), 359–379. https://doi.org/10.1080/14763141.2022.2035801
- Martin, C., Touzard, P., Horvais, N., Puchaud, P., Kulpa, R., Bideau, B., & Sorel, A. (2023). Influence of shoe torsional stiffness on foot and ankle biomechanics during tennis forehand strokes. European Journal of Sport Science, 23(6), 914–924. https://doi.org/10.1080/17461391.2022.2153232
- McKay, G. D., Goldie, P. A., Payne, W. R., & Oakes, B. W. (2001). Ankle injuries in basketball: Injury rate and risk factors. British Journal of Sports Medicine, 35(2), 103–108. https://doi.org/10.1136/bjsm.35.2.103
- Michel, F. I., Kälin, X., Metzger, A., Westphal, K., Schweizer, F., Campe, S., & Segesser, B. (2009). The functional sport shoe parameter “torsion” within running shoe research–A literature review. Sportverletzung Sportschaden, 23(4), 197–205. https://doi.org/10.1055/s-0028-1109849
- Miller, P., Brinkmann, D. J., Ramsenthaler, C., Gollhofer, A., & Gehring, D. (2021). Mind your step: Predicting maximum ankle inversion during cutting movements in soccer. Sports Biomechanics, 00(00), 1–15. https://doi.org/10.1080/14763141.2021.1974533
- Ortega, J. A., Healey, L. A., Swinnen, W., & Hoogkamer, W. (2021). Energetics and biomechanics of running footwear with increased longitudinal bending stiffness: A narrative review. Sports Medicine, 51(5), 873–894. https://doi.org/10.1007/s40279-020-01406-5
- Park, S. K., Lam, W. K., Yoon, S., Lee, K. K., & Ryu, J. (2017). Effects of forefoot bending stiffness of badminton shoes on agility, comfort perception and lower leg kinematics during typical badminton movements. Sports Biomechanics, 16(3), 374–386. https://doi.org/10.1080/14763141.2017.1321037
- Robert W. Gregory, Robert S. Axtell, Marc I. Robertson, & William R. Lunn. (2018). The effects of a carbon fiber shoe insole on athletic performance in collegiate athletes. Journal of Sports Science, 6(4), 219–230. https://doi.org/10.17265/2332-7839/2018.04.001
- Robinson, M. A., Vanrenterghem, J., & Pataky, T. C. (2015). Statistical Parametric Mapping (SPM) for alpha-based statistical analyses of multi-muscle EMG time-series. Journal of Electromyography and Kinesiology, 25(1), 14–19. https://doi.org/10.1016/j.jelekin.2014.10.018
- Roy, J. P. R., & Stefanyshyn, D. J. (2006). Shoe midsole longitudinal bending stiffness and running economy, joint energy, and EMG. Medicine and Science in Sports and Exercise, 38(3), 562–569. https://doi.org/10.1249/01.mss.0000193562.22001.e8
- Stefanyshyn, D. J., & Nigg, B. M. (2000). Influence of midsole bending stiffness on joint energy and jump height performance. Medicine and Science in Sports and Exercise, 32(2), 471–476. https://doi.org/10.1097/00005768-200002000-00032
- Stefanyshyn, D. J., & Wannop, J. W. (2016). The influence of forefoot bending stiffness of footwear on athletic injury and performance. Footwear Science, 8(2), 51–63. https://doi.org/10.1080/19424280.2016.1144652
- Takahashi, K. Z., Gross, M. T., Van Werkhoven, H., Piazza, S. J., & Sawicki, G. S. (2016). Adding stiffness to the foot modulates soleus force-velocity behaviour during human walking. Scientific Reports, 6(1), 29870. https://doi.org/10.1038/srep29870
- Taylor, J. B., Nguyen, A.-D., Parry, H. A., Zuk, E. F., Stewart Pritchard, N., & Ford, K. R. (2019). Modifying misdole stiffness of basketball footwear affects foot and ankle biomechanics. International Journal of Sports Physical Therapy, 14(3), 359–367. https://doi.org/10.26603/ijspt20190359
- Tinoco, N., Bourgit, D., & Morin, J.-B. (2010). Influence of midsole metatarsophalangeal stiffness on jumping and cutting movement abilities. Proceedings of the Institution of Mechanical Engineers, Part P: Journal of Sports Engineering and Technology, 224(3), 209–217. https://doi.org/10.1243/17543371JSET69
- Willwacher, S., König, M., Braunstein, B., Goldmann, J. P., & Brüggemann, G. P. (2014). The gearing function of running shoe longitudinal bending stiffness. Gait & Posture, 40(3), 386–390. https://doi.org/10.1016/j.gaitpost.2014.05.005
- Worobets, J., & Wannop, J. W. (2015). Influence of basketball shoe mass, outsole traction, and forefoot bending stiffness on three athletic movements. Sports Biomechanics, 14(3), 351–360. https://doi.org/10.1080/14763141.2015.1084031
- Wright, I. C., Neptune, R. R., Van Den Bogert, A. J., & Nigg, B. M. (2000). The influence of foot positioning on ankle sprains. Journal of Biomechanics, 33(5), 513–519. https://doi.org/10.1016/S0021-9290(99)00218-3