
 ?Mathematical formulae have been encoded as MathML and are displayed in this HTML version using MathJax in order to improve their display. Uncheck the box to turn MathJax off. This feature requires Javascript. Click on a formula to zoom.
ABSTRACT
This article measures the ten-year development progress of 47 least developed countries (LDCs) based on comparing the development performances of 217 countries and economies. A methodology based on the theory of statistical process control is used to evaluate development performances in three dimensions: per capita income, life expectancy, and education. This methodology uses a pair of average and standard deviation charts to measure each LDC’s degree of growth and stability of growth in each dimension of development, and uses the three standard deviation limits in each chart to identify exceptional development performances that are outside the upper or lower limit. This article has three key findings on the exceptional development performances of LDCs in the context of world development over 2010–2019: (1) Seventeen LDCs achieved exceptionally high increases in life expectancy; (2) one LDC achieved exceptionally high growth in per capita income, but two LDCs had exceptionally low performances in the growth of per capita income; and (3) six LDCs experienced exceptionally unstable growth of per capita income. These findings shed some light on the future development priorities for LDCs. The reliability of analysis is also discussed.
1. Introduction
As of 2019, 47 countries were designated by the United Nations as least developed countries (LDCs) (UNCTAD Citation2019). This article aims to measure the ten-year development progress of LDCs over 2010–2019. Such evaluation may not only provide evidence for assessing the effectiveness of development policies and programmes in LDCs during 2010–2019, but may also be useful for planning the future development of LDCs.
In measuring the development of 169 countries and economies (collectively referred to as “economies” hereafter) based on the data of 2010, the Human Development Index (HDI) ranked LDCs from No. 120 to No. 168 (seven LDCs were not ranked due to lack of data) (UNDP Citation2010); based on the data of 2019, the HDI ranked LDCs from No. 129 to No. 189 among 189 economies (two LDCs were not ranked due to lack of data) (UNDP Citation2020b). From 2010 to 2019, most LDCs were ranked at the bottom of the HDI rankings.
The HDI measures the level of development that an economy reached in a certain year (e.g. 2019). The HDI combines the measures of achievements in three key dimensions of human development (i.e. life expectancy, education, and per capita income) into a single index (UNDP Citation2020b). In each Human Development Report, the HDI values of economies are calculated usually based on one-year data; economies are ranked based on their HDI values from high to low. Essentially, the HDI is a composite index that uses a multi-criterion (i.e. three dimensions of development) and single-period (i.e. one year) performance measurement method.
However, if only the level of development that each economy reached in a certain year is measured, then similar results (such as the HDI rankings) that most LDCs are ranked at the bottom are obtained again and again. This may give the impression that LDCs had worse development progress than most non-LDC economies in any period of time, which, as demonstrated later in this article, is not true. More critically, the evaluation results based on single-year data may potentially make many development achievements or problems unnoticed. As an LDC, for example, Ethiopia averaged 6.24% annual growth in GNI per capita during 2012–2019 (with no data in 2010 or 2011), which was the third highest average growth rate among all economies over 2010–2019 (World Bank Citation2021b); Ethiopia also achieved an annual increase of 0.5952 years on average in life expectancy during 2010–2019 (World Bank Citation2021c). Ethiopia’s these extraordinary achievements in development over 2010–2019 can hardly be noticed from its low HDI rankings of No. 157 (among 169 economies) in 2010 and No. 173 (among 189 economies) in 2019 (UNDP Citation2010, Citation2020b).
Therefore, in addition to measuring the level of development that each LDC reached in a certain year (e.g. 2019), it is desirable to measure the degree of growth that each LDC’s development brought about over a period of time (e.g. 2010–2019). The degree of growth over a multiyear period can provide valuable information about the effectiveness of each LDC’s development policies and programmes during that period.
Furthermore, development is a dynamic and multifaceted process (Adelman Citation1999). Although a composite index (e.g. the HDI) can be used to rank LDCs and other economies, it may not be easy to use a composite index to analyse an LDC’s progress in each individual dimension (e.g. per capita income, life expectancy, or education) of development. Because an LDC may have varying performances in different dimensions of development, it is important to measure its development progress in individual dimensions for planning future development.
Based on the above discussion, this article has two research objectives:
| (1) | Measure the ten-year development progress of LDCs in terms of the degrees of growth brought about by their development over 2010–2019. | ||||
| (2) | Use this evaluation to shed some light on the future development priorities for LDCs. | ||||
2. Selection of Development Indicators
In this section, indicators will be selected for measuring LDCs’ development progress in multiple dimensions. The availability of data, which is crucial for measuring multiyear development progress, will also be taken into account when selecting development indicators.
This study has two fundamental considerations in selecting indicators to measure the development progress of LDCs.
First, development is “a holistic process”, not just “an economic process” (Macekura Citation2020, 90). Because the HDI’s three dimensions (i.e. life expectancy, education, and GNI per capita) represent many important aspects of development (UNDP Citation2020b), these three dimensions are comprehensive and representative for measuring the development progress of LDCs. Specifically, GNI per capita reflects economic growth and living standards, while life expectancy and educational opportunities reflect social development and the quality of life.
Second, “the annual increase” or “the annual growth rate” can be used to measure each LDC’s degree of growth brought about by its development.
Based on the above two considerations, this article uses the following three indicators to measure the development progress of LDCs over a period of time: (1) the annual growth rate of GNI per capita, (2) the annual increase in life expectancy at birth, and (3) the annual increase in the gross enrollment ratio of tertiary education. More reasons for selecting these three indicators are elaborated as follows.
| (1) | The annual growth rate of GNI per capita. The United Nations uses GNI per capita in reviewing the development of LDCs (UNCTAD Citation2019) and calculating the HDI (UNDP Citation2020b); the World Bank also uses GNI per capita to categorise income groups (World Bank Citation2022a). Therefore, this article uses the increase in GNI per capita to measure LDCs’ progress of developing economy and improving living standards. | ||||
Because order-of-magnitude differences exist in the annual growth amounts of GNI per capita among economies, the annual growth rate is more appropriate than the annual growth amount for comparing the degrees of growth in GNI per capita among economies.
| (2) | The annual increase in life expectancy at birth. Life expectancy is used in calculating the HDI (UNDP Citation2020b). The increase in life expectancy is attributable to many aspects of development, such as “public health, medicine, wealth and income, nutrition, behavior, and education” (Riley Citation2001, xi); improvement in life expectancy and economic growth are related (Felice, Andreu, and D’Ippoliti Citation2016); the performance of increasing life expectancy may also reflect a number of issues in development, such as inequalities (Kontis et al. Citation2017; UNDP Citation2020b), violence (Guichaoua Citation2015), and pollution (Chen et al. Citation2013). Therefore, the increase in life expectancy is a meaningful and comprehensive indicator of development progress; the use of the increase in life expectancy as a development indicator also reflects the goal of development to promote the well-being of the population as a whole. | ||||
| (3) | The annual increase in the gross enrollment ratio of tertiary education. Education is of critical importance for many aspects of development, such as reducing poverty, advancing equity, increasing human capital, promoting knowledge generation and sharing, protecting environment and mitigating climate change, reducing deaths due to disasters, and increasing sociopsychological resilience (UNDP Citation2020b). Improvement in education is also a meaningful and comprehensive indicator of development progress. | ||||
This article selects “the annual increase in the gross enrollment ratio of tertiary education” as an indicator to measure LDCs’ development progress in education for several reasons (including the availability of data). First, the World Bank datasets of literacy rates, mean years of schooling, and educational attainment rates have much sparser data than the datasets of primary, secondary, and tertiary enrollment ratios (World Bank Citation2022b). Sufficient data are needed for making a reliable assessment of each LDC’s development progress. Second, many economies already achieved high and stable enrollment ratios of primary and secondary education many years ago. For those economies, it is not meaningful to compare their annual increases in the enrollment ratio of primary or secondary education with those of LDCs. In contrast, most economies are still in the process of developing tertiary education. Third, the increase in the enrollment ratio of tertiary education also reflects the achievement of developing primary and secondary education. Fourth, tertiary education is important for economic growth. A study suggested that “tertiary education may well have an important role to play in the growth process” (Chatterji Citation1998); another study found that “all levels of education human capital, including higher education human capital, have positive and statistically significant effect on the growth rate of per capita income in African countries” (Gyimah-Brempong, Paddison, and Mitiku Citation2006). Fifth, the World Bank provides the dataset of the gross enrollment ratio of tertiary education, but no dataset of the net enrollment ratio of tertiary education (World Bank Citation2022b). Lastly, the gross enrollment ratio of tertiary education is an important indicator for measuring the development of tertiary education. The annual increase in the gross enrollment ratio of tertiary education can generally reflect the development trend of the scale of tertiary education and educational opportunities.
3. A Methodology for Measuring Development Progress
Because there are no absolute standards regarding what development progress is satisfactory, this article proposes to use a methodology to measure the development progress of LDCs based on comparing the development performances of all economies in the world. This methodology is based on the theory of statistical process control (SPC).
Since Walter A. Shewhart proposed statistical process control charts (Shewhart Citation1931), they have been not only widely used to detect exceptional variations in processes (Montgomery Citation2020; Wheeler Citation2004), but also applied to performance evaluation for countries, organisations, individuals, and products and services, such as evaluating the compulsory education performances of countries and economies (Bi Citation2018a), evaluating the sustainability performances of companies (Maltz, Bi, and Bateman Citation2018), evaluating the teaching performances of teachers (Bi Citation2018b, Citation2020, Citation2022), and evaluating the performances of airports, hotels, and vehicles (Bi Citation2017).
Conventionally, a Shewhart statistical process control chart has a centerline, an upper limit, and a lower limit. The centerline represents a target or average performance value. The upper and lower limits are typically three standard deviations away from the centerline and thus are called three-sigma (3σ) limits. The upper and lower limits are used to signal normal performance, which usually appears between the upper and lower limits when only common causes (or chance causes) are present, and exceptional performance, which usually appears outside the upper or lower limit and is attributable to special causes (or assignable causes). Common and special causes will be discussed in detail later in this article.
This article proposes to use an SPC method to measure development progress, which includes the degree of growth and the variation in growth that development brought about over a period of time (e.g. 2010–2019). For each development indicator, this method uses a pair of average and standard deviation charts ( charts) from the theory of statistical process control to measure the development progress of all economies (including LDCs) in the world. The following are the theoretical and methodological reasons for using
charts to measure the development progress of economies (using the annual growth rate of GNI per capita for explanation).
First, variations exist in every economy’s GNI per capita growth process. An economy’s GNI per capita annual growth rate usually varies from year to year. Hence, when measuring an economy’s performance of GNI per capita growth over a period of time, it is important to measure both the mean and the variation of its GNI per capita annual growth rates. A pair of charts can be used to measure both the mean and the variation of each economy’s GNI per capita annual growth rates. An economy’s GNI per capita annual growth rates over a given period (e.g. 2010–2019) constitute a sample (such as Ethiopia’s annual growth rates in ), where the sample mean (such as 6.24% in ) is represented by a point in an average chart (
chart) and the sample standard deviation (such as 1.14% in ) is represented by a point in a standard deviation chart (S chart). A pair of
charts are useful for assessing how high each economy’s average of GNI per capita annual growth rates is (from the
chart) and how stable each economy’s GNI per capita growth is (from the S chart).
Table 1. Ethiopia’s annual growth rates of GNI per capita based on constant local currency, 2010–2019 (World Bank Citation2021b).
In , 6.24% (or 6.24475% with more precision) is a geometric mean. It means that given Ethiopia’s GNI per capita (constant LCU) of 10,847.92 in 2011 (World Bank Citation2021a), if its GNI per capita would grow by 6.24475% each year during 2012–2019, then it would reach its actual GNI per capita (constant LCU) of 17,611.90 in 2019 (World Bank Citation2021a). The geometric mean is more appropriate than the arithmetic mean for determining the average of GNI per capita annual growth rates.
Second, there are well-established formulas for calculating the values of the upper and lower limits in charts (see the Appendix).
Third, all samples of economies in an or S chart contribute to determining the upper and lower limits; no subjectively determined values are used in calculating the values of the upper and lower limits. Therefore, the upper and lower limits in
charts are objective assessment standards for measuring the development progress of economies.
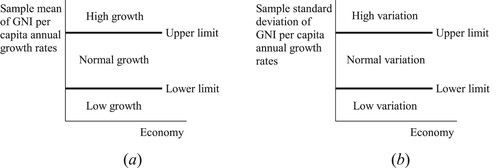
Fourth, as the objective assessment standards, the upper and lower limits naturally divide an chart (or S chart) into three sections. As shown in , when
charts are used to evaluate the performance of GNI per capita growth, the three sections in an
chart represent the high, normal, and low degree of growth, respectively; the three sections in an S chart represent the high, normal, and low variation in growth, respectively.
Figure 1. Three sections in charts for evaluating the performance of GNI per capita growth (a)
chart (b) S chart.
Fifth, there is a rigorous statistical foundation for identifying exceptional performance outside the upper or lower limit of charts. According to the theory of statistical process control, the 3σ limits of
charts are sufficiently robust to ensure that any point falling outside the 3σ limits signals the potential existence of an exceptionally high (or low) performance level in an
chart, or an exceptionally high (or low) variation in performance in an S chart. For evaluating the GNI per capita growth performances of economies, any point falling outside the 3σ limits signals the potential existence of an economy that had an exceptionally high (or low) degree of growth in an
chart, or had an exceptionally high (or low) variation in growth in an S chart.
Lastly, charts can be used for samples of varying sizes. This feature is important because for different economies over the same period of time (e.g. 2010–2019), there may be different numbers of years’ data available for various reasons. For instance, the dataset has only eight data of Ethiopia’s GNI per capita annual growth rates over 2010–2019 (see ).
4. Measuring the Development Progress of LDCs
This section measures the ten-year development progress of 47 LDCs in the context of world development over 2010–2019.
4.1. Data
The World Bank provides the datasets of “GNI per capita growth (annual %)”, “Life expectancy at birth, total (years)”, and “School enrollment, tertiary (% gross)” (World Bank Citation2021b, Citation2021c, Citation2021d). In this article, all available data during 2010–2019 will be used to measure the development progress of 217 economies (including 47 LDCs) listed in these three datasets, while one or more datasets may lack data for some economies.
lists the names of 217 economies in the World Bank datasets, including 47 LDCs in three geographical/structural groups (UNCTAD Citation2019).
Table 2. List of 217 economies (including 47 LDCs) in the World Bank datasets.
4.2. Calculations and Results
For each of the three selected development indicators, this study calculates each economy’s sample size n, sample mean (which is the geometric mean for GNI per capita annual growth rates and the arithmetic mean for the other two indicators, respectively), and sample standard deviation s. For example, eight GNI per capita annual growth rates in constitute a sample for Ethiopia (note that Ethiopia’s number is 65 in ):
,
,
. The arithmetic mean of Ethiopia’s annual increases in life expectancy during 2010–2019 is 0.5952 years. Given its life expectancy of 60.645 years in 2009 (World Bank Citation2021c), if its life expectancy would increase by 0.5952 years each year during 2010–2019, then it would reach its actual life expectancy of 66.597 years in 2019 (World Bank Citation2021c). Similarly, the arithmetic mean of Ethiopia’s annual increases in the gross enrollment ratio of tertiary education during 2010–2012 is 0.95% (note that only three-year data are available). Given its gross enrollment ratio of 5.37% in 2009 (World Bank Citation2021d), if its gross enrollment ratio would increase by 0.95% each year during 2010–2012, then it would reach its actual gross enrollment ratio of 8.22% in 2012 (World Bank Citation2021d).
Then, the values of each economy’s upper and lower limits in charts are calculated using Formulas (1)∼(5) in the Appendix. Finally, a pair of
charts for evaluating the performance of GNI per capita growth are constructed in , where the numbers representing economies correspond to those in .
Figure 2. charts: The annual growth rate of GNI per capita, 2010–2019.
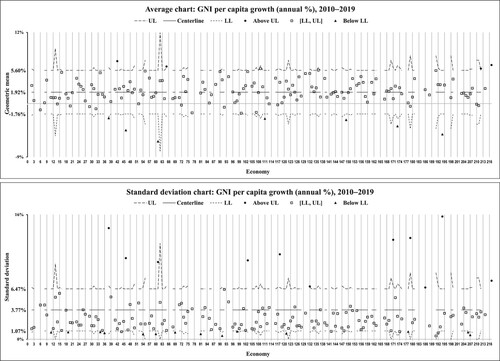
In , the points with flat lines of upper and lower limits imply that the dataset has ten-year data of GNI per capita annual growth rates for the economies represented by these points; the points with non-flat lines of upper and lower limits imply that the dataset has fewer than ten-year data for the economies represented by these points.
Similarly, charts in and are constructed for the other two development indicators, respectively.
Figure 3. charts: The annual increase in life expectancy at birth, 2010–2019.
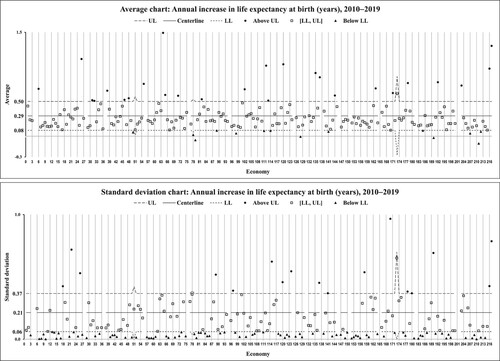
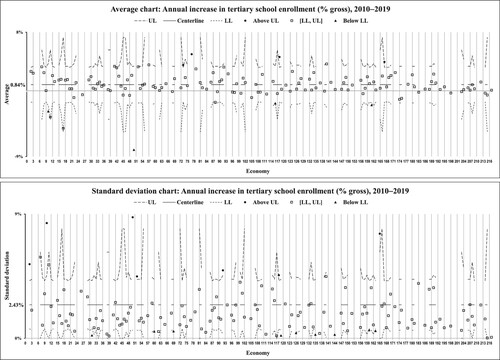
Figure 4. charts: The annual increase in the gross enrollment ratio of tertiary education, 2010–2019.
Based on –, summarises LDCs’ development progress (including the degree of growth and the variation in growth) in three indicators.
Table 3. Summary of –: Development progress of LDCs in three indicators, 2010–2019.
To compare the development progress of LDCs with non-LDC economies, and summarise the numbers and percentages of LDCs and non-LDC economies in three growth categories (i.e. high, normal, and low growth) and three variation categories (i.e. high, normal, and low variation) of three development indicators, respectively.
Table 4. Three growth categories of three development indicators (based on –), 2010–2019.
Table 5. Three variation categories of three development indicators (based on –), 2010–2019.
4.3. Findings
There are a number of findings on the development progress of LDCs in the context of world development over 2010–2019.
4.3.1. World Development
The broader context of world development is valuable for understanding the development progress of LDCs.
4.3.1.1. Per Capita Income
The chart in shows that all economies’ average of GNI per capita annual growth rates over 2010–2019 was 1.92%. For the economies with ten-year data, above 5.60% on average was exceptionally high growth in GNI per capita, while below ‒1.76% on average was exceptionally low performance of GNI per capita growth. Four economies achieved exceptionally high growth in GNI per capita: China (#42), Ethiopia (#65), Vietnam (#212), and Zimbabwe (#217). Seven economies had exceptionally low performances in GNI per capita growth: the Central African Republic (#38), Congo, Rep. (#46), Equatorial Guinea (#61), Lebanon (#111), Oman (#149), Sint Maarten (Dutch part) (#173), and Timor-Leste (#194).
The S chart in indicates that during 2010–2019, most economies had normal variations in their GNI per capita growth, while 11 economies experienced exceptionally high variations in GNI per capita growth and 14 economies had exceptionally low variations.
4.3.1.2. Life Expectancy
The chart in reveals that all economies’ average of the annual increases in life expectancy over 2010–2019 was 0.29 years; 26 economies had exceptionally high increases in life expectancy, while 14 economies had exceptionally low increases (or even decreases).
The S chart in shows that during 2010–2019, most economies had normal or low variations in the annual increases in life expectancy, while 17 economies experienced high variations.
4.3.1.3. Tertiary Education
The chart in indicates that all economies’ average of the annual increases in the gross enrollment ratio of tertiary education over 2010–2019 was 0.84%. Because the dataset has fewer than ten-year data for most economies, most upper and lower limits in this chart are not flat lines. Four economies had exceptionally high increases in the gross enrollment ratio of tertiary education: Georgia (#73), Greece (#77), Macao SAR, China (#118), and Saudi Arabia (#167). In contrast, four economies had exceptionally high decreases: Aruba (#10), Cuba (#50), Lithuania (#116), and Romania (#161).
The S chart in shows that most economies had normal variations in the annual increases in the gross enrollment ratio of tertiary education, while seven economies had high variations and nine economies had low variations.
4.3.2. Development Progress of LDCs
This article has three key findings on the exceptional development performances of 47 LDCs over 2010–2019. First, seventeen LDCs achieved exceptionally high increases in life expectancy. Second, six LDCs experienced highly unstable growth of GNI per capita. Lastly, one LDC achieved exceptionally high growth in GNI per capita; two LDCs had significant decreases in GNI per capita, which is a worrisome situation for any LDC that is already lagging behind most economies in development. These findings, as well as others, are elaborated as follows.
4.3.2.1. Degree of Growth
highlights the following findings on the growth performances of LDCs over 2010–2019:
GNI per capita. Most LDCs had normal growth of GNI per capita. Ethiopia (#65) was the only LDC that achieved exceptionally high growth; the Central African Republic (#38) and Timor-Leste (#194) had exceptionally low performances in GNI per capita growth.
Life expectancy. All LDCs (except for one with no data) had at least normal increases in life expectancy; especially, 17 LDCs achieved exceptionally high increases.
Tertiary education. All LDCs evaluated in this study had ordinary performances in increasing the gross enrollment ratio of tertiary education.
Exceptional overall development performance. Ethiopia (#65) was the only LDC that had exceptionally high growth in two development indicators (and had normal growth in the third).
4.3.2.2. Stability of Growth
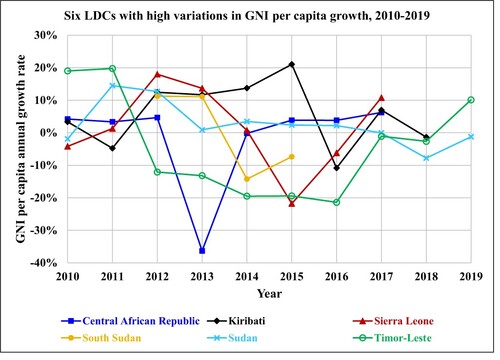
indicates that six LDCs had exceptionally high variations in GNI per capita growth: the Central African Republic (#38), Kiribati (#103), Sierra Leone (#171), South Sudan (#179), Sudan (#186), and Timor-Leste (#194). Based on the original data (World Bank Citation2021b), reveals that their GNI per capita annual growth rates varied drastically during 2010–2019.
Figure 5. Six LDCs with exceptionally high variations in GNI per capita growth, 2010–2019.
4.3.3. Comparison of LDCs with non-LDC Economies
A comparison of LDCs with non-LDC economies provides additional insights into the development progress of LDCs.
4.3.3.1. Degree of Growth
GNI per capita. shows that LDCs and non-LDC economies had similar percentages in both categories of high growth and low growth. This reveals that most LDCs were similar to most non-LDC economies in having normal degrees of growth in GNI per capita over 2010–2019.
Life expectancy. shows that a much higher percentage of LDCs (36.2%) than non-LDC economies (5.3%) achieved high increases in life expectancy; in addition, no LDCs had low performances in increasing life expectancy, compared to 8.2% of non-LDC economies that had low performances. This reveals that many LDCs had higher increases in life expectancy than most non-LDC economies over 2010–2019. This is an expected result, because most LDCs have lower life expectancy than most non-LDC economies and thus are more likely to experience larger increases in life expectancy in the process of development.
Tertiary education. also shows that no LDCs had high or low performances in increasing the gross enrollment ratio of tertiary education. This suggests that in comparison with non-LDC economies, LDCs generally had ordinary performances in increasing tertiary education enrollment. Although most LDCs had some increases in the gross enrollment ratio of tertiary education during 2010–2019 (see the chart in ), it is challenging for LDCs to significantly expand the scale of tertiary education.
4.3.3.2. Stability of Growth
shows that a higher percentage of LDCs (12.8%) than non-LDC economies (2.9%) had high variations in GNI per capita growth. This finding reveals that during 2010–2019, a higher percentage of LDCs than non-LDC economies had unstable performances of GNI per capita growth.
5. Discussion
This section discusses the usefulness of the findings on the development progress of LDCs, the features of the SPC method, and future research.
5.1. Development of LDCs
5.1.1. Development Progress
This article contributes in two aspects to a more accurate view on the development of LDCs.
The development progress of LDCs. To measure an LDC’s development progress, this article measures its degree of growth and stability of growth in three individual dimensions (i.e. per capita income, life expectancy, and education). Taken together, the development level reached in a certain year (measured by the HDI) and the development progress over a period of time (measured in this article) provide a more thorough view on the development of LDCs. For instance, although most LDCs were at the bottom of the HDI rankings based on the data of 2010 and 2019, this article reveals that 17 LDCs (36.2%) actually had exceptionally high degrees of growth in life expectancy and/or GNI per capita over the period of 2010–2019.
In the context of world development. The development of most economies (including LDCs) is affected by many global factors, such as climate change (Baarsch et al. Citation2020), conditions of the world economy (Yanagawa Citation1996), financial crises (Nikoloski Citation2011), global dollar supply (Hung and Liu Citation2022), global governance system (Cornia Citation2011), global value chains (Whitfield, Staritz, and Morris Citation2020), and UN development policies (Protopsaltis Citation2017). Therefore, this article measures the development progress of LDCs in the context of world development based on comparing the development performances of 217 economies (including LDCs), and uses the same assessment standards (i.e. the 3σ limits in
charts) to identify exceptional development performances for both LDCs and non-LDC economies. Furthermore, a comparison of LDCs with non-LDC economies provides additional insights into the development progress of LDCs over 2010–2019: In general, LDCs had higher increases in life expectancy, had similar degrees of growth in GNI per capita but had less stable growth, and had ordinary performances in increasing the gross enrollment ratio of tertiary education.
5.1.2. Evidence for the Effectiveness of Development Programmes
The findings on the development progress of LDCs over a period of time provide reliable evidence for evaluating the effectiveness of development programmes in LDCs during the given period. Here are three examples.
Ethiopia (#65) achieved exceptionally high growth in both GNI per capita over 2012–2019 and life expectancy over 2010–2019. These findings suggest that during 2010–2019, the policies and programmes of economic growth and human development in Ethiopia were generally effective. Existing studies pointed out a number of development policies, strategies, and programmes that might have contributed to Ethiopia’s exceptional development progress over 2010–2019: (1) making “economic transformation a key focus of [its] development agenda in the medium to long term”, and having “a Growth and Transformation Plan aimed at boosting agricultural and industrial growth” (UNCTAD Citation2014a, 5); (2) adopting “an active industrial policy” and an “Agriculture Development-Led Industrialization Strategy”, and designating “priority manufacturing industries, selected on the basis of resource availability, labour intensity, linkages to agriculture, export potential, and (relatively) low technological entry barriers” (UNCTAD Citation2016, 70); (3) implementing “mega-infrastructure projects, such as: (i) in energy, the Grand Ethiopian Renaissance Dam project; (ii) in transport (multi-modal transport linkages – rail, road, and upgrades to airports); (iii) housing, urban infrastructure projects; and (iv) industrial parks”, as well as “prioritizing economic diversification and human capital development” (UNCTAD Citation2021, 68); (4) improving “agricultural productivity” (UNCTAD Citation2013, 156); (5) providing “efficient air transport services”, and becoming “an international provider of air cargo services” (UNCTAD Citation2017, 42); (6) having a “microenterprise and small enterprise development policy and strategy” to tailor “support to enterprises according to their stage of development” (UNCTAD Citation2018, 101–102); (7) implementing “tax incentives for investment in high priority sectors, including leather and leather goods” (UNCTAD Citation2020, 112); (8) enhancing “[e]xchange rate stability”, and limiting “its international financial vulnerability by limiting its opening to capital inflows mainly to FDI and government borrowing on international bond markets, while also making use of outflow controls” (UNCTAD Citation2016, 171); (9) using “its national public development bank (the Development Bank of Ethiopia) to provide long-term credit (for example, to manufacturing and structural transformation)” (UNCTAD Citation2016, 169); (10) “attracting diaspora investment”, and introducing “diaspora bonds to complement domestic resource mobilization for financing major development projects” (UNCTAD Citation2012, 143); (11) establishing education as “a national priority” to boost “[p]rimary school enrolment” (UNDP Citation2010, 108) and “preprimary enrolment” (UNDP Citation2019, 227); (12) providing a “Productive Safety Net Program” to “protect millions of households from food insecurity while investing in community assets”, “better manage climatic risks and raise productivity”, “move from crisis response to prevention”, and allow “beneficiaries to strengthen resilience and improve food security and nutrition” (World Bank Citation2013, 23, 41, 104; Citation2023, 295); (13) implementing “a Promoting Basic Services Programme since 2012, to improve access to education, health, water and sanitation services by the poor and to improve its transport infrastructure to promote trade” (UNCTAD Citation2015a, 14); (14) narrowing “disparities between women and men in earnings and productivity” by “granting joint land titles to wives and husbands” (World Bank Citation2011, xxii); and so on.
For the Central African Republic (#38), its sharp V-shaped GNI per capita growth pattern during 2012–2014 (see ) may be related to “a 37 per cent contraction of output” and “the fall in FDI flows” in 2013 (UNCTAD Citation2014b, 4, 14), and then a large increase of 151.5% in “ODA disbursed (in real terms) from 2013 to 2014” (UNCTAD Citation2016, 10). These substantial changes in its output, FDI, and ODA inflows might have contributed to causing exceptional variations in its growth of GNI per capita during 2012–2014.
South Sudan (#179) experienced a reduction of “$130 million” in ODA inflows in 2013 (UNCTAD Citation2015b, 8); then it received “$1.6 billion” of ODA in 2014, which was an increase of 42.7% in “ODA disbursed (in real terms) from 2013 to 2014” (UNCTAD Citation2016, 10). Correlated with the times of these changes in ODA inflows, shows a decrease of more than 25% in South Sudan’s GNI per capita annual growth rate from 2013 to 2014, and then an upturn from 2014 to 2015. The considerable changes in ODA inflows might have contributed to causing exceptional variations in South Sudan’s growth of GNI per capita during 2013–2015.
5.1.3. Suggested Priorities for Future Development
Based on the findings on LDCs’ development progress over 2010–2019, this article suggests two priorities for future development.
| (1) | Improving the economic development of the low-growth LDCs. This article identifies the Central African Republic (#38) and Timor-Leste (#194) as the two LDCs that had exceptionally low performances in GNI per capita growth over 2010–2019 (and no LDCs had low growth in the other two indicators). Because LDCs are already lagging behind most non-LDC economies in development, any LDCs with exceptionally low performances of economic growth over any period of time will fall further behind. Curing the “failure of the growth process” in these LDCs is “the core challenge of development” (Collier Citation2008, 11). Therefore, development initiatives should place a strong emphasis on significantly improving the economic development of the low-growth LDCs. Many ideas for alleviating poverty and achieving sustainable economic growth have been discussed in the literature (Ang Citation2022; Collier Citation2008; Easterly Citation2007; Moyo Citation2010; Sachs Citation2006). It is important to point out that “[a]ctivating incremental changes across many connected domains simultaneously is more likely to stimulate systemic changes” in the development of an economy (Ang Citation2022, 241), as in the case of Ethiopia discussed above. | ||||
| (2) | Stabilising the development of LDCs to promote steady economic growth. This article finds that six LDCs had exceptionally high variations in the growth of GNI per capita during 2010–2019 (see ). Development initiatives should also aim to help these LDCs stabilise the process of development to achieve sustained economic growth. | ||||
The development of LDCs is affected by a number of factors to varying degrees (UNCTAD Citation2012, Citation2013, Citation2019): brain drain, characteristics of small island developing states, commodity price fluctuations, FDI, geographical location, ODA inflows, remittances, structure of exports, structure of output, and so on. Different LDCs may have different development needs and face different challenges. It is necessary to take account of the differences among LDCs and each LDC’s unique circumstances. Because “particular solutions work only when they fit the particular demands of their environments” in the continuously evolving process of development (Ang Citation2022, 223), it is of critical importance to formulate adaptive and probably different policies, strategies, and programmes for different LDCs to improve development and sustain growth.
5.2. Features of the SPC Method
5.2.1. Reliability of Analysis
The reliability of analysis in this article is attributable to three important features of charts used to evaluate the development performances of economies (including LDCs): objective, comparative, and robust.
| (1) | Objective. No absolute standards exist for determining what development performance is high (or low) or stable (or unstable). When no absolute assessment standards exist, | ||||
| (2) | Comparative. | ||||
| (3) | Robust. A number of studies of the effect of non-normality have justified that the use of the 3σ limits of statistical process control charts in detecting exceptional performance ensures reasonable robustness to the normality assumption (Montgomery Citation2020; Wheeler Citation2004). An advantage of using the 3σ limits to detect exceptional performance is to reduce both overreaction and underreaction (Woodall Citation2000). In this study, the 3σ limits of | ||||
5.2.2. Advantages of the SPC Method for Measuring Development Progress
The result obtained by using the SPC method to measure the development progress of economies (including LDCs) is a valuable supplement to the HDI values and rankings. In comparison with the HDI, the SPC method has several advantages.
| (1) | Measuring development progress. The HDI measures the level of development that an economy reached in a certain year. For example, the HDI values and rankings of 2019 were based on each economy’s one-year data in 2019 (UNDP Citation2020b). Similarly, the list of LDCs is regularly reviewed and updated based on the level of development that each country has reached (UNCTAD Citation2019, xii). In contrast, the SPC method measures each economy’s multiyear development progress over a period of time (e.g. 2010–2019). | ||||
| (2) | Measuring the degree of growth and the stability of growth. The degree of growth and the stability of growth are two different aspects of growth. For an economy’s multiyear development progress, high and unstable growth or low and stable growth is generally less desirable than high and stable growth. Hence, in order to properly measure each economy’s multiyear development progress, both the degree of growth and the stability of growth should be measured and, as demonstrated in this article, can be properly measured by the SPC method. | ||||
| (3) | Evaluating development performances in individual dimensions. Because an economy may have varying development performances in different dimensions (e.g. per capita income, life expectancy, and education), it is important to measure its development progress in individual dimensions so as to determine the priorities and strategies for future development. A prior study also justified that “a battery of disaggregated performance indicators” is desired for evaluating development performance (Adelman Citation1999). The SPC method is capable of measuring each economy’s development progress in individual dimensions and shedding light on its overall development performance across multiple dimensions (e.g. ). In contrast, although it is easy to use a composite index (e.g. the HDI) to rank economies, it is not easy to use a composite index to accurately analyse an economy’s development performance in each component dimension. | ||||
| (4) | Evaluating development performance objectively. In order to evaluate the development performances of economies objectively, subjectively determined values should not, if possible, be used in evaluation. However, the HDI requires the subjectively determined minimum and maximum values of each component indicator for calculating the HDI values of economies (UNDP Citation2020a); different choices of the minimum and maximum values may yield different HDI values and rankings. In contrast, the SPC method does not use any subjectively determined values or weights in performance evaluation; in addition, the upper and lower limits naturally divide an | ||||
| (5) | Offering more flexibility in evaluating development performance. The HDI calculates “the geometric mean of the three dimensional indices” based on one-year data (UNDP Citation2020a, 3). In contrast, the SPC method offers more flexibility in evaluating development performance. It can be used for different scopes of countries and economies (e.g. all countries and economies, low income countries, developing countries), different lengths of time (e.g. six months, ten years, 60 years), or different sets of one or more performance indicators (e.g. PM2.5 air pollution), as long as the interpretation of the evaluation result is pertinent to the specific scope, time, and indicators. | ||||
5.2.3. Potential Causes of Exceptional Development Performance
A vast amount of literature studied the impacts of various factors on the development of LDCs as well as other economies (besides the aforementioned global factors): commodity price fluctuations (Mekasha et al. Citation2022), conflict (Collier Citation2008), countries’ structural and institutional characteristics (Sindzingre Citation2005), education expenditures (Blankenau and Simpson Citation2004), FDI (Lall Citation2005), foreign aid (Khomba and Trew Citation2022), geography (Collier Citation2008), good governance (Kwon and Kim Citation2014) and bad governance (Collier Citation2008), higher education (Walker Citation2022), human capital (Tamura Citation2006), information and communication technologies (Jayaprakash and Radhakrishna Pillai Citation2022), infrastructure (Straub Citation2011), initial conditions (Chenery Citation1983), local elections (Sugiyama, Touchton, and Wampler Citation2023), natural disasters (Karim Citation2018), natural resources (Collier Citation2008), openness (Lee, Ricci, and Rigobon Citation2004), population growth (Faria, León-Ledesma, and Sachsida Citation2006), remittances (De Haas Citation2005), trade policy (Pickles et al. Citation2015), water and sanitation infrastructure (Günther and Fink Citation2013), etc.
According to the theory of statistical process control, for any process like an economy’s development process, regardless of how well it is designed or how carefully it is performed and maintained, a certain amount of inherent or natural variation always exists (Montgomery Citation2020). Such natural variation is the effect of many small, essentially unavoidable causes, which are called common causes. Based on the aforementioned factors, common causes in the development process may include natural, historical, domestic, and international factors. An important feature of common causes is that they are basically unavoidable in the development process, and that they are common to most economies and have normal impacts on the development of most economies. When only common causes exist in the development process, the points that represent the means or standard deviations of development performances usually fall inside the 3σ limits of charts in –, although different points may appear somewhat high or low within the 3σ limits.
In contrast, special causes are usually present when any point falls outside the 3σ limits. This is because the variation created by special causes is generally large, contributing to exceptional performance beyond the 3σ limits. For the development process, special causes are usually present when the means or standard deviations of some economies’ development performances are outside the 3σ limits; such special causes (or the special impacts of these causes) are not common to most economies, but particular to some economies only.
In comparison with common causes that are essentially unavoidable, a distinguishing feature of special causes is that if proper actions are taken, special causes can be prevented, alleviated, or removed from the process. For example, the ODA funds, if provided to some LDCs more consistently and effectively over time for them “not just to develop but to live decently” (Collier Citation2008, 179), may reduce the extent of variations in their per capita income growth.
5.3. Future Research
This article measures the development progress of LDCs over 2010–2019. To compare their development progress with their HDI rankings, this article measures their development progress in three dimensions (i.e. per capita income, life expectancy, and education) that are used by the HDI. This research work can be extended in two directions in the future.
| (1) | Developing a comprehensive framework of indicators for measuring development progress. The development of LDCs is an integral part of world development, and they are lagging behind most economies in development. Therefore, it is worthwhile to develop a more comprehensive framework of indicators for measuring LDCs’ development progress on three levels: (i) provision of basic needs, which refers to providing “the elemental aspects of human existence” (Macekura Citation2020, 95) and may be measured by indicators such as poverty headcount ratio, under-five mortality rate, and adult literacy rate (World Bank Citation2022b); (ii) overall development progress, which may be measured in the three dimensions (i.e. per capita income, life expectancy, and education) used by the HDI and this article; and (iii) environmental protection for sustainable development, which may be measured by some key environmental indicators addressing the pollution issues affecting development, such as CO2 emissions (related to climate change), PM2.5 air pollution (related to air quality), and water pollution (related to freshwater quality) (OECD Citation2008). | ||||
The dependence of the indicators in this framework on many other economic and social variables makes them a group of representative indicators for measuring the development progress of LDCs. Other indicators can also be added to this framework. The SPC method is capable of measuring development progress in individual dimensions no matter how many indicators are included in this framework.
| (2) | Investigating the special causes of exceptional development performance. The theory of statistical process control emphasises the importance of investigating the special causes of exceptional performance so that they can be addressed when making improvements. Therefore, after finding the exceptional development performances of LDCs in this study, another important future research work is to investigate the special causes behind the exceptional development performances of LDCs. Exceptional development performances may be related to different special causes that are specific to individual LDCs. For example, the Central African Republic, which is a landlocked country, and Timor-Leste, which is a small island developing state, probably had different special causes behind their exceptionally low and unstable performances of GNI per capita growth during 2010–2019. In addition, there can be multiple special causes behind an LDC’s exceptional development performance. For instance, as discussed above, a number of development policies, strategies, and programmes might have contributed to Ethiopia’s exceptional development progress over 2010–2019. | ||||
On the one hand, it is valuable to identify the special causes behind the exceptionally high development performances of LDCs (such as Ethiopia during 2010–2019) for them to sustain successful development. On the other hand, because the “real challenge of development is that there is a group of countries at the bottom that are falling behind, and often falling apart” (Collier Citation2008, 3), it is of significant importance to investigate the special causes behind the exceptionally low or unstable development performances of LDCs (such as those in ). Those LDCs are “in need of special attention from the international community in supporting their development strategies to address their development needs and specific challenges” (UNCTAD Citation2013, 11).
6. Conclusion
This article measured the ten-year development progress of LDCs in terms of the degree of growth and the stability of growth in three dimensions (i.e. per capita income, life expectancy, and education). It used a methodology based on the theory of statistical process control to objectively evaluate the development performances of 217 countries and economies (including 47 LDCs) and reliably identify the exceptional development performances of LDCs.
This article had three main findings on the development progress of LDCs in the context of world development over 2010–2019:
| (1) | Per capita income. One LDC (i.e. Ethiopia) achieved exceptionally high growth in GNI per capita; two LDCs (i.e. the Central African Republic and Timor-Leste) had exceptionally low performances in GNI per capita growth. In addition, six LDCs (i.e. the Central African Republic, Kiribati, Sierra Leone, South Sudan, Sudan, and Timor-Leste) experienced exceptionally high variations in GNI per capita growth. | ||||
| (2) | Life expectancy. All LDCs (except for one with no data) had at least normal increases in life expectancy. Especially, 17 LDCs (see ) achieved exceptionally high increases in life expectancy. | ||||
| (3) | Education. LDCs generally had ordinary performances in increasing the gross enrollment ratio of tertiary education. | ||||
Based on these findings, this article suggested two priorities for the future development of LDCs: One is to significantly improve the economic development of the low-growth LDCs; the other is to stabilise the development of LDCs, which experienced exceptionally high variations in GNI per capita growth, to promote sustained economic growth. For the LDCs that had exceptionally low and unstable performances of GNI per capita growth, improving and stabilising their economic development are both needed.
In the future, it will be worthwhile to regularly measure the development progress of LDCs. Regular measurement of the development progress of LDCs over a period of time will provide a valuable supplement to Human Development Reports and The Least Developed Countries Reports; will provide reliable evidence for identifying the exceptional development performances of LDCs as well as evaluating the effectiveness of development policies and programmes in LDCs; and will shed light on the future development priorities for LDCs in the dynamic and multifaceted process of development.
Disclosure Statement
No potential conflict of interest was reported by the author(s).
Additional information
Notes on contributors
Henry H. Bi
Henry H. Bi obtained his PhD in Management from the University of Arizona. He is currently a Professor in the Atkinson Graduate School of Management at Willamette University. His research interests include studying the progress of human development. His expertise includes using the statistical process control method to evaluate the quality and performance of socioeconomic development.
References
- Adelman, I. 1999. "Fallacies in Development Theory and their Implications For Policy." University of California, Berkeley, Department of Agricultural and Resource Economics, CUDARE Working Papers 25005. https://doi.org/10.22004/ag.econ.25005.
- Ang, Y. Y. 2022. How China Escaped the Poverty Trap. Ithaca, NY: Cornell University Press.
- Baarsch, F., J. R. Granadillos, W. Hare, M. Knaus, M. Krapp, M. Schaeffer, and H. Lotze-Campen. 2020. “The Impact of Climate Change on Incomes and Convergence in Africa.” World Development 126:104699. https://doi.org/10.1016/j.worlddev.2019.104699.
- Bi, H. H. 2015. “A Note on the Factor Values of Three Common Shewhart Variables Control Charts.” Communications in Statistics - Theory and Methods 44 (13): 2655–2673. https://doi.org/10.1080/03610926.2014.968732.
- Bi, H. H. 2017. “Multi-Criterion and Multi-Period Performance Benchmarking of Products and Services: Discovering Hidden Performance Gaps.” Benchmarking: An International Journal 24 (4): 934–972. https://doi.org/10.1108/BIJ-10-2015-0100.
- Bi, H. H. 2018a. “Benchmarking the International Compulsory Education Performance of 65 Countries and Economies: Findings from PISA 2006, 2009, and 2012.” Benchmarking: An International Journal 25 (1): 98–119. https://doi.org/10.1108/BIJ-09-2016-0144.
- Bi, H. H. 2018b. “A Robust Interpretation of Teaching Evaluation Ratings.” Assessment & Evaluation in Higher Education 43 (1): 79–93. https://doi.org/10.1080/02602938.2017.1295301.
- Bi, H. H. 2020. “A Robust Approach for Assessing Teaching Performance During Regular Reviews.” Studies in Higher Education 45 (11): 2217–2230. https://doi.org/10.1080/03075079.2019.1599850.
- Bi, H. H. 2022. “Applying Statistical Process Control to Teaching Quality Assurance at Higher Education Institutions.” Quality Management Journal 29 (2): 145–157. https://doi.org/10.1080/10686967.2022.2035288.
- Blankenau, W. F., and N. B. Simpson. 2004. “Public Education Expenditures and Growth.” Journal of Development Economics 73 (2): 583–605. https://doi.org/10.1016/j.jdeveco.2003.05.004.
- Chatterji, M. 1998. “Tertiary Education and Economic Growth.” Regional Studies 32 (4): 349–354. https://doi.org/10.1080/00343409850117807.
- Chen, Z., J.-N. Wang, G.-X. Ma, and Y.-S. Zhang. 2013. “China Tackles the Health Effects of Air Pollution.” The Lancet 382 (9909): 1959–1960. https://doi.org/10.1016/S0140-6736(13)62064-4.
- Chenery, H. B. 1983. “Interaction between Theory and Observation in Development.” World Development 11 (10): 853–861. https://doi.org/10.1016/0305-750X(83)90068-2.
- Collier, P. 2008. The Bottom Billion: Why the Poorest Countries Are Failing and What Can Be Done About It. New York, NY: Oxford University Press.
- Cornia, G. A. 2011. “Developing the Poorest Countries: New Ideas from the 2010 UNCTAD LDC Report.” The European Journal of Development Research 23 (1): 12–16. https://doi.org/10.1057/ejdr.2010.60.
- De Haas, H. 2005. “International Migration, Remittances and Development: Myths and Facts.” Third World Quarterly 26 (8): 1269–1284. https://doi.org/10.1080/01436590500336757.
- Easterly, W. 2007. The White Man's Burden: Why the West's Efforts to Aid the Rest Have Done So Much Ill and So Little Good. London: Penguin Books.
- Faria, J. R., M. A. León-Ledesma, and A. Sachsida. 2006. “Population and Income: Is There a Puzzle?” Journal of Development Studies 42 (6): 909–917. https://doi.org/10.1080/00220380600771745.
- Felice, E., J. P. Andreu, and C. D’Ippoliti. 2016. “GDP and Life Expectancy in Italy and Spain over the Long Run: A Time-Series Approach.” Demographic Research 35:813–866. https://doi.org/10.4054/DemRes.2016.35.28.
- Guichaoua, A. 2015. From War to Genocide: Criminal Politics in Rwanda, 1990–1994. Madison, WI: University of Wisconsin Press.
- Günther, I., and G. Fink. 2013. “Saving a Life-Year and Reaching MDG 4 with Investments in Water and Sanitation: A Cost-Effective Policy?” The European Journal of Development Research 25 (1): 129–153. https://doi.org/10.1057/ejdr.2012.24.
- Gyimah-Brempong, K., O. Paddison, and W. Mitiku. 2006. “Higher Education and Economic Growth in Africa.” Journal of Development Studies 42 (3): 509–529. https://doi.org/10.1080/00220380600576490.
- Hung, H.-F., and M. Liu. 2022. “The Dollar Cycle of International Development, 1973–2017.” Studies in Comparative International Development 57: 110–144. https://doi.org/10.1007/s12116-021-09346-5.
- Jayaprakash, P., and R. Radhakrishna Pillai. 2022. “The Role of ICT for Sustainable Development: A Cross-Country Analysis.” The European Journal of Development Research 34:225–247. https://doi.org/10.1057/s41287-021-00369-1.
- Karim, A. 2018. “The Household Response to Persistent Natural Disasters: Evidence from Bangladesh.” World Development 103:40–59. https://doi.org/10.1016/j.worlddev.2017.10.026.
- Khomba, D. C., and A. Trew. 2022. “Aid and Local Growth in Malawi.” Journal of Development Studies 58 (8): 1478–1500. https://doi.org/10.1080/00220388.2022.2032668.
- Kontis, V., J. E. Bennett, C. D. Mathers, G. Li, K. Foreman, and M. Ezzati. 2017. “Future Life Expectancy in 35 Industrialised Countries: Projections with a Bayesian Model Ensemble.” The Lancet 389 (10076): 1323–1335. https://doi.org/10.1016/S0140-6736(16)32381-9.
- Kwon, H.-J., and E. Kim. 2014. “Poverty Reduction and Good Governance: Examining the Rationale of the Millennium Development Goals.” Development and Change 45 (2): 353–375. https://doi.org/10.1111/dech.12084.
- Lall, S. 2005. “FDI, AGOA and Manufactured Exports by a Landlocked, Least Developed African Economy: Lesotho.” Journal of Development Studies 41 (6): 998–1022. https://doi.org/10.1080/00220380500155254.
- Lee, H. Y., L. A. Ricci, and R. Rigobon. 2004. “Once Again, Is Openness Good for Growth?” Journal of Development Economics 75 (2): 451–472. https://doi.org/10.1016/j.jdeveco.2004.06.006.
- Macekura, S. J. 2020. The Mismeasure of Progress: Economic Growth and Its Critics. Chicago, IL: University of Chicago Press.
- Maltz, E., H. H. Bi, and M. Bateman. 2018. “Benchmarking Sustainability Performance: The Next Step in Building Sustainable Business Models.” Journal of Public Affairs 18 (3): e1606. https://doi.org/10.1002/pa.1606.
- Mekasha, T. J., K. G. Molla, F. Tarp, and J. Aikaeli. 2022. “Commodity Price Fluctuations and Child Malnutrition.” World Development 158:105927. https://doi.org/10.1016/j.worlddev.2022.105927.
- Montgomery, D. C. 2020. Introduction to Statistical Quality Control. 8th ed. Hoboken, NJ: Wiley.
- Moyo, D. 2010. Dead Aid: Why Aid Is Not Working and How There Is a Better Way for Africa. New York, NY: Farrar, Straus and Giroux.
- Nikoloski, Z. 2011. “Impact of Financial Crises on Poverty in the Developing World: An Empirical Approach.” Journal of Development Studies 47 (11): 1757–1779. https://doi.org/10.1080/00220388.2011.561329.
- OECD. 2008. “OECD Key Environmental Indicators.” https://www.oecd.org/env/indicators-modelling-outlooks/37551205.pdf.
- Pickles, J., L. Plank, C. Staritz, and A. Glasmeier. 2015. “Trade Policy and Regionalisms in Global Clothing Production Networks.” Cambridge Journal of Regions, Economy and Society 8 (3): 381–402. https://doi.org/10.1093/cjres/rsv022.
- Protopsaltis, P. M. 2017. “Deciphering UN Development Policies: From the Modernisation Paradigm to the Human Development Approach?” Third World Quarterly 38 (8): 1733–1752. https://doi.org/10.1080/01436597.2017.1298436.
- Riley, J. C. 2001. Rising Life Expectancy: A Global History. New York, NY: Cambridge University Press.
- Sachs, J. D. 2006. The End of Poverty: Economic Possibilities for Our Time. London: Penguin Books.
- Shewhart, W. A. 1931. Economic Control of Quality of Manufactured Product. New York, NY: Van Nostrand.
- Sindzingre, A. 2005. “Reforms, Structure or Institutions? Assessing the Determinants of Growth in Low-Income Countries.” Third World Quarterly 26 (2): 281–305. https://doi.org/10.1080/0143659042000339128.
- Straub, S. 2011. “Infrastructure and Development: A Critical Appraisal of the Macro-Level Literature.” Journal of Development Studies 47 (5): 683–708. https://doi.org/10.1080/00220388.2010.509785.
- Sugiyama, N. B., M. Touchton, and B. Wampler. 2023. “Democratic Dead Spots: Local Elections and Human Development in Brazil.” Journal of Human Development and Capabilities 24 (2): 194–215. https://doi.org/10.1080/19452829.2022.2161490.
- Tamura, R. 2006. “Human Capital and Economic Development.” Journal of Development Economics 79 (1): 26–72. https://doi.org/10.1016/j.jdeveco.2004.12.003.
- UNCTAD. 2012. The Least Developed Countries Report 2012: Harnessing Remittances and Diaspora Knowledge to Build Productive Capacities.
- UNCTAD. 2013. The Least Developed Countries Report 2013: Growth with Employment for Inclusive and Sustainable Development.
- UNCTAD. 2014a. Economic Development in Africa Report 2014: Catalysing Investment for Transformative Growth in Africa.
- UNCTAD. 2014b. The Least Developed Countries Report 2014: Growth with Structural Transformation: A Post-2015 Development Agenda.
- UNCTAD. 2015a. Economic Development in Africa Report 2015: Unlocking the Potential of Africa's Services Trade for Growth and Development.
- UNCTAD. 2015b. The Least Developed Countries Report 2015: Transforming Rural Economies.
- UNCTAD. 2016. The Least Developed Countries Report 2016: The Path to Graduation and Beyond: Making the Most of the Process.
- UNCTAD. 2017. The Least Developed Countries Report 2017: Transformational Energy Access.
- UNCTAD. 2018. The Least Developed Countries Report 2018: Entrepreneurship for Structural Transformation: Beyond Business as Usual.
- UNCTAD. 2019. The Least Developed Countries Report 2019: The Present and Future of External Development Finance – Old Dependence, New Challenges.
- UNCTAD. 2020. The Least Developed Countries Report 2020: Productive Capacities for the New Decade.
- UNCTAD. 2021. The Least Developed Countries Report 2021: The Least Developed Countries in the Post-COVID World: Learning from 50 Years of Experience.
- UNDP. 2010. Human Development Report 2010: The Real Wealth of Nations: Pathways to Human Development.
- UNDP. 2019. Human Development Report 2019: Beyond Income, Beyond Averages, Beyond Today: Inequalities in Human Development in the 21st Century.
- UNDP. 2020a. Human Development Report 2020: Technical Notes: Calculating the Human Development Indices—Graphical Presentation.
- UNDP. 2020b. Human Development Report 2020: The Next Frontier: Human Development and the Anthropocene.
- Walker, M. 2022. “Sustainable Development Goals and Capability-Based Higher Education Outcomes.” Third World Quarterly 43 (5): 997–1015. https://doi.org/10.1080/01436597.2022.2039063.
- Wheeler, D. J. 2004. Advanced Topics in Statistical Process Control: The Power of Shewhart's Charts. 2nd ed. Knoxville, TN: SPC Press.
- Whitfield, L., C. Staritz, and M. Morris. 2020. “Global Value Chains, Industrial Policy and Economic Upgrading in Ethiopia's Apparel Sector.” Development and Change 51 (4): 1018–1043. https://doi.org/10.1111/dech.12590.
- Woodall, W. H. 2000. “Controversies and Contradictions in Statistical Process Control.” Journal of Quality Technology 32 (4): 341–350. https://doi.org/10.1080/00224065.2000.11980013.
- World Bank. 2011. World Development Report 2012: Gender Equality and Development.
- World Bank. 2013. World Development Report 2014: Risk and Opportunity: Managing Risk for Development.
- World Bank. 2021a. GNI Per Capita (Constant LCU) (Version March 19, 2021).
- World Bank. 2021b. GNI Per Capita Growth (annual %) (Version March 19, 2021).
- World Bank. 2021c. Life Expectancy at Birth, total (years) (Version May 25, 2021).
- World Bank. 2021d. School Enrollment, Tertiary (% gross) (Version March 19, 2021).
- World Bank. 2022a. “World Bank Country and Lending Groups (based on GNI per capita in 2021).” Accessed November 22, 2022. https://datahelpdesk.worldbank.org/knowledgebase/articles/906519-world-bank-country-and-lending-groups.
- World Bank. 2022b. “World Development Indicators (WDI).” Accessed August 7, 2022. https://datatopics.worldbank.org/world-development-indicators.
- World Bank. 2023. World Development Report 2023: Migrants, Refugees, and Societies.
- Yanagawa, N. 1996. “Economic Development in a World with Many Countries.” Journal of Development Economics 49 (2): 271–288. https://doi.org/10.1016/0304-3878(95)00062-3.
Appendix. Formulas of Average and Standard Deviation Charts ( Charts)
The theory of statistical process control has established the following formulas for constructing a pair of charts (Montgomery Citation2020):
(1)
(1)
(2)
(2) where:
(3)
(3)
(4)
(4)
(5)
(5)
For m samples, ni, , and si (1 ≤ i ≤ m) are the ith sample’s size, mean, and standard deviation, respectively. In this study, the arithmetic mean (average) is used for “the annual increases in life expectancy” and “the annual increases in the gross enrollment ratio of tertiary education”; the geometric mean is used for “the annual growth rates of GNI per capita”. In Formulas (1) and (2), the number “3” represents the three-sigma limits; the statistic
is an unbiased estimator of the process standard deviation σ, which is usually unknown. In Formula (3),
is the weighted average of sample means and is used to estimate the process mean μ when it is unknown. In Formula (4),
is the weighted average of sample standard deviations. In Formula (5), c4 is a constant and varies with the sample size ni and, accordingly, the three-sigma limits of
and S charts vary across samples with different sample sizes;
is the gamma function. A prior work provides tabular values (with precision of 10 decimal places) of c4 for samples of size 2 through 100 (Bi Citation2015).