
 ?Mathematical formulae have been encoded as MathML and are displayed in this HTML version using MathJax in order to improve their display. Uncheck the box to turn MathJax off. This feature requires Javascript. Click on a formula to zoom.
ABSTRACT
Building facade structures serve as important data support for three-dimensional (3D) building modelling. A building facade structure extraction method based on 3D Laser Point Cloud Data (LPCD) by considering semantic information is proposed. The proposed method mainly involves three steps. First, an improved 3D LPCD semantic segmentation method is introduced to extract and label point clouds as the building structure and walls. Second, structure line segments are recognized from the initial building facade structure based on the Regulated Block RANSAC (RB-RANSAC) algorithm. Third, geometric information such as distance, vector and positional relationship between structure line segments is considered to optimize the initial building facade structure. The proposed method can effectively extract and fit segment structures by considering the semantic and geometric information, obtaining significantly accurate and concise building facade structures. Case studies on 3D LPCD of local buildings and open-source datasets (Semantic3D) prove the extraction accuracy and efficiency of the proposed method.
1. Introduction
Facade structure information refers to segmentations of building outside surfaces, such as boundaries of outside windows, outside doors and other edges of significant elements of outside building walls. These segmentations can express the building framework, which is significant for refined three-dimensional (3D) building modelling, building damage monitoring, building reconstruction and renovation (Badwi, Ellaithy, and Youssef Citation2022; Barbosa, Rosse, and Laurindo Citation2021; K. Chen et al. Citation2021; Hamid-Lakzaeian Citation2019; Hao, Wang, and Liang Citation2018; H. Hu et al. Citation2022; Liu, Li, and Zhu Citation2022). Moreover, important information, such as the 3D coordinates and reflectance of the measured building, is recorded in the 3D laser point cloud data (LPCD) (D. Hu, Gan, and Yin Citation2023; Mirzaei et al. Citation2023). Hence, important data and information support are provided for extracting building facade structure information (Hamid-Lakzaeian Citation2020; Shahzad and Zhu Citation2015; Wang et al. Citation2018, Citation2022). Therefore, extracting accurate building facade structures based on 3D LPCD is currently a research priority for refined 3D building modelling (Pérez et al. Citation2021; Tian et al. Citation2022; Zolanvari, Laefer, and Natanzi Citation2018).
Facade structure extraction methods mainly include point cloud projection-based, two-dimensional (2D) image-auxiliary-based and point cloud properties-based methods. In the point cloud projection-based method, 3D LPCD is converted into intensity images, and 2D structure line segments are extracted using 2D image extraction methods. On the basis of the conversion matrix, 2D data are restored into the 3D building structure information to accomplish the 3D building facade structure extraction (Fotsing et al. Citation2022; Gao and Shen Citation2021). However, data loss and mapping errors often occur when 3D LPCD is converted into intensity images, thereby causing serious errors.
In the 2D image-auxiliary-based method, 2D images that match the building 3D LPCD are used as auxiliary data. The ordered pixel information of the 2D images is used to provide index and texture for the unorganized 3D LPCD. Thereafter, markedly comprehensive building facade structures are extracted (S. Chen et al. Citation2020; Huang et al. Citation2019; Wang et al. Citation2023). However, owing to the influence of registration accuracy and image resolution, additional errors inevitably occur in matching 3D LPCD with pixels. Image distortion and texture complexity also reduce extraction accuracy.
In the point cloud properties-based method, physical properties of 3D LPCD, such as coordinates and reflection intensity, are used to calculate the curvature, normal vector and gradient of the point cloud (Dong et al. Citation2022; Poux et al. Citation2022). On the basis of the calculated properties, features or contour points are extracted from 3D LPCD as building facade structure (Khaloo and Lattanzi Citation2017). Moreover, rule base facade segmentation, such as the RANSAC algorithm, also utilizes similar characteristics (Boulaassal et al.). The properties-based method can flexibly and accurately extract building facade structure owing to its good plasticity. However, feature points are closely related to the spatial characteristics of 3D LPCD, thereby making the method not robust for 3D LPCD with noise and heterogeneous density.
Category properties marked in the semantic information of 3D LPCD are different from the information at the physical dimension, which is compensated for the lack of application in the deep meaning of the point cloud. Semantic information, which is a type of point cloud property, can be substantially integrated into the point cloud properties-based method called semantic segmentation method (Hamid-Lakzaeian Citation2020; Weinmann et al. Citation2015). The semantic method uses machine learning classification and modelling applications, such as the support vector machine k-nearest neighbours, and random forest, to realize the extraction of building structures (Dey et al. Citation2023; Gharineiat, Tarsha Kurdi, and Campbell Citation2022). For example, CAractérisation de NUages de POints (CANUPO) is a semantic segmentation method, which can realize the binary classification for simple environments (Brodu and Lague Citation2012). However, the current rules for semantic segmentation of building facades are not comprehensive, and the extraction of complex structures in buildings is prone to deletions, thereby reducing the extraction accuracy of semantic segmentation methods. Therefore, optimizing the semantic segmentation rule and improving the fitted model of the segment structure are keys to improving extraction results from building facade structures.
A building facade structure extraction method based on 3D LPCD by considering semantic information is proposed in this paper. The proposed method mainly involves three contributions. First, the improved CANUPO method based on the angular feature is introduced to separate the wall from the building 3D LPCD. Second, structure line segments are recognized by the RB-RANSAC method from point clouds labelled as the building structure. Third, the optimization method of the structure line for optimizing the initial extraction result is proposed. On the basis of the proposed method, an accurate building facade structure can be extracted for refined modelling. The remainder of this paper is organized as follows. Section 2 introduces the basic idea and details of the proposed method. Section 4 conducts an extraction case study using three groups of 3D LPCD (i.e. the Administration Building, the side of Civil and Surveying & Mapping Engineering College Building (CSMECB) and Partial building 3D LPCD of open-source datasets (Semantic3D)). Section 5 discusses the effectiveness, optimal training sets and potential limitations of the proposed method. Lastly, Section 5 presents the conclusion of the proposed method.
2. Methodology
Separating the wall from the building structures is key to the building 3D LPCD semantic segmentation. The semantic segmentation method CANUPO (Brodu and Lague Citation2012) is introduced to obtain the point cloud with the building structure semantic label, which is improved based on the angular feature to separate the wall accurately. Thereafter, the Regulated Block RANSAC (RB-RANSAC) algorithm is proposed to recognize the line and curve segments as the initial building facade structure based on semantic information (Fischler and Bolles Citation1987). In addition, a structure line optimization method based on geometric information is proposed to improve the recognizing result of the initial facade structure, and significantly accurate and concise building facade structures are obtained. Therefore, optimizing the rules of semantic segmentation and the recognizing model of structure lines are expected to improve the accuracy of building facade extraction.
2.1. Overall design
The proposed method mainly involves three steps (). First, semantic segmentation for building facade 3D LPCD is carried out. Point clouds with the building structure semantic label are obtained using the improved CANUPO method based on the angular feature. Second, initial facade structures are extracted on the basis of semantic information. A line segment recognizing model-based RB-RANSAC method is established to extract initial facade structures using semantic labels. Third, facade structures are optimized based on geometric information. A structure line optimization method is proposed to make the structural lines concise and accurate using geometric information.
Figure 1. Flow chart of the proposed method.

2.2. Semantic segmentation for building 3D LPCD
To optimize the semantic segmentation rule, an improved angular-feature-based CANUPO method is proposed. In the original CANUPO method, the scale is defined as the diameter of a ball centred on a point of interest. Local dimensionality properties refer to the eigenvalues obtained by applying the Principal Component Analysis algorithm to the point cloud within a scale sphere, as shown in . The combination of eigenvalues at various scales is utilized to fit a hyperplane using the Discriminant Analysis algorithm, aiming to differentiate between two categories based on multi-scale dimensional features. However, building facade structures exhibit a distinct spatial feature marked by conciseness, fineness and condensity that set them apart from the vast natural landscapes commonly used in CANUPO. Directly employing the original CANUPO method yields redundant point clouds that do not correspond to actual building facade structures, leading to inaccurate semantic segmentation results. Therefore, the main idea of the improved CANUPO method involves integrating angular features of point clouds after calculating local dimensionality attributes to enable accurate classification of both building facade structures and redundant points. Noticeable differences exist in terms of angles (e.g. θ and θ́) between facade structures and redundant points, as shown in . Obtain other points in the range of a ball shape of interest, and use the least-squares method to fit the surface equation. Solving the normal vector of the surface projects the point set to the tangent plane of the normal vector. After projection onto the tangent plane, the difference vectors are generated. The projected points are sorted according to their angle around the points of interest. The largest angular gap between two consecutive points is used to compute the redundant points probability (Bendels, Schnabel, and Klein Citation2006).
Figure 2. The key to original and improving the CANUPO method (a) local dimensionality properties and (b) angular features.
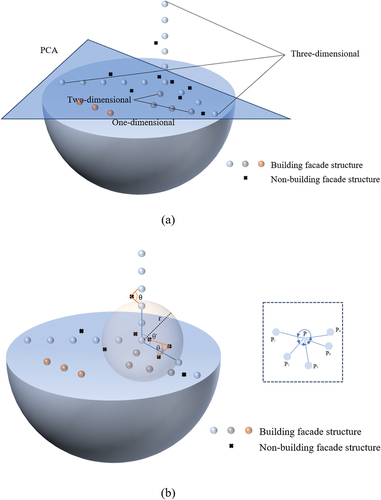
The improved CANUPO method mainly involves two steps. First, the local dimensionality properties of the scene at each point and at different scales are calculated to define the best combination of scales. Second, consider the angular features of point clouds to eliminate redundant points, as shown in . Neighbourhood radius r and angle threshold θ are important parameters in the algorithm. The extraction of structure details is influenced by neighbourhood radius r, which determines the point neighbourhood range. The points belonging to the building facade structure are determined by the angle threshold, which is the threshold value of the angle between each point.
Figure 3. The flow chart of building facade semantic segmentation based on improved CANUPO method.
2.3. Initial facade structure extraction based on semantic information
RB-RANSAC method is introduced to extract accomplished and accurate building facade structures using semantic labels. The main idea of the RB-RANSAC method is to segment the point cloud of the building facade structure into regulated blocks to speed up the recognizing process (). Thereafter, the line segment recognizing model is established to extract the initial facade structure from blocks.
Figure 4. Blocks of 3D LPCD.
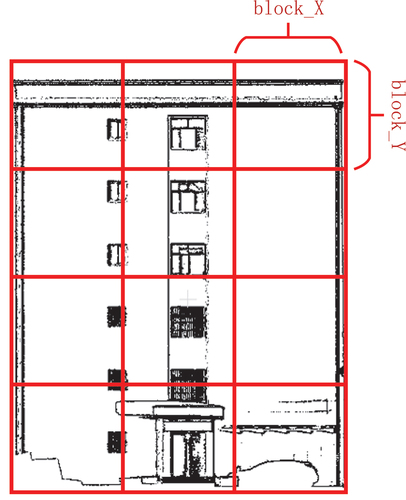
Segmentation mainly involves of six steps, as shown in .
Confirm the main plane of the building (the facade with the most points) and rotate the main plane to be parallel to the XOY plane.
Given the approximate block size appro_block, the empirical value of 10 m *10 m is used in this study.
The maximum and minimum values x _ max, x _ min, y _ max and y _ min in the x and y directions of the input point cloud are calculated. Then, the coordinate ranges X _ Range and Y _ Range in the x and y directions are calculated.
Calculate the number of blocks in both directions and the actual block size based on the approximate block size.
Calculate the coordinate range of each block, record the points contained in each block.
When the number of points in a block is 10 or less, the block will not be output. This filters out blocks with 0 points and outliers resulting in too few points.
Figure 5. The flow chart of point cloud segmenting.
The RB-RANSAC method mainly involves three steps. First, the main plane of 3D LPCD is confirmed and divided into rectangular areas of regulated size. Second, line and curve segment structures in each rectangular area are recognized based on the building structure semantic label. Third, the point cloud is projected onto the recognizing line segment according to the Formula 1. The initial building facade structure is obtained after the RB-RANSAC method regularized building 3D LPCD, as shown in .
Figure 6. RB-RANSAC line recognizing and regularized.
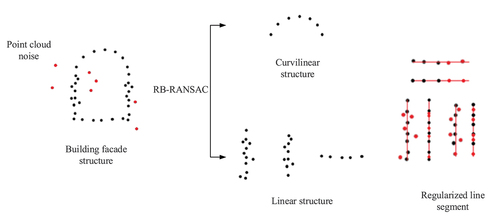
where is the assumed vector,
and
are the projection and projected points, respectively,
is the line segment normal vector and
is a point on the line.
The automatic termination condition of the RANSAC algorithm relies on the point cloud number. However, the constraint based on the number of point clouds is ineffective for the stacked point cloud, thereby resulting in the structure lines becoming considerably shorter. Therefore, length constraints are added to eliminate structure lines, the length of which is less than the length threshold. The length threshold is an empirical value that equals one 1/200 of the longest recognized line segment.
2.4. Facade structure optimization based on geometric information
On the basis of geometric information, a structure line optimization method is proposed to eliminate and optimize stacked line segments in the initial building facade structure. The main idea of the structure line optimization method is to eliminate the stacked line segments first based on the position and segment number between structure line segments. The main structure of the building is mostly approximately rectangular blocks. Therefore, the main structural line segments are composed of rectangular structures (Steadman Citation2006). Through statistical analysis of the direction vectors of the structural lines, the line segments parallel to each other are grouped in turn, and the direction vectors in the largest number of groups and their corresponding vertical vectors are defined as the main direction of the building facade. The structural lines aligned in these directions are called the main structural line segments. The remaining groups are defined as substructure segments, and segments that are not parallel to them are defined as redundant segments.
The structure line optimization method mainly involves three steps, as shown in . First, the distance and positional relationship between line segments are calculated based on the normal vector of the structure line segments. Second, identify the main structural lines of a building by traversing the directional vectors of structural lines. Third, line segments parallel to each other and spaced less than the distance threshold are defined as adjacent line segments. The distance threshold is defined as an empirical value of 0.01 m. If there is a main structure segment in the adjacent line segment set, the longest main structure segment in the set is retained, and the other line segments are projected horizontally based on the linear equation of main structure line segment, as shown in . If there is no main structure line segment in the adjacent line segment set, it will be output directly. Structural line segments without parallel line segments are considered to be incorrect extraction results and will be deleted.
Figure 7. The flow chart of structure line optimization method.
Figure 8. Main structure optimization (a) structure lines before optimizing (b) structure lines after optimizing.
2.5. Evaluation metrics
Facade segmentation and extraction are binary classifications in this research; the samples are divided into positive and negative samples, denoted as 1 and 0, respectively. The true and predicted values of the two samples can be combined into four states in pairs, and a confusion matrix is defined accordingly, as shown in .
Table 1. Confusion matrix for binary classification evaluation.
Five metrics, namely, Precision, Recall, Intersection over union (IoU), Regarding alignment and length (RAL) and average density-to-points multiplication (ADPM), are used to evaluate the semantic segmentation and facade extraction results.
Precision is the ratio of correctly classified positive samples and true (false) positive samples, which is a statistical evaluation of facade extraction (Formula (2)).
(2)
Recall is the ratio of correctly classified positive (negative) samples and true positive (negative) samples, which is a statistical analysis of the classification effect (Formula (3)).
IoU is the ratio of the intersection to the union for the true value and candidate regions, which is the main evaluation metric for the overall segmentation effect (Formula (4)).
RAL is the ratio of correctly classified line segment length and true line segment length, which is a statistical analysis of the integrity of the extracted straight lines (Formula (5)) (Wang et al. Citation2023).
WhereADPM is the multiplication between the average distance density of point clouds and the number of building 3D LPCD (Formula (6)).
Where N is the number of building 3D LPCD, is the average distance density of point clouds and K is the number of randomly sampled point clouds. Moreover,
and N jointly determine the quality of the final result. The more extensive the semantic segmentation result (N↑) and extraction structure (
↑), the higher the segmentation result of ADPM.
3. Case study
This section describes the dataset used in the experiments, showing the extraction results and compared with other extraction methods. The three-dimensional laser scanner utilized in this study was the VZ-1000, which was developed by Riegl, Austria. All experiments are conducted using NVIDIA GeForce GTX 1650Ti and an AMD Ryzen 7 4800 H CPU.
3.1. Dataset
Three groups of 3D LPCD are used as training data, as shown in . The training data is manually annotated as outside walls and windows using CloudCompare, as shown in with blue and red areas. All groups are collected by the RIEGL VZ-1000 3D laser scanner in different research areas. Group 1 data are collected by setting up scanners on the south direction of CSMECB. Group 2 data are collected by setting up scanners on the south direction of the Teaching Building. Group 3 data are collected by setting up scanners on the south direction of inpatient in Affiliated Hospital.
Table 2. Training data.
The other three groups of 3D LPCD are used as test data, as shown in . Groups 4 and 5 are collected by the RIEGL VZ-1000 3D laser scanner. Group 4 data are collected by setting up scanners on the south side of the Administration Building, which is about 120 m in length and 30 m in height. The Administration Building contains mostly regular line segment facade structures, such as rectangular doors, windows, cylindrical pillars and awnings. Group 5 data are collected by setting up a scanner on the west direction of CSMECB. CSMECB is the smallest building among the three groups of test data, containing only the line segment structures. Group 6 data from the open-source dataset called Semantic 3D is a small building with multiple complex structures of line and curve segments (Hackel et al. Citation2017). Details of the test data are shown in .
Table 3. Test data.
Table 4. Experimental data details.
3.2. Results and analysis
Facade structures of the three test data groups are extracted using the proposed method, and the extraction results are shown in . Seven representative rectangular areas, numbered 1, 2, 3, 4, 5, 6 and 7 (from left to right), are selected from the three test data. The Precision, Recall, RAL and average values in the seven areas are shown in . For Administrative Building, the average Precision is 0.92, average Recall is 0.96 and average RAL is 0.91. For Stgallen3, average Precision is 0.90, average Recall is 0.90 and average RAL is 0.94. For the CSMECB side data, average Precision is 0.90, average Recall is 0.94 and average RAL is 0.96. According to the extraction and evaluation results, the outside facade structures, such as outside windows, pillars, stairs and building footprint, are well extracted using the proposed method.
Figure 9. Facade structure extraction results: (a) administrative building, (b) Stgallen3 and (c) side of the CSMECB.
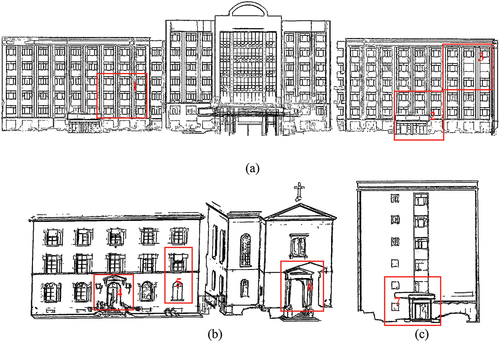
Table 5. Evaluation metrics of extraction results.
3.3. Evaluation and validation
For the evaluation of the Precision, Recall and RAL of the proposed method, the facade structures of the test data are extracted using the Lu method (Lu, Liu, and Li Citation2019) and Wang method (Wang et al. Citation2018). The CSMECB side is used as test data to compare the three methods and perform quantitative analysis, as shown in and , respectively. Accordingly, the proposed method can effectively extract building facade structures with high RAL and is rarely wrong. Extraction results of the Wang method in the windows structure lines are poor, many window structure lines are not extracted and several non-structure lines are extracted owing to the influence of texture information. Extraction results of the Lu method are scattered, and non-structure line segments are extracted, such as the inner frame of windows and doors. Precision of the proposed method is 0.90, followed by the Wang method, and the Lu method is the worst (0.59). Recall of the proposed method is 0.94, followed by the Lu method, and the Wang method is the worst (only 0.56). RAL of the proposed method is 0.96, followed by the Lu method, and the Wang method is the worst (only 0.51).
Figure 10. Partial extraction results of building facade by different methods (the red lines represent the extracted structural lines): (a) Wang method, (b) Lu method and (c) proposed method.
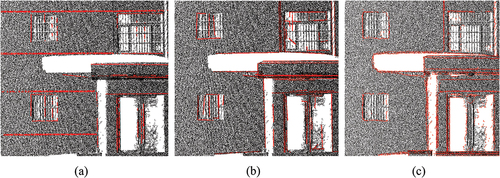
Table 6. Evaluation metrics of local extraction results.
To ensure the objectivity of evaluation and validation, the open-source data Stgallen3 are used as test data, as shown in . The proposed method can achieve superior extraction in complex curve structures, as shown in red area. The blue area shows that numerous building structures are extracted by the proposed method. Furthermore, the proposed method avoids texture interference, such as the extracting structures in the green area.
Figure 11. Extraction result of Stgallen3: (a) Lu method and (b) proposed method.
4. Discussion
To further analyse the effectiveness of the experiment, this study discusses three aspects. The effect of the improved CANUPO method and RB-RANSAC method, the effect of the optimal train sets on CANUPO, and the potential limitations.
4.1. Effect of the improved CANUPO method and RB-RANSAC method
To demonstrate the effect of the improved CANUPO method and RB-RANSAC method, a comparative experiment is conducted and discussed, as shown in and . The improved CANUPO performs better than the original CANUPO, as shown in . The redundant portions of the building facade point cloud are essentially removed, and precise and concise classification results are obtained.
Figure 12. Comparison between the original and improved CANUPO method: (a) classification results of the original CANUPO and (b) classification results of the improved CANUPO.
Table 7. Extraction results by the improved RB-RANSAC and original RANSAC.
The improved RB-RANSAC performs better than the original RANSAC, as shown in . The overall results are similar, and the time-consuming is 28.937 s and 130.672 s for the improved RB-RANSAC and the original RANSACA, respectively. The recognizing efficiency of the improved RB-RANSAC method is significantly better than that of the original RANSAC method. In addition, the recognizing results of the improved RB-RANSAC method are more regular as shown in the red area.
4.2. Effect of the optimal train sets on CANUPO
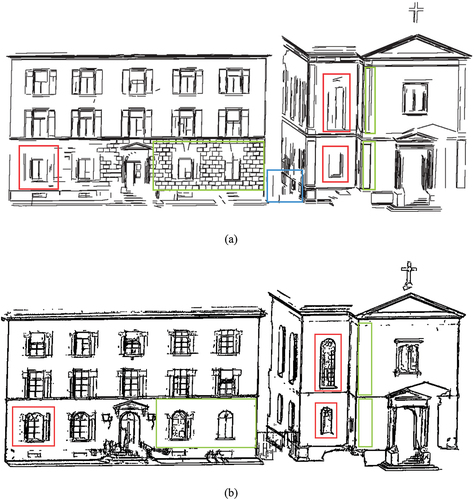
To demonstrate the proposed method on the optimal training set problem, three sets of representative building structures are cut out from the data of the Teaching Building and Inpatient as training data, as shown in . In the semantic classification results of the three sets of training sets, the window–wall set can obtain a complete facade structure, as shown in . The point cloud density and numbers of outside windows–wall set classification results are better than those of other sets, as shown in . Moreover, ADPM of the segmentation result with the window–wall training set is 3502.60, which is nearly three times higher than the 1285.51 and 1832.09 of the pillars–wall and staircase–wall, respectively. Therefore, window–wall is the optimal training set.
Figure 13. Training set (outside wall, windows, stairs and pillars).
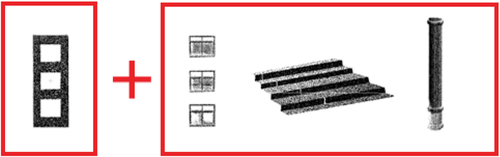
Figure 14. Semantic segmentation results (windows-wall, pillars-wall and stairs-wall).
Table 8. Semantic segmentation evaluation of classifiers with different train sets.
4.3. Potential limitations
Some limitations exist even though the proposed method can accomplish the facade structure extraction of 3D building LPCD. The precision of building facade extraction is compromised due to erroneous extractions caused by noise and holes present within the point cloud. Therefore, a considerably efficient and robust point cloud pretreatment method should be studied.
5. Conclusion
A building facade structure extraction method based on 3D LPCD by considering semantic information is proposed in this paper to accomplish highly accurate building facade structure extraction. The proposed method mainly involves three contributions. First, the improved CANUPO method based on the angular feature is introduced to separate the wall from the building 3D LPCD. Second, structure line segments are recognized by the RB-RANSAC method from point clouds labelled as the building structure. Third, the optimization method of the structure line for optimizing the initial extraction result is proposed. On the basis of the proposed method, an accurate building facade structure can be extracted for refined modelling.
To verify the accuracy and effectiveness of the proposed method, an extraction case study is conducted by using three groups of test data. The proposed method is proven to be more accurate and efficient than the other two methods. However, building facade extraction precision is compromised by noisy and incomplete point clouds. Therefore, a markedly efficient and robust point cloud pretreatment method is needed.
Author contributions
Conceptualization, Xiaoyu Hu and Yongzhi Wang; data curation, Xiaoyu Hu, Yongzhi Wang, and Tao Zhou; formal analysis, Xiaoyu Hu and Yongzhi Wang; funding acquisition, Yongzhi Wang; methodology, Xiaoyu Hu and Yongzhi Wang; project administration, Xiaoyu Hu and Yongzhi Wang; software, Xiaoyu Hu and Tao Zhou; validation, Xiaoyu Hu and Tao Zhou; visualization, Xiaoyu Hu and Tao Zhou; writing – original draft, Xiaoyu Hu, Yongzhi Wang, and Tao Zhou; writing – review and editing, Xiaoyu Hu, Deborah Simon Mwakapes and Yongzhi.
Consent
All authors have read and agreed to the published version of the manuscript.
Ethical approval statement
Ethical approval is not applicable for this article.
Acknowledgements
The authors would also like to acknowledge the contributions of Jacqueline Wah to the spelling and grammar check for this paper.
Disclosure statement
No potential conflict of interest was reported by the author(s).
Data availability statement
The data and codes that support the findings of this study are available from the corresponding author upon reasonable request.
Additional information
Funding
References
- Badwi, I. M., H. M. Ellaithy, and H. E. Youssef. 2022. “3D-GIS Parametric Modelling for Virtual Urban Simulation Using CityEngine.” Annals of GIS 28 (3): 325–341. https://doi.org/10.1080/19475683.2022.2037019.
- Barbosa, M. T. G., V. J. Rosse, and N. G. Laurindo. 2021. “Thermography Evaluation Strategy Proposal Due Moisture Damage on Building Facades.” Journal of Building Engineering 43:102555. https://doi.org/10.1016/j.jobe.2021.102555.
- Bendels, G. H., R. Schnabel, and R. Klein 2006. “Detecting Holes in Point Set Surfaces [Internet]. [Place Unknown]: Václav Skala - UNION Agency.” Accessed July 3, 2022. http://dspace5.zcu.cz/handle/11025/1350
- Brodu, N., and D. Lague. 2012. “3D Terrestrial Lidar Data Classification of Complex Natural Scenes Using a Multi-Scale Dimensionality Criterion: Applications in Geomorphology.” ISPRS Journal of Photogrammetry and Remote Sensing 68:121–134. https://doi.org/10.1016/j.isprsjprs.2012.01.006.
- Chen, K., G. Reichard, X. Xu, and A. Akanmu. 2021. “Automated Crack Segmentation in Close-Range Building façade Inspection Images Using Deep Learning Techniques.” Journal of Building Engineering 43:102913. https://doi.org/10.1016/j.jobe.2021.102913.
- Chen, S., W. Shi, M. Zhou, M. Zhang, and P. Chen. 2020. “Automatic Building Extraction via Adaptive Iterative Segmentation with LiDAR Data and High Spatial Resolution Imagery Fusion.” IEEE Journal of Selected Topics in Applied Earth Observations & Remote Sensing 13:2081–2095. https://doi.org/10.1109/JSTARS.2020.2992298.
- Dey, E. K., M. Awrangjeb, F. Tarsha Kurdi, and B. Stantic. 2023. “Machine Learning-Based Segmentation of Aerial LiDAR Point Cloud Data on Building Roof.” European Journal of Remote Sensing 56 (1): 2210745. https://doi.org/10.1080/22797254.2023.2210745.
- Dong, X., Y. Xiao, Z. Chen, J. Yao, and X. Guo. 2022. “GPU-Based Supervoxel Segmentation for 3D Point Clouds.” Computer Aided Geometric Design 93:102080. https://doi.org/10.1016/j.cagd.2022.102080.
- Fischler, M. A., and R. C. Bolles. 1987. “Random Sample Consensus: A Paradigm for Model Fitting with Applications to Image Analysis and Automated Cartography.” Readings in Computer Vision 726–740. https://doi.org/10.1016/B978-0-08-051581-6.50070-2.
- Fotsing, C., P. Hahn, D. Cunningham, and C. Bobda. 2022. “Volumetric Wall Detection in Unorganized Indoor Point Clouds Using Continuous Segments in 2D Grids.” Automation in Construction 141:104462. https://doi.org/10.1016/j.autcon.2022.104462.
- Gao, Q., and X. Shen. 2021. “ThickSeg: Efficient Semantic Segmentation of Large-Scale 3D Point Clouds Using Multi-Layer Projection.” Image and Vision Computing 108:104161. https://doi.org/10.1016/j.imavis.2021.104161.
- Gharineiat, Z., F. Tarsha Kurdi, and G. Campbell. 2022. “Review of Automatic Processing of Topography and Surface Feature Identification LiDAR Data Using Machine Learning Techniques.” Remote Sensing 14 (19): 4685. https://doi.org/10.3390/rs14194685.
- Hackel, T., N. Savinov, L. Ladicky, J. Wegner, K. Schindler, and M. Pollefeys. 2017. “Semantic3D.Net: A New Large-Scale Point Cloud Classification Benchmark.” ISPRS Annals of Photogrammetry, Remote Sensing & Spatial Information Sciences IV-1/W1:IV–1/W1. https://doi.org/10.5194/isprs-annals-IV-1-W1-91-2017.
- Hamid-Lakzaeian, F. 2019. “Structural-Based Point Cloud Segmentation of Highly Ornate Building façades for Computational Modelling.” Automation in Construction 108:102892–102892. https://doi.org/10.1016/J.AUTCON.2019.102892.
- Hamid-Lakzaeian, F. 2020. “Point Cloud Segmentation and Classification of Structural Elements in Multi-Planar Masonry Building Facades.” Automation in Construction 118:103232–103232. https://doi.org/10.1016/J.AUTCON.2020.103232.
- Hao, W., Y. Wang, and W. Liang. 2018. “Slice-Based Building Facade Reconstruction from 3D Point Clouds.” International Journal of Remote Sensing 39 (20): 6587–6606. https://doi.org/10.1080/01431161.2018.1463113.
- Huang, J., X. Zhang, Q. Xin, Y. Sun, and P. Zhang. 2019. “Automatic Building Extraction from High-Resolution Aerial Images and LiDAR Data Using Gated Residual Refinement Network.” ISPRS Journal of Photogrammetry and Remote Sensing 151:91–105. https://doi.org/10.1016/j.isprsjprs.2019.02.019.
- Hu, D., V. J. L. Gan, and C. Yin. 2023. “Robot-Assisted Mobile Scanning for Automated 3D Reconstruction and Point Cloud Semantic Segmentation of Building Interiors.” Automation in Construction 152:104949. https://doi.org/10.1016/j.autcon.2023.104949.
- Hu, H., X. Liang, Y. Ding, X. Yuan, Q. Shang, B. Xu, X. Ge, M. Chen, R. Zhong, and Q. Zhu. 2022. “Semi-Supervised Adversarial Recognition of Refined Window Structures for Inverse Procedural façade Modelling.” ISPRS Journal of Photogrammetry and Remote Sensing 192:215–231. https://doi.org/10.1016/j.isprsjprs.2022.08.014.
- Khaloo, A., and D. Lattanzi. 2017. “Robust Normal Estimation and Region Growing Segmentation of Infrastructure 3D Point Cloud Models.” Advanced Engineering Informatics 34:1–16. https://doi.org/10.1016/j.aei.2017.07.002.
- Liu, H., W. Li, and J. Zhu 2022. “Translational Symmetry-Aware Facade Parsing for 3D Building Reconstruction.” IEEE MultiMedia : 1–11. https://doi.org/10.1109/MMUL.2022.3195990
- Lu, X., Y. Liu, and K. Li. 2019. “Fast 3D Line Segment Detection from Unorganized Point Cloud [Internet].” Accessed July 3, 2022. https://doi.org/10.48550/arXiv.1901.02532
- Mirzaei, K., M. Arashpour, E. Asadi, H. Masoumi, A. Mahdiyar, and V. Gonzalez. 2023. “End-To-End Point Cloud-Based Segmentation of Building Members for Automating Dimensional Quality Control.” Advanced Engineering Informatics 55:101878. https://doi.org/10.1016/j.aei.2023.101878.
- Pérez, G., A. Escolà, J. R. Rosell-Polo, J. Coma, R. Arasanz, B. Marrero, L. F. Cabeza, and E. Gregorio. 2021. “3D Characterization of a Boston Ivy Double-Skin Green Building Facade Using a LiDAR System.” Building and Environment 206:108320. https://doi.org/10.1016/j.buildenv.2021.108320.
- Poux, F., C. Mattes, Z. Selman, and L. Kobbelt. 2022. “Automatic Region-Growing System for the Segmentation of Large Point Clouds.” Automation in Construction 138:104250. https://doi.org/10.1016/j.autcon.2022.104250.
- Shahzad, M., and X. X. Zhu. 2015. “Robust Reconstruction of Building Facades for Large Areas Using Spaceborne TomoSAR Point Clouds.” IEEE Transactions on Geoscience & Remote Sensing 53 (2): 752–769. https://doi.org/10.1109/TGRS.2014.2327391.
- Steadman, P. 2006. “Why Are Most Buildings Rectangular? Arq.” Architectural Research Quarterly 10 (2): 119–130. https://doi.org/10.1017/S1359135506000200.
- Tian, P., X. Hua, W. Tao, and M. Zhang. 2022. “Robust Extraction of 3D Line Segment Features from Unorganized Building Point Clouds.” Remote Sensing 14 (14): 3279. https://doi.org/10.3390/rs14143279.
- Wang, Y., X. Hu, T. Zhou, Y. Ma, and Z. Li. 2023. “Efficient Building Facade Structure Extraction Method Using Image-Based Laser Point Cloud.” Transactions in GIS 27 (4): 1145–1163. https://doi.org/10.1111/tgis.13063.
- Wang, Y., Y. Ma, A. Zhu, H. Zhao, and L. Liao. 2018. “Accurate Facade Feature Extraction Method for Buildings from Three-Dimensional Point Cloud Data Considering Structural Information.” ISPRS Journal of Photogrammetry and Remote Sensing 139:146–153. https://doi.org/10.1016/j.isprsjprs.2017.11.015.
- Wang, Y., T. Zhou, H. Li, W. Tu, J. Xi, and L. Liao. 2022. “Laser Point Cloud Registration Method Based on Iterative Closest Point Improved by Gaussian Mixture Model Considering Corner Features.” International Journal of Remote Sensing 43 (3): 932–960. https://doi.org/10.1080/01431161.2021.2022242.
- Weinmann, M., B. Jutzi, S. Hinz, and C. Mallet. 2015. “Semantic Point Cloud Interpretation Based on Optimal Neighborhoods, Relevant Features and Efficient Classifiers.” Isprs Journal of Photogrammetry & Remote Sensing 105:286–304. https://doi.org/10.1016/j.isprsjprs.2015.01.016.
- Zolanvari, S. M. I., D. F. Laefer, and A. S. Natanzi. 2018. “Three-Dimensional Building façade Segmentation and Opening Area Detection from Point Clouds.” ISPRS Journal of Photogrammetry and Remote Sensing 143:134–149. https://doi.org/10.1016/j.isprsjprs.2018.04.004.