
ABSTRACT
Hurricane Ian in 2022 was a destructive category 4 Atlantic hurricane striking the state of Florida, which caused hundreds of deaths and injuries, catastrophic property damage, and an economic loss of more than $112 billion. Before the landfall of Ian in Florida, the state government issued evacuation orders in high-risk zones to reduce casualties and injuries. However, there is limited data available to monitor the actual evacuation patterns and compliance with the evacuation orders at a large geographic scale. This study utilizes human mobility data (i.e. SafeGraph Weekly Pattern) to analyse the spatial patterns of evacuation during Hurricane Ian in 2022. The objectives of the study include three key aspects: 1) proposing an analytical workflow that utilizes human mobility data to detect mobility patterns in disasters and other emergency events; 2) identifying significant evacuation patterns, and 3) revealing the spatial variations in the compliance with evacuation orders in the affected areas. Using data science and spatial analysis techniques, this study detected notable changes in population movements, both within Florida and nationwide, which are potentially linked to the hurricane-induced population evacuation. The distance decay pattern of population flows from Florida demonstrates a propensity for individuals to relocate to nearby areas during the hurricane. Furthermore, the increase in population outflows from the impacted areas suggests the effectiveness of mandatory evacuation orders. A more pronounced increase in outflows from designated mandatory evacuation areas points to the public awareness of the evacuation zone designation. This study provides large-scale, fine-resolution analysis of evacuation behaviours in natural disasters which cannot be easily detected in traditional data sources. The analytical workflows provide actionable tools for government agencies and policymakers to evaluate the effectiveness of evacuation orders and improve evacuation plans in future disasters.
1. Introduction
Hurricanes are among the most devastating natural disasters, with catastrophic effects on people’s lives and economies. Over the past twenty years, several hurricanes have struck and inflicted severe damage across the United States. In 2005, Hurricane Katrina struck the central Gulf Coast in the United States, resulting in nearly 1700 fatalities and over $100 billion in economic losses (Beven et al. Citation2008; Knabb, Rhome, and Brown Citation2005). The 2017 hurricane season experienced the ‘terrible trio’ of Hurricanes Harvey, Irma, and Maria, making it the costliest season since 1851 in the United States, with economic losses reaching nearly $370 million (Halverson Citation2018). Research indicates that the frequency of the most intense storms will possibly increase in the future (Knutson et al. Citation2010).
Under the threat of natural hazards and climate change, Florida is often referred to as the most vulnerable state in the United States. Florida hosts the 3rd largest population and 4th largest economy in the country, with the majority concentrated along its coastal regions (NOAA Citation2022). Meanwhile, Florida has been a popular migration destination, attracting more immigrants than any other state between 2010 and 2021 (U.S. Census Bureau Citation2023a). Due to the long coastline stretching from the Atlantic Ocean to the Gulf of Mexico, Florida is particularly at risk of an increased frequency of hurricanes and their potentially catastrophic consequences (Elsner, Niu, and Jagger Citation2004). From 1851 to 2022, a total of 124 hurricanes made landfall in Florida, accounting for 40% of all hurricanes landed in the country (NOAA Citation2005, Citation2023a). The growth of population and economy in the coastal areas is anticipated to exacerbate damages caused by hurricanes (Klotzbach et al. Citation2018). In September 2022, Hurricane Ian stands out as the most recent catastrophic category 4 hurricane that struck Florida, causing over 150 deaths and inflicting damages exceeding $112 billion (Smith Citation2024). Hurricane Ian ranks as the third-costliest weather event on record and is the deadliest hurricane that hit Florida since 1935 (NOAA Citation2023b).
The advances in hurricane monitoring and prediction enable the preparation and issuance of hurricane warnings several days in advance. The prediction of hurricane tracks aids governments in devising regional evacuation strategies based on hurricane levels and anticipated impacts before the hurricane makes landfall. Research has demonstrated that an efficient and timely evacuation system is crucial for safeguarding human lives and protecting properties (Baker Citation1979, Citation1991). While the government may issue evacuation orders, the ultimate decisions lie with the affected residents themselves. The evacuation decision is a complex and dynamic process that depends on a variety of interrelated factors, including individuals’ perceptions of the hurricane risk, prior hurricane experiences, access to information, and the available resources and capabilities for evacuation (Karaye et al. Citation2022; Lazo et al. Citation2015; Roy and Hasan Citation2021; Tanim et al. Citation2022; Whitehead et al. Citation2000). Regardless of the reasons, the residents who refuse or are unable to evacuate not only put themselves in life-threatening situations but also create challenges for emergency response and rescue efforts (Roy and Hasan Citation2021). On the other hand, evacuation is a challenging task due to the complexities associated with moving a large population over long distances within a limited timeframe. Given the peninsular geography of Florida, the majority of evacuees needed to travel northward along limited evacuation routes, which require governmental authorities and policymakers to meticulously, precisely, and timely define evacuation areas and routes (Zhu, Hu, and Collins Citation2020). A spatial analysis of evacuation patterns can provide actionable information for decision-makers to create efficient transportation planning and traffic management to coordinate evacuation flows (Hong and Frias-Martinez Citation2020; Lambert et al. Citation2013). The detection of popular evacuation destinations can facilitate humanitarian relief operations to accommodate the displaced population (Lu, Bengtsson, and Holme Citation2012). In addition, understanding the social and geographic disparities of evacuation order compliance allows emergency responders to prioritize policies and actions to support communities facing challenges in evacuation (Apte Citation2010).
In previous research, surveys and interviews are common methods to study evacuation behaviours during hurricanes (Esteban et al. Citation2015; Pan Citation2020). Using these methods, information about evacuation decisions, transportation mode, evacuation time, destination, and individuals’ socio-economic conditions can be collected to assess the disparities in evacuation behaviours, routes, and destinations (J. E. Kang, Lindell, and Prater Citation2007; Martín, Cutter, and Li Citation2020). However, due to low response rates (Biemer and Lyberg Citation2003), data sample bias (Lusk et al. Citation2007), and the time-consuming process (Baker Citation2009), the traditional methods are insufficient to provide timely and large-scale data about human mobility patterns in disasters, thus hindering the decision-making for emergency response and disaster relief (Collins et al. Citation2018; Lin et al. Citation2023). With the recent advancement of data acquisition and modelling technologies, diverse mobility datasets have emerged, offering novel solutions for monitoring human dynamics in various contexts. During COVID-19, a variety of human mobility datasets (Aktay et al. Citation2020; Kuchler, Russel, and Stroebel Citation2020; Warren and Skillman Citation2020) were utilized to aid the battle against the pandemic. As one of the most widely used mobility datasets, SafeGraph provides hourly visitations to 51 million POIs within the U.S, enabling detailed monitoring of human mobility at fine spatio-temporal resolutions (Chang et al. Citation2021; Her et al. Citation2022; Y. Kang et al. Citation2020). Despite the successful applications in the COVID-19 pandemic, the potential of these human mobility data in the disaster research field, particularly in monitoring evacuation patterns, remains largely unexplored.
Therefore, this study utilizes the SafeGraph Weekly Pattern dataset to investigate the spatial patterns of evacuation during Hurricane Ian in 2022. Specifically, this study aims to address the following research questions: (1) How do population flows change across different hurricane phases? (2) Which evacuation routes and destinations are predominantly selected during Hurricane Ian? (3) Does the compliance with the evacuation orders vary in geographic space? To answer these questions, this study proposes an analytical workflow that leverages the SafeGraph Weekly Pattern dataset to detect evacuation patterns and analyse evacuation compliance in Hurricane Ian. The analysis results can help us gain insights into the socio-economic disparities in disaster preparedness, response, and community resilience. The analytical methods developed in this research are actionable tools that can provide support for evidence-based decision-making in various disaster scenarios.
2. Related work
2.1. Traditional approaches
In previous research, researchers often used surveys and interviews to gather data related to the evacuation decision-making of residents at disaster risk. Surveys often use a structured, predetermined set of questions to collect quantitative data that is suitable for rigorous statistical analyses (Harris and Brown Citation2010). Adeola (Citation2009) employed paper-and-pencil surveys to explore the relationship between the duration of residency as well as prior experiences and evacuation in Hurricane Katrina. The results indicate that the duration of residency is positively affected by evacuation, while prior experiences are negatively associated with evacuation. Brown et al. (Citation2016) discussed factors that may have influenced evacuation behaviour and evacuation times in Hurricane Sandy based on in-person surveys. Morss et al. (Citation2016) used web-survey method to explore how different types of forecasting and warning information affect evacuation decisions in a hypothetical hurricane scenario. In addition, other types of surveys, including mail surveys (Brackenridge et al. Citation2012; Lindell Michael, Lu, and Prater Carla Citation2005; Zhang, Prater, and Lindell Citation2004), and mixed surveys (McClure et al. Citation2011), are frequently applied in hurricane evacuation studies. Personal or group interviews, which are less structured and more flexible in form, are able to collect in-depth information on individuals’ attitudes, opinions, and actions about evacuation (Kendall Citation2014). In-person interviews conducted in hurricane-impacted areas enable participants to furnish more precise and comprehensive narratives regarding their individual decision-making processes (Baker Citation1995; Collins et al. Citation2018; Johnson, Scheitle, and Ecklund Citation2021; Weller, Baer, and Prochaska Citation2016). In addition to in-person interviews, telephone interviews offer a distinct advantage wherein a larger portion of the respondent’s answers and information can be subject to analysis through computer transcription and subsequent storage (R. M. Stein, Dueñdueñas‐Osorio, and Subramanian Citation2010; R. Stein et al. Citation2013).
These traditional data collection methods have several limitations. Firstly, the low response rate of questionnaire surveys and interviews may constrain the sample size that can be collected, thus undermining their usefulness in studying evacuation in large geographic areas (Biemer and Lyberg Citation2003). The low response rates can often be attributed to survey fatigue, time constraints, privacy concerns, and lack of incentives (Ellis et al. Citation2022). Usually, only hundreds of responses can be collected in evacuation surveys (Collins et al. Citation2018; Dixon et al. Citation2017; Dow and Cutter Citation2002), which is insufficient to unveil the disparities in evacuation behaviours in all affected communities. Secondly, biased samples collected from these methods may not equally represent diverse population groups. Research shows that survey respondents tended to be young, wealthy, and educated (Lusk et al. Citation2007). The data also often under-represent marginalized communities, which might lead to wrong decisions that impact these communities (Western et al. Citation2016). Thirdly, conducting questionnaire surveys and interviews can be both time-consuming and costly (Baker Citation2009). The preparation and data collection may take weeks or months to complete, not to mention the subsequent tasks of data cleaning and processing (Wright Citation2017). Damages and disruptions in the affected communities may pose additional challenges to the data collection process.
2.2. Big-data approaches
Recent advancements in data acquisition and modelling techniques have brought new opportunities for disaster management and disaster resilience research (Yu, Yang, and Li Citation2018). Given the widespread use of GPS-enabled mobile devices and location-based services, human movements in geographical space create a wealth of digital traces in cyberspace, resulting in a variety of human mobility data. Particularly during COVID-19, human mobility data has become a valuable instrument to combat the pandemic. These human mobility data contains aggregated, anonymized measurements of people’s movements captured through GPS signals, connections to Wi-Fi networks, mobile beacons, and other means. These data provide various metrics describing human mobility which can help scientists to predict the spread of COVID-19 (Alessandretti Citation2022), evaluate the effectiveness and adherence to intervention policies (Levin et al. Citation2021), and analyse impacts on socio-economic activities (de Palma, Vosough, and Liao Citation2022). SafeGraph (Citation2020) serves researchers by offering a freely accessible, timely updated, and relatively precise mobility dataset, prompting researchers to undertake research utilizing this dataset. By leveraging the SafeGraph dataset, researchers have crafted visualization charts and platforms for human mobility (Y. Kang et al. Citation2020; Z. Li et al. Citation2020), investigated the influence of COVID-19 on mobility patterns (Elarde et al. Citation2021; Gao et al. Citation2020), examined alterations in social segregation during COVID-19 (X. Li et al. Citation2022; Zang et al. Citation2021), and offered predictions and insights about the reopening after stay-at-home order (X. Li et al. Citation2022).
A variety of mobility data demonstrate great potential in disaster research. For example, Yuan et al. (Citation2022) employed credit card transaction data to investigate the spatial patterns of disaster impacts and community resilience during Hurricane Harvey. Ilbeigi (Citation2019) analysed resilience in the New York transportation network during Hurricane Sandy using GPS-based taxi trajectory data. Additionally, geo-tagged social media data is another common data source for studying human dynamics in disasters. Wang et al. (Citation2016) utilized Twitter data to examine the influence of natural disasters on human mobility patterns in urban populations. Martín et al. (Citation2017) developed the approach to utilize geotagged Twitter data to assess evacuation responses and examine the spatiotemporal variability in Hurricane Matthew. Then Martín et al. (Citation2020) combined Twitter and survey data to explore and assess the evacuation situation in Hurricane Matthew and Hurricane Irma. Zou et al. (Citation2018) analysed the spatial-temporal patterns of Twitter data to understand and assess community resilience. Metaxa-Kakavouli et al. (Citation2018) employed Facebook data to explore the influence of social ties on hurricane evacuation behaviours. Despite the advantages of rapid and large-scale acquisition, social media data often face criticism due to low data quality (Stieglitz et al. Citation2018), biased user demography (Lin et al. Citation2023), and the lack of precise locational data for high-resolution human mobility analysis (Chaniotakis, Antoniou, and Pereira Citation2017).
Furthermore, recent studies have increasingly examined the impact of hurricanes on urban population, employing various data-driven approaches to evaluate preparedness, response, and recovery. Yabe et al. (Citation2019) used SafeGraph data to explore the impact of pre-disaster social connections between cities on the subsequent recovery process of the affected city during Hurricane Maria. Juhász and Hochmair (Citation2020) utilized SafeGraph data to analyse the dynamics of travel behaviour in three major Florida cities and explore a case study of Hurricane Irma, revealing insights into how geographical and temporal factors influence movement to various POI categories. Deng et al. (Citation2021) used Cuebiq data to examine an analysis of relocation patterns before and after Hurricane Harvey, unveiling disparities in race and wealth within disaster evacuation models. Younes et al. (Citation2021) utilized Cuebiq data to examine the evacuation decisions of vulnerable populations during Hurricane Irma, evaluating the effectiveness of the evacuation orders. Esmalian et al. (Citation2022) collected Streetlight data and SafeGraph data to explore variations in access to grocery stores among socially disadvantaged groups at different stages of Hurricane Harvey. These studies show that human mobility data can help to gain unique insights on disparities in hurricane impacts as well as communities’ response and recovery in hurricane disasters. However, the utility of human mobility data in detecting evacuation routes, destinations, and compliance ratios remains unexplored.
3. Study area and data sources
3.1. Hurricane Ian and study area
Hurricane Ian was a powerful category 4 hurricane that first made landfall in the Contiguous United States (CONUS) in 2022. It stands as the third-costliest tropical cyclone disaster in the United States since 1980, and the most expensive in Florida’s history, resulting in 161 fatalities and a loss of $113 billion (NOAA Citation2023b). Hurricane Ian originated as a tropical wave on 19 September 2022, and intensified into a tropical depression on September 23. Continuously strengthening, Ian escalated to a Category 4 hurricane and made landfall near Cayo Costa (located in Lee County) on the Gulf Coast of Florida on September 28 with sustained winds of 150 mph. After the landfall, many coastal communities were severely damaged by high winds and storm surges, resulting in over 2.4 million residents being without power. Subsequently, Ian moved further inland and weakened to a tropical storm, but returned to the Atlantic Ocean, where it was subsequently re-strengthened due to warm Gulf Stream waters. Later, Ian made landfall again as a category 1 hurricane in South Carolina on September 30. Finally, it completely dissipated on 1 October 2022. shows the timeline of key events in Hurricane Ian within three phases. In addition, shows the hurricane track and state designation of evacuation zones from A to F, with Zone A being the most vulnerable to hurricane impacts. To respond to Hurricane Ian, 12 out of 67 Florida counties have issued mandatory evacuation orders, primarily concentrated along the Gulf Coast.
Figure 1. Hurricane Ian track and evacuation zones map (FDEM Citation2022).
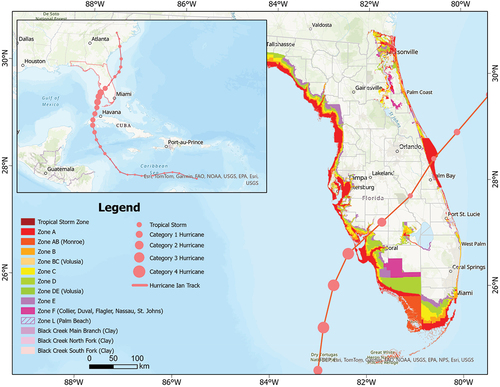
Table 1. Timeline of key events during the three phases of Hurricane Ian.
3.2. Datasets
The data used in this study is from three main sources: SafeGraph data, census data, and evacuation zones. As one of the most widely used human mobility datasets, the SafeGraph data comprises anonymized and aggregated location-based information derived from various sources. The data quality of the SafeGraph weekly pattern dataset has undergone assessment and validation (Y. Kang et al. Citation2020; SafeGraph Citation2023), showing a balanced sampling of POIs and presents a strong association with the population for different demographic groups, races/ethnicities, education levels, and household income. SafeGraph collects the home CBGs of users by analysing users’ most common night-time locations during the last six weeks. By linking visited POIs with their originating CBGs, we can analyse the number and origin of unique visitors to each POI throughout a week. The SafeGraph data includes extensive POIs in both commercial areas and residential areas, with residential areas accounting for ~ 8% of the total POIs. Despite the relatively small proportion of residential POIs, the footprint of visits to commercial POIs, such as gas stations, grocery stores, restaurants, and hotels, also reflects users’ mobility patterns. In this study, SafeGraph recorded more than 1.4 billion POIs visiting data across the United States and Canada during three hurricane phases. To precisely identify evacuees, we extract the foot traffic data originating from Florida, and aggregate both origins and destinations into block group or county levels to generate the essential Origin-Destination (O-D) flow data for subsequent analysis.
Furthermore, socio-economic data in zip codes and block groups are acquired from the Census Bureau (U.S. Census Bureau Citation2023b). The SafeGraph data aggregated in the boundaries of zip codes and block groups are associated with socio-economic data. The evacuation zones are acquired from the Florida Division of Emergency Management (FDEM Citation2022). Additionally, the track of Hurricane Ian was derived from the National Hurricane Center (NHC Citation2022).
4. Research method
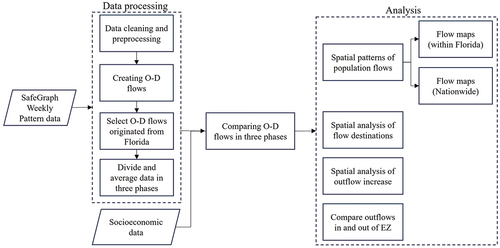
In this study, the SafeGraph data from September 5 to October 9 is divided into three phases. The pre-hurricane phase includes the first three weeks from September 5 to September 25. We assume that human mobility in this phase represents the normal condition. Average population flows in O-D pairs in the pre-hurricane phase are calculated to represent the baseline condition. The week from September 26 to October 2 is the in-hurricane phase, during which the evacuation order was issued, and massive evacuation took place. The week from October 3 to October 9 is defined as the post-hurricane phase, during which the hurricane impact dissipated, and evacuees started to return. The specific framework utilized for this study is depicted in .
Figure 2. The analytical workflow.
4.1. Preprocess
The O-D pairs were created by linking the zip codes of POIs (destinations) and the block groups of visitors’ origins (origins). The visit counts from a specific origin at a POI indicate the quantity of population flows between the O-D pair. Since each POI’s visit often corresponds to visitors from multiple CBGs, we initially transformed the many-to-one O-D pairs into multiple one-to-one O-D pairs. Then, we selected the O-D pairs that have an origin within Florida to capture the evacuation caused by Hurricane Ian. Distances of the O-D pairs are the geodetic distances between the centroids of the origins (block groups) and destinations (zip codes). Population of the origins (block groups) and destinations (census tracts) are obtained from the census data. Additionally, the origins and destinations of the O-D flows are joined with their corresponding boundaries and designated evacuation zones. The O-D pairs are compared in the pre-, in-, and post-hurricane phases defined above to detect mobility changes in the different phases of the hurricane.
4.2. Spatial analysis of outflows, origins, and destinations
The following analyses are conducted in this study. First, we created flow maps to visualize net population flows in O-D pairs during the three phases of the hurricane. The flow maps are created for both population flows within Florida and those across the entire country, highlighting both in-state and out-of-state population movements. The O-D pairs are aggregated in counties to highlight the major routes of population flows. To focus on inter-city evacuations rather than short-distance travels like shopping or daily commuting, we only analysed O-D pairs with a distance exceeding 100 km. By contrasting the population flows in the three phases, we identify changes in population movements during and after the hurricane, enabling the detection of potential evacuation patterns induced by the hurricane. More specifically, we mapped the net population flows for each of the three phases and displayed the change ratios in population flows during the in- and post-hurricane phases, as compared to the pre-hurricane phase (the baseline).
Second, hot spot analysis was conducted to detect popular destinations for the evacuation. Specifically, we calculated the change ratios of visitors from Florida during the in- and post-hurricane phases in comparison to the baseline in all U.S counties. Counties that have a significant increase in Florida visitors may be popular destinations for the hurricane evacuees. The study employs the local Getis-Ord Gi* statistics (Getis and Ord Citation1992) to detect local clusters of visitor change ratios. The Getis-Ord Gi* statistics conduct a statistical test at each spatial feature to assess whether values in the surrounding features are in complete spatial randomness (the null hypothesis). A high value surrounded by high values is a hot spot, and conversely, a low value surrounded by low values is a cold spot. The z-scores and p-values indicate the statistical significance of the hot and cold spots.
Third, we analysed the origins of the O-D flows to reveal the spatial variation of the compliance with the evacuation orders in the affected areas. Specifically, we calculated the percent changes of population outflows during the in- and post-hurricane phases compared to the baseline in the twelve counties under mandatory evacuation orders in the hurricane. An increase in population outflow indicates more evacuees moving out from that place, which suggests a higher compliance with the evacuation orders. Percent changes in population outflow were calculated at both the county and block group levels. At the block group level, we compared the changes in population outflow in and out of the designated evacuation zones (EZ) to understand the effectiveness of the evacuation zone designations. A higher increase in outflows in the EZs compared to the outside may imply higher public awareness of the evacuation zone designation.
5. Results
5.1. Spatial pattern of population flows
5.1.1. Net population flows
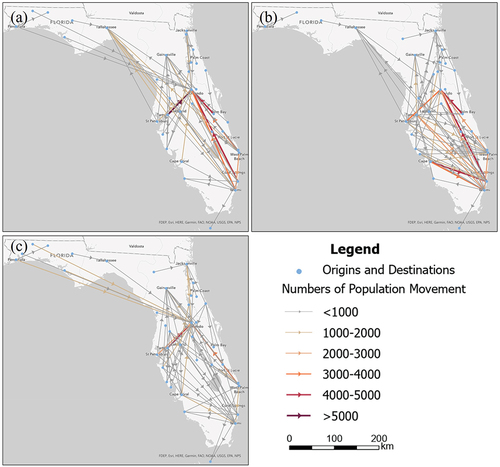
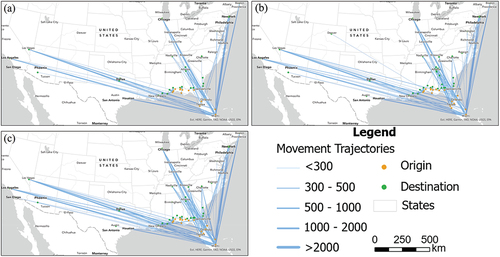
As illustrated in , net population flows within Florida exhibit different patterns in the three phases. Before the hurricane, Orlando stands out as the region with the largest population inflow, while Tampa, Miami, Brevard, Broward, and Palm Beach contribute the largest outflows (). The population flows in the hurricane present a different pattern (). In this phase, an increased number of people are travelling from the west coast, such as Tampa Bay, Fort Myers, and Naples to the east and north, where Miami, Palm Beach, and Jacksonville are the popular destinations. These patterns are consistent with media reports indicating a movement of individuals away from the Gulf Coast towards major cities on the eastern coast (NEWS Citation2022; Vassolo Citation2022). During the post-hurricane phase (), population flows largely return to the baseline pattern, as shown in . Nevertheless, there is a noticeable decline in the population influx towards Orlando, a region directly in the hurricane’s path and experienced extensive inland flooding (Heckard Citation2022). Additionally, the population flows to and from the coastal cities near the landfall locations, such as Cape Coral, Naples, Charlotte Harbor, and Sarasota, remain higher than the baseline condition. This pattern may indicate the continuous evacuation away from the damaged areas, returning evacuees, and disaster operators relocating to provide relief in the affected areas.
Figure 3. Net population flows within Florida in the pre- (a), in- (b), and post-hurricane (c) phases. The arrows represent the directions of the net outflows.
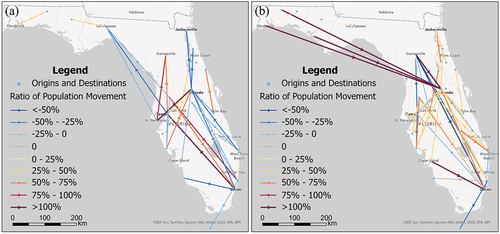
During the in-hurricane phase (), the number of populations travelling from the east coast to Orlando decreases significantly compared to the baseline condition. Population flows from Tampa Bay to Tallahassee have also decreased during this phase. In contrast, the west coast exhibits a significant increase in population outflows towards the eastern cities, with Gainesville, Orlando, and Miami being the three main destinations. The post-hurricane phase shows a widespread increase in population movements in most areas (), particularly in the routes from the Panhandle area and Gainesville to Orlando, and from Cape Coral to Miami. This increase may be attributed to the release of pent-up travel demands and the returning evacuees after the hurricane.
Figure 4. Percent changes of net population flows during the in-hurricane (a) and post-hurricane (b) phases in comparison to the baseline. The arrows represent the directions of the net outflows.
5.1.2. Population flows from Florida to other states
Evacuees are not limited to staying within Florida; they may seek refuge in other states as well. Previous studies show that friends, relatives, and hotels in other states are also popular evacuation destinations (Mesa-Arango et al. Citation2013; Wu, Lindell, and Prater Citation2012). In contrast to the pre-hurricane phase, during the hurricane, travels from Florida to neighbouring states such as Alabama, Georgia, and Tennessee have increased (). Additionally, we have observed an increase in population flows from Florida to distant cities such as Denver, Las Vegas, and Los Angeles, which imply strong connections between Florida and these cities. The trends observed during the hurricane have continued to the post-hurricane phase, except notable increases in distant travels from Florida to both the east and west coast ().
Figure 5. Net population flow in the U.S during the pre-hurricane (a), in-hurricane (b), and post-hurricane (c) phases.
5.2. Destinations of population flows
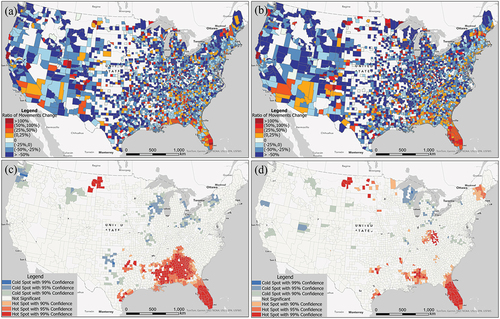
Percent changes of visitors from Florida during and after the hurricane in comparison to the baseline exhibit a salt-and-pepper pattern, with pockets of high and low values distributed across various areas (). Using hotspot analysis, we detect local clusters of high (hot spots) and low (cold spots) percent changes. In addition to counties within Florida, hot spots of Florida visitors tend to spread towards the northwest neighbour states including Alabama, Georgia, Mississippi, and even as far as Louisiana and Texas (). However, there are no hot spots in the neighbourhood counties along the east coast of Georgia. This is possibly due to the second landfall of Hurricane Ian in South Carolina on October 1. Thus, most evacuees from Florida don’t move to the impact areas of the second landfall. In the post-hurricane phase, the hot spots are mainly located within Florida and there is less spillover to the neighbouring states. Additional hot spots emerge in coastal Georgia, Alabama, and Mississippi, along with distant areas such as Kentucky, Massachusetts, and Texas. The presence of these distant hotspots indicates an increase in long-distance travel from Florida in the post-hurricane phase, which can be attributed to the strong socio-economic ties between Florida and these areas. Notably, a hot spot between Montana and North Dakota has been detected during both the in- and post-hurricane phases, indicating continuous population flows from Florida to this area throughout the two phases. The increased population flows spanning over 2,400 km between two distinct climate zones may reveal the existence of snowbird or reverse snowbird routes connecting Florida and this area.
Figure 6. Percent changes of visitors from Florida in contrast to the baseline condition. (a): Percent changes of Florida visitors during the in-hurricane phase. (b): Percent changes of Florida visitors during the post-hurricane phase. (c): hot spot analysis of (a). (d): hot spot analysis of (b).
5.3. Origins of population outflows
To analyse the origins of the evacuees, we compare population outflows during the in- and post-hurricane phases against the baseline values. An increase in population outflow suggests a higher number of evacuees leaving from a specific area. The analysis reveals that nine counties experienced increased population outflows during the hurricane (), which primarily concentrated along the Gulf Coast near the landfall location. Notably, seven of these nine counties were issued mandatory evacuation orders before the hurricane’s landfall. Specifically, Lee County and Charlotte County, both located near the landfall area, show an increase in population outflows by 46.49% and 29.45% respectively during the hurricane. Similarly, Pinellas County and Hillsborough County, which were originally forecasted as the landfall site, exhibit increases of 43.01% and 37.80% respectively.
Figure 7. Percent changes of population outflows in Florida counties during the in-(a) and post-hurricane (b) phases.
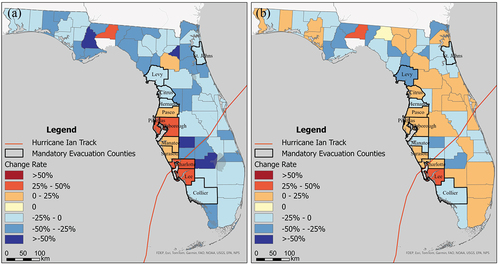
In the post-hurricane phase, population outflows generally return to the baseline level (). However, Lee County, where the hurricane made the landfall, sustained a substantial rise (43.84%) in population outflow, indicating continuous evacuation from the hardest-hit area. Interestingly, despite its distance from the affected areas, Leon County, home to Tallahassee, the state capital, shows the highest increase in population outflow during both the in- and post-hurricane phases. This phenomenon can potentially be attributed to the deployment of emergency response teams from the state capital during and after the hurricane.
Moreover, we compare the percent changes between block groups in and out of the mandatory evacuation zones to evaluate the effectiveness of the EZ designation. In the twelve counties subject to mandatory evacuation orders, population outflows increase 59.92% within the EZs compared to 22.17% outside the EZs (). Specifically, a higher outflow increase in EZs can be observed in eight out of the ten counties where the comparison between EZs and non-EZs can be made. The higher outflows in EZs generally indicate public awareness of the designation of mandatory evacuation zones. The only two exceptions are Levy County and St. Johns County, which are the two farthest counties from the landfall location. In these two counties, the population outflow increases less in EZs than outside.
Table 2. Ratio and ratio changes of outflows within and outside the evacuation zone.
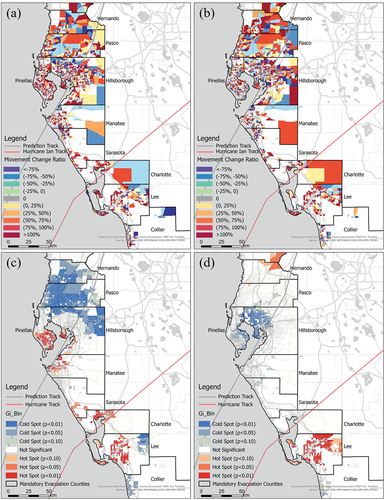
The percent changes in population outflows in block groups in both the in- and post-hurricane phases exhibit a salt-and-pepper pattern, with high and low values dispersed across different areas (). Again, the hot spot analysis (i.e. Getis-Ord Gi* statistics) helps highlight local clusters of the percent changes ()). During the in-hurricane phase (), the hot spots are concentrated in the Tampa Bay and Charlotte Harbor areas. Specifically, the south part of Pinellas County, coastal areas of Hillsborough County, Lee County, and Charlotte County are hot spots of outflow increase. Cold spots emerge in the northern parts of Hillsborough County, Pasco County, Hernando County, and the inland areas of Lee County, and Collier County. During the post-hurricane phase (), the hot spots are primarily detected in Lee County, indicating on-going population outflows from the most affected areas after the hurricane. However, the coastal areas in Tampa Bay, which are hot spots of population outflow during the hurricane, become cold spots after the hurricane. The other cold spots detected during the hurricane have mostly disappeared after the hurricane.
Figure 8. Percent changes of population outflows in contrast to the baseline in block groups near the landfall location. (a): Percent change of population outflows during the in-hurricane phase. (b): Percent change of population outflows during the post-hurricane phase. (c) &; (d): Hot spot analysis of (a) &; (d) respectively.
5.4. Distance of population outflows
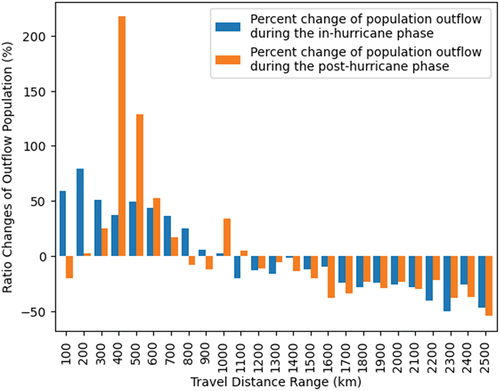
The percent change in outflow population in the twelve counties under mandatory evacuation orders demonstrates a distance decay pattern during both the pre- and in-hurricane phases (). During the in-hurricane phase, the percent change of outflow is highest within 200 km and then starts to decrease as distance increases. This is in line with the spatial pattern of population outflow detected in , where Florida residents tend to relocate within the state or to neighbouring states. In the post-hurricane phase, the outflow increase peaks in the 500–700 km range, indicating more longer-distance travels in this phase.
Figure 9. Percent change in population outflow in different distance ranges in the in- and post-hurricane phase compared to the baseline.
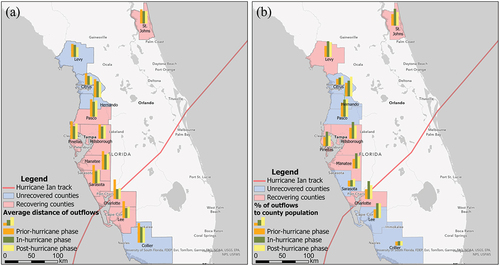
Furthermore, the average distance of population outflows in the twelve counties under mandatory evacuation orders presents a V-shaped pattern during the three hurricane phases (the dashed line in . These counties show the longest average distance of population outflows during the pre-hurricane phase, which then considerably declines during the in-hurricane phase. Potential causes of such a decline include business and facility closures, disruptions in tourism, and the cancellation of flights. After the hurricane, as socio-economic activities gradually resumed, the average travel distance partially recovered. However, the recovery pattern differs among the twelve counties: eight of the twelve counties present such a V-shaped pattern in the three hurricane phases, which are labelled as ‘recovered’ in . Most of the recovered counties are located along the Gulf Coast near the landfall location. In the remaining four counties, the average travel distance continues to decline after the hurricane, which is marked as ‘unrecovered’. The unrecovered counties are generally far away from the landfall location. In contrast, the ratio of population outflows to total population exhibits a reverse-V trend during the three phases (dashed line in : the ratio of population outflows increases during the in-hurricane phase and then declines during the post-hurricane phase. Among the twelve counties, six counties present such a reverse-V trend and are labelled as ‘recovered’ counties in . Five of the recovered counties are located along the Gulf Coast. It is interesting that St. Johns County, although far from the landfall area, displays a recovery pattern in both average outflow distance and outflow ratio.
Figure 10. Average distance of movement and outflow ratios of county population line chart.
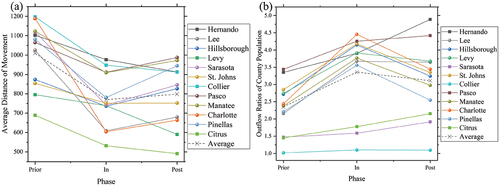
Figure 11. Average distance of outflows (a) and % of population outflows to county population (b) in twelve counties under mandatory evacuation orders during three phases.
6. Discussion
In this study, we employed SafeGraph data to analyse the spatio-temporal changes of population flows in different phases of Hurricane Ian. The main objective of the study is to evaluate the utility of the emerging mobility data in detecting evacuation patterns in natural hazards. Our analyses show that, compared to the pre-hurricane phase (the baseline condition), the population movements have changed during the in- and post-hurricane phases. During the in-hurricane phase, eastbound travels from the Gulf Coast in Florida towards central Florida and the Atlantic Coast has increased. After the hurricane, the movement pattern largely resumes to the baseline, except for continued outflow from the most affected areas. The detected patterns of population movements are in line with the evacuation routes in our expectation or media reports, which confirms the effectiveness of the mobility dataset in detecting evacuation behaviours in the hurricane.
6.1. Evacuation patterns
Our study reveals several evacuation patterns that have not been documented in other studies or media reports. The destinations of the population outflow display a distance decay pattern with most travels concentrated within Florida as well as a prominent overflow of Florida travellers to the neighbourhood states during the hurricane. Our analysis reveals that population outflow from Florida avoided the East Coast and instead moved towards the neighbourhood States in the north and west (e.g. Alabama and Mississippi). During the hurricane, hot spots of population outflows have been detected in Tampa Bay-St. Petersburg-Clearwater metropolitan area and Cape Coral-Fort Myers metropolitan area, which stand as the second and sixth most populous metropolitan regions in Florida, respectively. According to the 2021 Census data (2021), the population in Tampa Bay-St. Petersburg-Clearwater metropolitan area (~3.2 million) is four times that in the Cape Coral-Fort Myers metropolitan area (~0.8 million). Compared to Tampa Bay-St. Petersburg-Clearwater area, the Cape Coral-Fort Myers area has higher median household income ($61,121 vs. $63,235) and has a higher ratio of elderly population.
6.2. Effect of evacuation order
The population outflows from Lee County, which was directly hit by the hurricane, have continued into the post-hurricane phase, even a week after the landfall. The distant hotspots of increased Florida visitors in Texas, South Dakota, and Idaho reveal strong connections between Florida and these areas. The effect of mandatory evacuation orders is evident in the increased population outflows from the affected counties as well as the greater outflow increase within the designated evacuation zones compared to the outside areas. Due to the last-minute change of the hurricane track, Lee County issued the evacuation order at 7 a.m. on September 27, only 27 hours before the landfall. This late issuance of the evacuation order may have caused inadequate evacuation in Lee County, contributing significantly to casualties and injuries during this hurricane. In the post-hurricane phase, Lee County emerges as the largest hot spot, likely due to the extensive hurricane-induced damage in this region, displacing the affected residents to other places. The different paces of population outflows in Lee County and Tampa Bay indicate the importance of timing in evacuation order issuance. As a critical challenge for emergency management authorities, balancing the trade-off between false alarms and delayed evacuation orders in hurricanes requires a combination of advanced technologies, effective communication, and continuous improvement in emergency response strategies. These spatio-temporal patterns detected in the analyses demonstrate the potential of human mobility data in monitoring large-scale evacuation patterns in natural hazards, which effectively overcomes the limitations of traditional data sources (e.g. questionnaires and surveys).
6.3. Limitations
This study has several limitations that need further investigation. Despite the great potential of human mobility data, it is important to note the data quality and uncertainty when we interpret the analyses. Due to public safety and privacy concerns, detailed user information and GPS trajectories are usually not provided, making it impossible to accurately trace specific individual’s movements and explore personal factors influencing movement. In SafeGraph data, visits from a CBG to a POI are only recorded accurately when four or more visitors are coming from that CBG to protect privacy. CBGs are not recorded if there is only one visitor, or they are recorded as four if there are two to four visitors. Additionally, most human mobility datasets are derived from geolocation data captured by mobile apps, which may have a biased user group. Additional processing is needed to calibrate the dataset to eliminate such biases and gain a more realistic representation of the population.
Moreover, further research is needed to improve the method for more precise evacuation detection. In this study, we assume that the change in population flows during the in- and post-hurricane phases compared to the baseline somehow reflects evacuation patterns. However, to what extent the changes can represent evacuation patterns need to be validated against additional data sources. To address this issue, ground-truth data should be collected in the popular origins and destinations of evacuation to validate the detected patterns and calibrate the detection method. Additionally, it’s important to recognize that hurricane impacts can lead to various changes in individuals’ travel behaviours, including emergency responses and reduced travel demands. These changes may vary across regions. Consequently, adjusting the baseline figures to account for these alterations in travel behaviours can result in a more precise detection of evacuation flows. The influence of prior hurricane experiences also needs to be considered when analysing evacuation decision-making. Florida residents who have experienced previous hurricanes like Hurricane Irma may opt for different evacuation timing and destinations than those facing evacuation orders for the first time. Summarizing and analysing past hurricane evacuation patterns can aid in predicting future hurricane evacuation decisions. Furthermore, this study focuses on evacuations exceeding 100 km, and future studies can shed light on the visits to local shelters to understand short-term evacuation behaviours. Finally, the visualization of the population flows has room for improvement. In this study, we found it is quite challenging to effectively display directional population flows among a large amount of OD pairs in static maps. In future work, advanced visualization techniques such as interactive 3D maps or animated maps should be experimented with to show these patterns.
7. Conclusion
In this study, we applied the SafeGraph Weekly Pattern dataset to analyse the spatio-temporal changes in population movements during Hurricane Ian. The objectives of the study include three key aspects: 1) developing a framework for detecting evacuation patterns in human mobility data, 2) delineating the significant spatio-temporal evacuation trends during Hurricane Ian, and 3) unveiling the spatial variations in the compliance to evacuation orders in the affected areas. The analyses revealed notable changes in population movements, both within Florida and nationwide, which are potentially linked to the hurricane-induced population evacuation. The distance decay pattern of Florida visitors demonstrates a propensity for individuals to relocate to nearby areas during the hurricane. Furthermore, the increase in population outflows from the impacted areas suggests the effectiveness of mandatory evacuation orders. A more pronounced increase in outflows from designated mandatory evacuation areas points to the public awareness of the evacuation zone designation.
Notably, variations in the pace of population outflows between Tampa Bay (the originally forecasted landfall location) and Lee County (the final landfall location) highlight the critical role of the timing of evacuation order issuance in emergency response. Moreover, the V-shaped patterns observed in population outflows across the three phases of the hurricane offered insights into the impacts of the hurricane and the subsequent recovery within affected communities. In summary, this study demonstrates the great potential of human mobility data for monitoring evacuation behaviours in natural disasters. The large-scale, fine-resolution population movements captured by the human mobility data overcome the limitations of traditional data sources (e.g. questionnaire surveys and interviews) and provide novel insights into human dynamics and resilience research in natural disasters. This analytical approach is also applicable to diverse datasets for other disaster events. Future research should leverage additional data sources to calibrate and validate the evacuation detection methods.
Disclosure statement
Any opinions, findings, and conclusions or recommendations expressed in this material are those of the author(s) and do not necessarily reflect the views of the National Science Foundation.
Additional information
Funding
References
- Adeola, F. O. 2009. “Katrina Cataclysm: Does Duration of Residency and Prior Experience Affect Impacts, Evacuation, and Adaptation Behavior Among Survivors?” Environment and Behavior 41 (4): 459–489. https://doi.org/10.1177/0013916508316651.
- Aktay, A., S. Bavadekar, G. Cossoul, J. Davis, D. Desfontaines, A. Fabrikant, E. Gabrilovich, K. Gadepalli, B. Gipson, and M. Guevara. 2020. Google COVID-19 Community Mobility Reports: Anonymization Process Description (Version 1.1). arXiv preprint arXiv:2004.04145.
- Alessandretti, L. 2022. “What Human Mobility Data Tell Us About COVID-19 Spread.” Nature Reviews Physics 4 (1): 12–13. https://doi.org/10.1038/s42254-021-00407-1.
- Apte, A. 2010. “Humanitarian Logistics: A New Field of Research and Action.” Foundations and trends® in Technology, Information and Operations Management 3 (1): 1–100. https://doi.org/10.1561/0200000014.
- Baker, E. J. 1979. “Predicting Response to Hurricane Warnings-Reanalysis of Data from 4 Studies.” Mass emergencies 4 (1): 9–24.
- Baker, E. J. 1991. “Hurricane Evacuation Behavior.” International Journal of Mass Emergencies & Disasters 9 (2): 287–310. https://doi.org/10.1177/028072709100900210.
- Baker, E. J. 1995. “Public Response to Hurricane Probability Forecasts.” The Professional Geographer 47 (2): 137–147. https://doi.org/10.1111/j.0033-0124.1995.00137.x.
- Baker, E. J. 2009. “Acquiring Data on Travel Behaviour During Emergencies and Exceptional Events.”Transport Survey Methods: Keeping Up with a Changing World, edited by P. Bonnel, M. Lee-Gosselin, J. Zmud, and J.-L. Madre, 197–211. Leeds, UK: Emerald Group Publishing Limited.
- Beven, J. L., L. A. Avila, E. S. Blake, D. P. Brown, J. L. Franklin, R. D. Knabb, R. J. Pasch, J. R. Rhome, and S. R. Stewart. 2008. “Atlantic Hurricane Season of 2005.” Monthly Weather Review 136 (3): 1109–1173. https://doi.org/10.1175/2007MWR2074.1.
- Biemer, P. P., and L. E. Lyberg. 2003. Introduction to Survey Quality. New York, USA: John Wiley & Sons.
- Brackenridge, S., L. K. Zottarelli, E. Rider, and B. Carlsen-Landy. 2012. “Dimensions of the Human–Animal Bond and Evacuation Decisions Among Pet Owners During Hurricane Ike.” Anthrozoös 25 (2): 229–238. https://doi.org/10.2752/175303712X13316289505503.
- Brown, S., H. Parton, C. Driver, and C. Norman. 2016. “Evacuation During Hurricane Sandy: Data from a Rapid Community Assessment.” PLoS Currents 8. https://doi.org/10.1371/currents.dis.692664b92af52a3b506483b8550d6368.
- Chang, S., E. Pierson, P. W. Koh, J. Gerardin, B. Redbird, D. Grusky, and J. Leskovec. 2021. “Mobility Network Models of COVID-19 Explain Inequities and Inform Reopening.” Nature 589 (7840): 82–87. https://doi.org/10.1038/s41586-020-2923-3.
- Chaniotakis, E., C. Antoniou, and F. C. Pereira. 2017. “Enhancing Resilience to Disasters Using Social Media.” 2017 5th IEEE International Conference on Models and Technologies for Intelligent Transportation Systems (MT-ITS), June 26–28, 2017, Naples, Italy.
- Collins, J., R. Ersing, A. Polen, M. Saunders, and J. Senkbeil. 2018. “The Effects of Social Connections on Evacuation Decision Making During Hurricane Irma.” Weather, Climate, and Society 10 (3): 459–469. https://doi.org/10.1175/WCAS-D-17-0119.1.
- Deng, H., D. P. Aldrich, M. M. Danziger, J. Gao, N. E. Phillips, S. P. Cornelius, and Q. R. Wang. 2021. “High-Resolution Human Mobility Data Reveal Race and Wealth Disparities in Disaster Evacuation Patterns.” Humanities and Social Sciences Communications 8 (1): 144. https://doi.org/10.1057/s41599-021-00824-8.
- de Palma, A., S. Vosough, and F. Liao. 2022. “An Overview of Effects of COVID-19 on Mobility and Lifestyle: 18 Months Since the Outbreak.” Transportation Research Part A: Policy and Practice 159:372–397. https://doi.org/10.1016/j.tra.2022.03.024.
- Dixon, D. S., P. Mozumder, W. F. Vásquez, and H. Gladwin. 2017. “Heterogeneity within and Across Households in Hurricane Evacuation Response.” Networks and Spatial Economics 17 (2): 645–680. https://doi.org/10.1007/s11067-017-9339-0.
- Dow, K., and S. L. Cutter. 2002. “Emerging Hurricane Evacuation Issues: Hurricane Floyd and South Carolina.” Natural Hazards Review 3 (1): 12–18. https://doi.org/10.1061/(ASCE)1527-6988.
- Elarde, J., J.-S. Kim, H. Kavak, A. Züfle, T. Anderson, and I. Benenson. 2021. “Change of Human Mobility During COVID-19: A United States Case Study.” PLoS One 16 (11): e0259031. https://doi.org/10.1371/journal.pone.0259031.
- Ellis, L. A., C. Pomare, K. Churruca, A. Carrigan, I. Meulenbroeks, M. Saba, and J. Braithwaite. 2022. “Predictors of Response Rates of Safety Culture Questionnaires in Healthcare: A Systematic Review and Analysis.” BMJ Open 12 (9): e065320. https://doi.org/10.1136/bmjopen-2022-065320.
- Elsner, J. B., X. Niu, and T. H. Jagger. 2004. “Detecting Shifts in Hurricane Rates Using a Markov Chain Monte Carlo Approach.” Journal of Climate 17 (13): 2652–2666. https://doi.org/10.1175/1520-0442(2004)017<2652:DSIHRU>2.0.CO;2.
- Esmalian, A., N. Coleman, F. Yuan, X. Xiao, and A. Mostafavi. 2022. “Characterizing Equitable Access to Grocery Stores During Disasters Using Location-Based Data.” Scientific reports 12 (1): 20203. https://doi.org/10.1038/s41598-022-23532-y.
- Esteban, M., V. P. Valenzuela, N. Y. Yun, T. Mikami, T. Shibayama, R. Matsumaru, H. Takagi, N. D. Thao, M. De Leon, and T. Oyama. 2015. “Typhoon Haiyan 2013 Evacuation Preparations and Awareness.” International Journal of Sustainable Future for Human Security 3 (1): 37–45. https://doi.org/10.24910/jsustain/3.1/3745.
- FDEM. (2022). Know Your Zone, Know Your Home. https://www.floridadisaster.org/.
- Gao, S., J. Rao, Y. Kang, Y. Liang, and J. Kruse. 2020. “Mapping County-Level Mobility Pattern Changes in the United States in Response to COVID-19.” SIGSpatial Special 12 (1): 16–26. https://doi.org/10.1145/3404820.3404824.
- Getis, A., and J. K. Ord. 1992. “The Analysis of Spatial Association by Use of Distance Statistics.” Geographical Analysis 24 (3): 189–206. https://doi.org/10.1111/j.1538-4632.1992.tb00261.x.
- Halverson, J. B. 2018. “The Costliest Hurricane Season in U.S. History.” Weatherwise 71 (2): 20–27. https://doi.org/10.1080/00431672.2018.1416862.
- Harris, L. R., and G. T. Brown. 2010. “Mixing Interview and Questionnaire Methods: Practical Problems in Aligning Data.” Practical Assessment, Research & Evaluation 15 (1): 1.
- Heckard, D. 2022. Hurricane Ian’s Flooding Nightmare in Central Florida. https://www.news4jax.com/news/2022/10/07/hurricane-ians-flooding-nightmare-in-central-florida/.
- Her, P. H., S. Saeed, K. H. Tram, and S. R. Bhatnagar. 2022. “Novel Mobility Index Tracks COVID-19 Transmission Following Stay-At-Home Orders.” Scientific Reports 12 (1): 7654. https://doi.org/10.1038/s41598-022-10941-2.
- Hong, L., and V. Frias-Martinez. 2020. “Modeling and Predicting Evacuation Flows During Hurricane Irma.” EPJ Data Science 9 (1): 29. https://doi.org/10.1140/epjds/s13688-020-00247-6.
- Ilbeigi, M. 2019. “Statistical Process Control for Analyzing Resilience of Transportation Networks.” International Journal of Disaster Risk Reduction 33:155–161. https://doi.org/10.1016/j.ijdrr.2018.10.002.
- Johnson, D. R., C. P. Scheitle, and E. H. Ecklund. 2021. “Beyond the In-Person Interview? How Interview Quality Varies Across In-Person, Telephone, and Skype Interviews.” Social Science Computer Review 39 (6): 1142–1158. https://doi.org/10.1177/0894439319893612.
- Juhász, L., and H. H. Hochmair. 2020. “Studying Spatial and Temporal Visitation Patterns of Points of Interest Using SafeGraph Data in Florida.” GI_Forum 1:119–136. https://doi.org/10.1553/giscience2020_01_s119.
- Kang, Y., S. Gao, Y. Liang, M. Li, J. Rao, and J. Kruse. 2020. “Multiscale Dynamic Human Mobility Flow Dataset in the US During the COVID-19 Epidemic.” Scientific Data 7 (1): 390. https://doi.org/10.1038/s41597-020-00734-5.
- Kang, J. E., M. K. Lindell, and C. S. Prater. 2007. “Hurricane Evacuation Expectations and Actual Behavior in Hurricane Lili 1.” Journal of Applied Social Psychology 37 (4): 887–903. https://doi.org/10.1111/j.1559-1816.2007.00191.x.
- Karaye, I. M., N. Taylor, M. Perez-Patron, C. Thompson, and J. A. Horney. 2022. “Factors Associated with Hurricane Evacuation: A Statistical Meta-Analysis of Studies, 1999-2018.” Disaster Medicine and Public Health Preparedness 16 (3): 1064–1072. https://doi.org/10.1017/dmp.2021.24.
- Kendall, L. 2014. “The Conduct of Qualitative Interviews: Research Questions, Methodological Issues, and Researching Online.” In Handbook of Research on New Literacies, edited by J. Coiro, M. Knobel, C. Lankshear, and D. J. Leu, 133–150. New York, USA: Routledge.
- Klotzbach, P. J., S. G. Bowen, R. Pielke, and M. Bell. 2018. “Continental US Hurricane Landfall Frequency and Associated Damage: Observations and Future Risks.” Bulletin of the American Meteorological Society 99 (7): 1359–1376. https://doi.org/10.1175/BAMS-D-17-0184.1.
- Knabb, R. D., J. R. Rhome, and D. P. Brown. 2005. Tropical Cyclone Report: Hurricane Katrina, 23–30 August 2005. National Hurricane Center.
- Knutson, T. R., J. L. McBride, J. Chan, K. Emanuel, G. Holland, C. Landsea, I. Held, J. P. Kossin, A. K. Srivastava, and M. Sugi. 2010. “Tropical Cyclones and Climate Change.” Nature Geoscience 3 (3): 157–163. https://doi.org/10.1038/ngeo779.
- Kuchler, T., D. Russel, and J. Stroebel. 2020. “The Geographic Spread of COVID-19 Correlates with the Structure of Social Networks As Measured by Facebook.” (w26990): w26990. National Bureau of Economic Research. https://doi.org/10.3386/w26990
- Lambert, J. H., A. I. Parlak, Q. Zhou, J. S. Miller, M. D. Fontaine, T. M. Guterbock, J. L. Clements, and S. A. Thekdi. 2013. “Understanding and Managing Disaster Evacuation on a Transportation Network.” Accident Analysis & Prevention 50:645–658. https://doi.org/10.1016/j.aap.2012.06.015.
- Lazo, J. K., A. Bostrom, R. E. Morss, J. L. Demuth, and H. Lazrus. 2015. “Factors Affecting Hurricane Evacuation Intentions.” Risk Analysis: An Official Publication of the Society for Risk Analysis 35 (10): 1837–1857. https://doi.org/10.1111/risa.12407.
- Levin, R., D. L. Chao, E. A. Wenger, and J. L. Proctor. 2021. “Insights into Population Behavior During the COVID-19 Pandemic from Cell Phone Mobility Data and Manifold Learning.” Nature Computational Science 1 (9): 588–597. https://doi.org/10.1038/s43588-021-00125-9.
- Li, X., X. Huang, D. Li, and Y. Xu. 2022. “Aggravated Social Segregation During the COVID-19 Pandemic: Evidence from Crowdsourced Mobility Data in Twelve Most Populated U.S. Metropolitan Areas.” Sustainable Cities and Society 81:103869. https://doi.org/10.1016/j.scs.2022.103869.
- Li, Z., X. Huang, X. Ye, and X. Li. 2020. “ODT Flow Explorer: Extract, Query, and Visualize Human Mobility.” ArXiv. https://doi.org/10.1371/journal.pone.0241957.
- Lindell Michael, K., J.-C. Lu, and S. Prater Carla. 2005. “Household Decision Making and Evacuation in Response to Hurricane Lili.” Natural Hazards Review 6 (4): 171–179. https://doi.org/10.1061/(ASCE)1527-6988(2005)6:4(171).
- Lin, B., L. Zou, H. Zhou, M. Yang, and B. Cai. 2023. “Sensing the Pulse of the Pandemic: Geovisualizing the Demographic Disparities of Public Sentiment Toward COVID-19 Through Social Media.” Cartography and Geographic Information Science 1–19. arXiv preprint arXiv:2304.06120. https://doi.org/10.1080/15230406.2024.2323489.
- Lu, X., L. Bengtsson, and P. Holme. 2012. “Predictability of Population Displacement After the 2010 Haiti Earthquake.” Proceedings of the National Academy of Sciences 109 (29): 11576–11581. https://doi.org/10.1073/pnas.1203882109.
- Lusk, C., G. L. Delclos, K. Burau, D. D. Drawhorn, and L. A. Aday. 2007. “Mail versus Internet Surveys: Determinants of Method of Response Preferences Among Health Professionals.” Evaluation & the Health Professions 30 (2): 186–201. https://doi.org/10.1177/0163278707300634.
- Martín, Y., S. L. Cutter, and Z. Li. 2020. “Bridging Twitter and Survey Data for Evacuation Assessment of Hurricane Matthew and Hurricane Irma.” Natural Hazards Review 21 (2). https://doi.org/10.1061/(asce)nh.1527-6996.0000354.
- Martín, Y., Z. Li, S. L. Cutter, and S. Ukkusuri. 2017. “Leveraging Twitter to Gauge Evacuation Compliance: Spatiotemporal Analysis of Hurricane Matthew.” PLoS One 12 (7): e0181701. https://doi.org/10.1371/journal.pone.0181701.
- McClure, L. A., M. L. Boninger, M. L. Oyster, M. J. Roach, J. Nagy, and G. Nemunaitis. 2011. “Emergency Evacuation Readiness of Full-Time Wheelchair Users with Spinal Cord Injury.” Archives of Physical Medicine and Rehabilitation 92 (3): 491–498. https://doi.org/10.1016/j.apmr.2010.08.030.
- Mesa-Arango, R., S. Hasan, S. V. Ukkusuri, and P. Murray-Tuite. 2013. “Household-Level Model for Hurricane Evacuation Destination Type Choice Using Hurricane Ivan Data.” Natural Hazards Review 14 (1): 11–20. https://doi.org/10.1061/(ASCE)NH.1527-6996.0000083.
- Metaxa-Kakavouli, D., P. Maas, and D. P. Aldrich. 2018. “How Social Ties Influence Hurricane Evacuation Behavior.” Proceedings of the ACM on Human-Computer Interaction 2 (CSCW): 1–16. Article 122. https://doi.org/10.1145/3274391.
- Morss, R. E., J. L. Demuth, J. K. Lazo, K. Dickinson, H. Lazrus, and B. H. Morrow. 2016. “Understanding Public Hurricane Evacuation Decisions and Responses to Forecast and Warning Messages.” Weather and Forecasting 31 (2): 395–417. https://doi.org/10.1175/WAF-D-15-0066.1.
- NEWS, C. 2022. Floridians Scramble to Evacuate as Hurricane Ian Strengthens—But Some Refuse to Leave. https://www.cbsnews.com/news/hurricane-ian-category-4-evacuations-tampa/.
- NHC. 2022. IAN Graphics Archive: 5-Day Forecast Track and Watch/Warning Graphic. https://www.nhc.noaa.gov/archive/2022/IANgraphics.php?product=5dayconenoline.
- NOAA. 2005. U.S. Mainland Hurricane Strikes by State, 1851–2004. https://www.nhc.noaa.gov/paststate.shtml.
- NOAA. (2022. NOAA National Centers for Environmental Information, Monthly National Climate Report for September 2022. https://www.ncei.noaa.gov/access/monitoring/monthly-report/national/202209/supplemental/page-5.
- NOAA. 2023a. Continental United States Hurricane Impacts/Landfalls (1851-2022). https://www.aoml.noaa.gov/hrd/hurdat/AllU.S.Hurricanes.html.
- NOAA. 2023b. NOAA National Centers for Environmental Information (NCEI) U.S. Billion-Dollar Weather and Climate Disasters. https://www.ncei.noaa.gov/access/billions/.
- Pan, A. 2020. “Study on the Decision-Making Behavior of Evacuation for Coastal Residents Under Typhoon Storm Surge Disaster.” International Journal of Disaster Risk Reduction 45:101522. https://doi.org/10.1016/j.ijdrr.2020.101522.
- Roy, K. C., and S. Hasan. 2021. “Modeling the Dynamics of Hurricane Evacuation Decisions from Twitter Data: An Input Output Hidden Markov Modeling Approach.” Transportation Research Part C: Emerging Technologies 123:102976. https://doi.org/10.1016/j.trc.2021.102976.
- SafeGraph. 2020. SafeGraph COVID-19 Data Consortium. https://www.safegraph.com/covid-19-data-consortium.
- SafeGraph. 2023. Knowledge Sharing, Industry Trends, and Everything You Need to Know About Places Data. https://www.safegraph.com/blog.
- Smith, A. B. 2024. “2023 US Billion-dollar weather and climate disasters in historical context.” 104th AMS Annual Meeting, January 28–February 1, 2024, Baltimore, MD, USA. New York, NY, USA: American Meteorological Society.
- Stein, R., B. Buzcu‐Guven, L. Dueñdueñas‐Osorio, D. Subramanian, and D. Kahle. 2013. “How Risk Perceptions Influence Evacuations from Hurricanes and Compliance with Government Directives.” Policy Studies Journal 41 (2): 319–342. https://doi.org/10.1111/psj.12019.
- Stein, R. M., L. Dueñdueñas‐Osorio, and D. Subramanian. 2010. “Who Evacuates When Hurricanes Approach? The Role of Risk, Information, and Location.” Social science quarterly 91 (3): 816–834. https://doi.org/10.1111/j.1540-6237.2010.00721.x.
- Stieglitz, S., M. Mirbabaie, B. Ross, and C. Neuberger. 2018. “Social Media Analytics – Challenges in Topic Discovery, Data Collection, and Data Preparation.” International Journal of Information Management 39:156–168. https://doi.org/10.1016/j.ijinfomgt.2017.12.002.
- Tanim, S. H., B. M. Wiernik, S. Reader, and Y. Hu. 2022. “Predictors of Hurricane Evacuation Decisions: A Meta-Analysis.” Journal of Environmental Psychology 79:101742. https://doi.org/10.1016/j.jenvp.2021.101742.
- U.S. Census Bureau. 2023a. State Population Totals and Components of Change: 2020-2022. https://www.census.gov/data/tables/time-series/demo/popest/2020s-state-total.html.
- U.S. Census Bureau. 2023b. ZIP Code Tabulation Areas (ZCTAs). https://www.census.gov/programs-surveys/geography/guidance/geo-areas/zctas.html.
- Vassolo, M. 2022. Miami-Dade Escapes Hurricane Ian with Minor Damages. https://www.axios.com/local/miami/2022/09/29/power-outage-miami-hurricane-ian.
- Wang, Q., J. E. Taylor, and L. A. Braunstein. 2016. “Patterns and Limitations of Urban Human Mobility Resilience Under the Influence of Multiple Types of Natural Disaster.” PLoS One 11 (1): e0147299. https://doi.org/10.1371/journal.pone.0147299.
- Warren, M. S., and S. W. Skillman. 2020. “Mobility Changes in Response to COVID-19.” arXiv preprint arXiv:2003.14228.
- Weller, S. C., R. Baer, and J. Prochaska. 2016. “Should I Stay or Should I Go? Response to the Hurricane Ike Evacuation Order on the Texas Gulf Coast.” Natural Hazards Review 17 (3): 04016003. https://doi.org/10.1061/(ASCE)NH.1527-6996.0000217.
- Western, B., A. Braga, D. Hureau, and C. Sirois. 2016. “Study Retention As Bias Reduction in a Hard-To-Reach Population.” Proceedings of the National Academy of Sciences 113 (20): 5477–5485. https://doi.org/10.1073/pnas.1604138113.
- Whitehead, J. C., B. Edwards, M. Van Willigen, J. R. Maiolo, K. Wilson, and K. T. Smith. 2000. “Heading for Higher Ground: Factors Affecting Real and Hypothetical Hurricane Evacuation Behavior.” Global Environmental Change Part B: Environmental Hazards 2 (4): 133–142. https://doi.org/10.1016/S1464-2867(01)00013-4.
- Wright, K. B. 2017. “Researching Internet-Based Populations: Advantages and Disadvantages of Online Survey Research, Online Questionnaire Authoring Software Packages, and Web Survey Services.” Journal of Computer-Mediated Communication 10 (3). https://doi.org/10.1111/j.1083-6101.2005.tb00259.x.
- Wu, H.-C., M. K. Lindell, and C. S. Prater. 2012. “Logistics of Hurricane Evacuation in Hurricanes Katrina and Rita.” Transportation Research Part F: Traffic Psychology and Behaviour 15 (4): 445–461. https://doi.org/10.1016/j.trf.2012.03.005.
- Yabe, T., S. V. Ukkusuri, C. Rao, and P. S. 2019. “Mobile Phone Data Reveals the Importance of Pre-Disaster Inter-City Social Ties for Recovery After Hurricane Maria.” Applied Network Science 4 (1): 98. https://doi.org/10.1007/s41109-019-0221-5.
- Younes, H., A. Darzi, and L. Zhang. 2021. “How Effective Are Evacuation Orders? An Analysis of Decision Making Among Vulnerable Populations in Florida During Hurricane Irma.” Travel Behaviour and Society 25:144–152. https://doi.org/10.1016/j.tbs.2021.07.006.
- Yuan, F., A. Esmalian, B. Oztekin, and A. Mostafavi. 2022. “Unveiling Spatial Patterns of Disaster Impacts and Recovery Using Credit Card Transaction Fluctuations.” Environment and Planning B: Urban Analytics and City Science 49 (9): 2378–2391. https://doi.org/10.1177/23998083221090246.
- Yu, M., C. Yang, and Y. Li. 2018. “Big data in natural disaster management: a review.” Geosciences 8 (5): 165. https://doi.org/10.3390/geosciences8050165.
- Zang, E., J. West, N. Kim, and C. Pao. 2021. “US Regional Differences in Physical Distancing: Evaluating Racial and Socioeconomic Divides During the COVID-19 Pandemic.” PLoS One 16 (11): e0259665. https://doi.org/10.1371/journal.pone.0259665.
- Zhang, Y., C. S. Prater, and M. K. Lindell. 2004. “Risk Area Accuracy and Evacuation from Hurricane Bret.” Natural Hazards Review 5 (3): 115–120. https://doi.org/10.1061/(ASCE)1527-6988(2004)5:3(115).
- Zhu, Y.-J., Y. Hu, and J. M. Collins. 2020. “Estimating Road Network Accessibility During a Hurricane Evacuation: A Case Study of Hurricane Irma in Florida.” Transportation Research Part D: Transport & Environment 83:102334. https://doi.org/10.1016/j.trd.2020.102334.
- Zou, L., N. S. N. Lam, H. Cai, and Y. Qiang. 2018. “Mining Twitter Data for Improved Understanding of Disaster Resilience.” Annals of the American Association of Geographers 108 (5): 1422–1441. https://doi.org/10.1080/24694452.2017.1421897.