
 ?Mathematical formulae have been encoded as MathML and are displayed in this HTML version using MathJax in order to improve their display. Uncheck the box to turn MathJax off. This feature requires Javascript. Click on a formula to zoom.
ABSTRACT
The rapid development of information and communications technology (ICT) in recent years leads to the emergence of cyber space and results in the fragmentation of human activities to some extent. Nevertheless, few studies focused on the exploration of fragmentation, the new characteristic of human activities, partially due to the limited access to proper datasets. In this work, massive Call Detail Records (CDR) data and Uniform Resource Locator (URL) data from millions of mobile phone users are used to extract the activity fragmentation in both cyber and physical spaces. The relationships between activity fragmentation in the two spaces and built environment factors are further examined at different geographical scales. The results show that: 1) the spatial distributions of physical human activity fragmentation (PHAF) and cyber human activity fragmentation (CHAF) are inversely correlated; 2) compared with PHAF, CHAF are less associated with the built environment, probably because cyber activities are less restricted in time and space; 3) CHAF are more influenced by physical fragmentations and the relationships are stable across different cites, indicating that cyber space cannot be completely detached from physical space; and 4) the impact of built environment on CHAF and PHAF are different across different cities. The findings not only shed deeper light on activity fragmentation, but also enlighten the future exploration of its association with both cyber and physical spaces.
1. Introduction
With the rapid development of information and communication technologies (ICTs) and their penetration into everyday life, there has been a fundamental shift in human behaviour and lifestyle in recent years (Liu et al. Citation2022). For example, the use of ICT devices such as laptops and smartphones enables synchronous and asynchronous communication among individuals from any location and at any time (Alexander et al. Citation2011). These changes (e.g. new methods to deliver and obtain information) are creating a new kind of spatiality (Ash Citation2009), which is generally called cyber space. Cyber space allows users to generate digital footprints and can be viewed as an extension and complement of physical space to some degree (Ash, Kitchin, and Leszczynski Citation2015; Kwan Citation2002). Various human activities, such as shared mobility (i.e. Uber, e-scooters, and shared bikes), communicating through APPs (i.e. WeChat or WhatsApp), and website browsing, can be conducted in cyber space, and regarded as part of human behaviour that shares the same inherent social logic of human in physical space (Hillier and Hanson Citation1989). Another manifest change brought by ICTs is the emergence of activity fragmentation, which is also a distinctive feature of contemporary human activities. Activity fragmentation refers to the decomposition of activities into smaller tasks that are performed at different times and different locations (Couclelis Citation2003, Citation2004). The concept of fragmentation has been widely used in the field of ecology (Didham et al. Citation1996; Fahrig Citation2019). In urban studies, given that activity fragmentation is highly correlated with the degree of ICT development, activity fragmentation indicators may serve as proxies to measure the extent of ICT advancement, and further be interpreted as an indicator of digital development, particularly at the urban scale. For example, activity fragmentation can be utilized to assess the digitalization levels of different cities and compare disparities among them, while temporally, it can help analyse trends during urban digitalization. Furthermore, activity fragmentation poses challenges to traditional transportation planning. For instance, activity fragmentation means that individuals can work from any location at any time. Consequently, the traditional rush hours during weekdays, marked by significant traffic congestion resulting from commuting, may no longer be as prevalent, potentially rendering conventional transportation planning obsolete.
As awareness of human impact on society grows, there has been a notable shift in policies and planning approaches, transitioning from traditional place-based perspectives to human-based views (Couclelis Citation1998), leading to a surge in studies focusing on human activities. Among the massive studies on human activities, the relationship between human activities and the built environment has been widely explored using regression models based on various datasets such as Point of Interest (POI), and trip-related data (Ballantyne, Singleton, and Dolega Citation2022; Yin and Chi Citation2022). These research findings also confirm that the built environment could impact human activities, and provide policymakers with valuable guidance on urban and transportation planning (Yang et al. Citation2018; Zheng and Zhou Citation2017). However, to the best of our knowledge, there is a limited body of literature focusing on human activity in cyber space, particularly regarding its interaction with the built environment, which provides valuable information from the academic perspective. While some studies have investigated correlations between cyber and physical mobility, and others have delved into the influence of the built environment on cyber visiting preferences (Zhang et al. Citation2022; Zhao et al. Citation2014). However, none have specifically examined the relationship between human activity fragmentation and the built environment in cyber or physical spaces. Furthermore, there is a notable absence of research directly comparing fragmentation in these two spaces. Additionally, acquiring spatial datasets that include simultaneous information in both cyber and physical spaces is a considerable challenge.
To fill the abovementioned gaps, this study firstly expands the concept of human activity fragmentation into cyberspace. Moreover, the association between cyber human activity fragmentation and the built environment is also investigated with the corresponding results in physical space as a benchmark. Using tens of millions of Uniform Resource Locators (URL) and Call Detail Records (CDR) of mobile phones, we quantify activity fragmentation from three aspects (e.g. the number of fragments, distribution of different sizes of fragments, and the configuration of fragments) for each user in both cyber and physical spaces. Then, based on the physical trajectories, four groups of built environment indicators have been proposed and quantified using Point of Interest (POI) data, OpenStreetMap, and MYD13Q1 products from Moderate Resolution Imaging Spectroradiometer (MODIS). Finally, two groups of OLS regression models are built. The first group is conducted across the entire study area (Jilin Province, China), aiming to investigate the influence of the built environment on activity fragmentation and discern disparities between cyber and physical spaces. The second group focuses on various secondary cities within Jilin Province, aiming to explore spatial discrepancies of such relationships.
The main contributions of this study are threefold: First, we expand the concept of human activity fragmentation to cyber space and further quantify it, which are of great value from an academic research perspective. Second, we further investigate the influence of the built environment on activity fragmentation in both cyber and physical spaces, highlighting the distinctions between cyber and physical spaces. Finally, besides presenting an analysis covering the entire study area, we delve into the variances among different geographical regions, intended to unravel the spatial heterogeneity inherent in these relationships.
The rest of the paper is organized as follows: Section 2 provides a brief literature review, Section 3 introduces the study area and datasets used in the study, and Section 4 presents the indicators and models. Section 5 presents the results, followed by a discussion of the main findings, conclusion, and suggestions in Section 6.
2. Literature review
The rapid development and extensive adoption of ICTs have contributed to significant changes in human activity, which provides urban planners with significant implications. One of the most important changes is that ICTs provide us with more flexible methods of conducting activities (Kwan Citation2002; Shaw and Yu Citation2009). For instance, the substitution of traditional landline phones with mobile devices eliminates geographical constraints during communication. Furthermore, ICTs afford individuals a set of options; for instance, individuals can shop online via platforms like Amazon and Taobao or engage in offline shopping at local stores. Additionally, individuals can also compare prices online before making purchases either online or at local stores. These activities, facilitated by ICTs, collectively constitute cyber space. While previous studies on cyber space are primarily within the field of computer science, utilizing complex network theory to analyse cyber networks based on website hyperlinks (Adamic et al. Citation2001; Pastor-Satorras, Vázquez, and Vespignani Citation2001). Some human geographers have also investigated cyber space. For example, the lack of place and the irrelevance of geographical distance have been hot topics for a long time and are still unsolved (Batty Citation1997; Boos Citation2017; Dodge Citation2001; Kwan Citation2001; Shaw and Sui Citation2020). In addition to studies solely focusing on cyber space, some research concentrates on the relationship between cyber and physical spaces, identifying their interdependence and complex interactions. For instance, some findings suggest that e-shopping has changed traditional individual travel and freight shipment patterns (Rotem-Mindali and Salomon Citation2007). Moreover, research indicates that individuals with limited access to local shops are more inclined to engage in e-shopping (Ren and Kwan Citation2009). Furthermore, various conceptual frameworks of network visualization have been proposed to explore human interactions between cyber and physical spaces (Gao et al. Citation2018). Salomon (Citation1986) synthesized four potential relationships between cyber and physical activity: substitution (i.e. cyber activities completely replace original physical activity), generation (i.e. cyber activities increase physical movements), modification (i.e. cyber activities change part of physical activities), and neutrality (i.e. cyber activities have no impact on physical activities). Historically, due to data constraints, much of this research has been theoretical or supported by limited datasets. Additionally, given that cyber space is a newly emerging field, research remains insufficient, leaving room for ongoing debates and exploration.
Activity fragmentation is another consequence of the widespread adoption of ICTs (Shaw and Yu Citation2009). The wide availability of mobile devices such as phones and laptops allows individuals to perform activities flexibly, almost from anywhere and at any time. Initially rooted in ecological studies, fragmentation has been extensively explored such as habitat and forest fragmentation (Fahrig Citation2019; Rutledge Citation2003). Then, Couclelis (Citation2003) firstly used the concept of activity fragmentation to assess the reorganization of activities in time and space due to the influence of ICTs, which were later used in exploring the shift in work patterns (Alexander et al. Citation2011; Saxena and Mokhtarian Citation1997). Acknowledged as a fundamental theoretical concept, various attempts have been made to quantify and evaluate fragmentation. The first attempt was made by Lenz and Nobis (Citation2007), who identified four types of fragmentation based on a sample of 1,612 German works with seven ICT-related variables. More comprehensive and accepted indicators were developed by Hubers et al. (Citation2008) and Alexander et al. (Citation2011), who also suggested the potential impact of the surrounding environment on activity fragmentation. They categorized activity fragmentation into temporal and spatial dimensions and proposed three indicators for each dimension: the number of activity fragments (such as an activity that is broken into 50 smaller tasks is more fragmented than an activity broken into 5 smaller tasks), the distribution of fragment sizes (such as an activity consisting of one 10-hour at the office and one 40 minutes at home is less fragmented than one 5 hours and 20 minutes both at the office and home), and the configuration of fragments (such as smaller tasks that are located nearby is less fragmented than the tasks that are separated far away). While activity fragmentation has gained increasing attention, few studies have expanded this concept to cyber space or conducted comparisons between cyber and physical spaces.
In recent years, numerous studies have focused on human activities, with a key concern being their relationship with the built environment, which serves as one representation of various urban structures. A growing body of studies indicates that the built environment could influence human activity. For example, Etminani-Ghasrodashti and Ardeshiri (Citation2015) investigated the impact of the built environment on human behaviours using social survey data. Zheng and Zhou (Citation2017) revealed an association between trip frequency derived from taxi data and Point of Interest (POI) density. Ye et al. (Citation2018) explored the relationship between the presence of catering calculated from Dianping data and the urban morphology, concluding that ‘block’ and ‘strip’ types were positively related to catering activities. Lu et al. (Citation2019) found that the public transport and facility diversity, derived from POI data, could increase Weibo geo-tagged check-ins. Zhang et al. (Citation2022) examined the relationship between visiting activity in cyber and physical spaces and the built environment, asserting that landmarks and urban nodes could contribute to cyber visits, while physical visits are more associated with the built environment. Many studies have explored the relationship between the built environment and various aspects of human activity, such as frequency and check-ins. However, fragmentation, another characteristic of human activity, has yet to be examined in connection with the built environment.
3. Study area and datasets
3.1. Study area
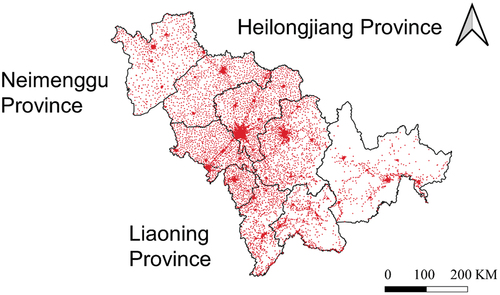
Jilin Province is selected as the study area. It is located in the northeast of mainland China, sharing borders with Heilongjiang, Neimenggu, and Liaoning provinces to the north, west, and south, respectively. Moreover, it shares borders with North Korea and Russia. Covering approximately 191,202 km2, Jilin Province had a population of around 24.07 million by the end of 2020. As shown in , the province is divided into nine second-level administrative regions, each exhibiting significant variations in socioeconomic status, according to government statistics. The red points in denote the locations of over 10,000 cellular towers across the study area.
Figure 1. The study area Jilin Province, China, and the distribution of more than 10,000 cellular towers within the province, as denoted by red points.
3.2. Datasets
There are five types of data used in this study: Uniform Resource Locator (URL) data, Call Detail Record (CDR) data, Point of Interest (POI) data, OpenStreetMap, and remote sensing imagery data. Noticeably, in URL and CDR data, to protect the privacy of users, all of the personal information including user name, phone number, and other data items are masked. In addition, only domain names are extracted from the URLs, and no content of web domains is used in the analysis.
3.2.1. Uniform Resource Locator data
Uniform Resource Locator (URL) data are automatically saved on the server computer when a user accesses the Internet via mobile internet. URL data used in this study were collected on 20 December 2016, with the earliest record at 00:00:00 and the latest record at 23:59:59. While Jilin Province has a population of 24 million inhabitants, a significant proportion of this population is unable to utilize mobile devices, such as individuals under the age of 18, the elderly who lack proficiency in smartphone usage, and those with specific medical conditions. For instance, according to the 2016 Statistical Yearbook of Jilin Province, there are approximately 1,051 individuals under the age of 18 per ten thousand inhabitants. Moreover, the dataset utilized in this study was sourced from China Unicom, one of China’s three major mobile operators. The corresponding official reports indicate that by the end of 2016, China Unicom held a market share accounting for one-seventh of all mobile users. Based on statistical principles applicable to large datasets, a sampling ratio exceeding 10% is considered representative. Therefore, the dataset consisting of 84,052 internet users and around 20 million online records within the study area is regarded sufficient and representative for researching human activity fragmentation. According to the records, the number of web pages visited by users within the day follows a heavy-tail distribution, indicating that a significant proportion of users browsed a relatively low number of website domains. Moreover, it is found that fewer than 20,000 internet users have browsed more than the average of 228 websites. Further examination of these highly active users revealed that factor such as geographic location may contribute to the high frequency of websites browsing, such as long waiting time at public transportation. Additionally, the high frequency of website visits might also be associated with users’ socio-economic status. For example, programmers who specified in mobile applications may generate a significant volume of browsing records. Thirdly, based on our practical experience with internet usage, when a user clicks on a website, they also access multiple embedded domains within that website, all of which are recorded, and consequently result in a high average number of website visits per user. Some examples of HTTP URL data users in the study are presented in , including user IDs, cell IDs, request times, and URLs.
Table 1. The HTTP URL sample data.
3.2.2. Call Detail Record (CDR) data
When a user accesses the Internet, the physical location of the user can be approximately inferred based on the location of the connected cellular tower. In this study, the locations of the connected cellular tower are straightforwardly used to estimate users’ locations, because users’ communication records are only stored when he/she is within the service range of the connected cellular tower, as shown by the Cell ID in . In addition, when a mobile phone communicates with the cellular tower station (signal connection, phone call, or text message), attributes such as phone number, time, and status are automatically documented, which constitute what we call CDR data. However, to protect the privacy of users, only the information in is used in the study. In total, there are 12,800 cell towers in the study area, and 84,052 users that are same as the URL data.
Table 2. The Call Detail Record sample data.
3.2.3. Point of Interest (POI) data
Due to their extensive coverage, ease of access, and relatively high accuracy, Point of Interest (POI) data have emerged as primary tools for representing the built environment and investigating its relationship with human behaviours. In the study area, a total of 527,567 Points of Interest (POIs) were collected and recategorized into eight commonly used categories, based on the sectoral classification standard of Amap (Li et al. Citation2022), as shown in .
Table 3. Reclassifying POI based on the sectoral classification standard of Amap.
3.2.4. OpenStreetMap
The street network data used in this work were extracted from OpenStreetMap, which is used for the calculation of independent variables in Subsection 4.1. OpenStreetMap is an open-access and volunteer geographic information platform, which can provide massive geodata around the world for a long time. This study uses the road network updated on 1 January 2017, which is temporally closest to the CDR records.
3.2.5. Moderate Resolution Imaging Spectroradiometer (MODIS)
The Normalized Difference Vegetation Index (NDVI) product from MODIS MYD13Q1 is used in this study for the calculation of landscape indicators in Subsection 4.1. The NDVI data is generated every 16 days with a spatial resolution of 250 metres. We selected the image on 19 December 2016, which is the closest to the acquired date of CDR records.
4. Methodology
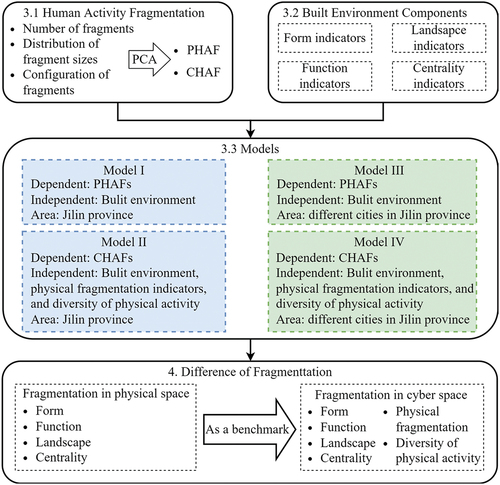
This section delineates the framework () proposed in this study, comprising three primary stages. The initial stage involves extracting indicators to characterize human activity fragmentation. The second stage includes defining and quantifying built environment factors, serving as independent variables in the regression models. The third stage consists of building two groups of regression models to investigate the impact of the built environment on human activity fragmentation.
Figure 2. The workflow of the proposed analytical framework.
4.1. Definition of fragmentation
The computation of human activity fragmentation indicators is performed on the individual level, aiming to reflect the varying degrees of fragmentation in individuals’ activities. Therefore, the indicators proposed in this study are universally applicable across different geographical regions, as long as suitable data is available. The analytical indicators employed to characterize human activity fragmentation in this study include three dimensions: (a) the number of fragments; (b) the distribution of fragment sizes; and (c) the configuration of fragments (Alexander et al. Citation2011; Hubers, Schwanen, and Dijst Citation2008). Accordingly, the three dimensions of activity fragmentation in physical (upper part in ) and cyber spaces (lower part in ) are illustrated by the three parts (a), (b), and (c).
Figure 3. The illustrations of the three dimensions of human activity fragmentation in physical and cyber spaces: (a) Number of fragments; (b) Distribution of fragment sizes; and (c) Configuration of fragments.
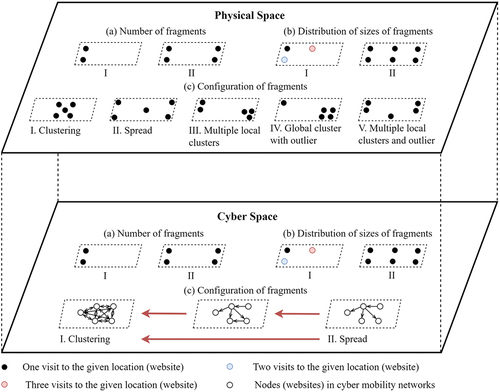
In physical space, the first dimension of fragmentation describes that one user’s activity within one day divided into four locations (Scenario II of the first dimension (a) in the upper part in ) is more fragmented than another user’s activity consisting of only two locations (Scenario I of the first dimension (a) in the upper part in ). Regarding the second dimension, although the two scenarios have equal visits, the number of visits varies for each location. The visits in Scenario I of dimension (b) in the upper part in are concentrated in a relatively small number of locations, which makes the activity in Scenario I less fragmented. Concerning the third dimension (c) in the upper part in , the five scenarios have the same number of visits. However, from Scenario I to Scenario V, the five locations into which an activity is divided become increasingly spread, resulting in more fragmented representations of the activity in the scenarios.
To make the indicators suitable for cyber space where there is no locational reference, some adjustments are made in this study (lower part in ). Analogous to physical space where people visit different locations for various purposes such as shopping, in the cyber space, people visit different website domains for different purposes such as watching videos. Thus, analogous to physical space, the calculation of fragmentation in cyber space is based on website domains. The calculation of the first and second dimensions in cyber space are similar to the physical space with the locations replaced by websites (lower part in . However, due to the inherent characteristics of cyber space, characterized by its timelessness and placelessness (Boos Citation2017), directly applying the calculation method of the third dimension in physical space to cyber space is not feasible. Therefore, to capture a similar concept of the dispersion of visited locations represented by the third dimension, the clustering coefficient derived from cyber mobility networks is utilized as the third dimension of cyber fragmentation. As depicted in the lower part of , the activities become more spread and fragmented from Scenario I to Scenario II. The detailed procedure for computing and constructing cyber mobility networks is described below.
Cyber mobility networks are directed and weighted networks constructed from URL records. The website domains visited by users are regarded as ‘digital locations’, which are the nodes of networks. These consecutive ‘digital locations’ are then connected in chronological order as digital trajectories, which are the edges of networks. A cyber mobility network is generated for each individual using all their records. Subsequently, the clustering coefficient of these networks is computed for each individual, serving as the measurement for the third dimension of cyber fragmentation.
The following delineates the specific computational procedures and provide detailed explanations for each activity fragmentation indicator in both cyber and physical spaces. presents a comprehensive summary of these indicators. Initially, the dimensions of physical fragmentation are elucidated. The mathematical definition of the first dimension, the number of fragments in physical spaces, is shown in EquationEquation (1)(1)
(1) , where
is the number of unique locations visited by the user,
is the total number of activities performed by the user within the day,
represents the number of unique locations visited in the jth activity. The interpretation of this measure is quite straightforward: a larger value indicates a more fragmented activity pattern. The second dimension, the distribution of sizes of fragments, is measured by the P-index, which is defined in this manner: the pattern is more spatially fragmented (i.e. the P-index is close to one) if every location has equal visits rather than some locations have the vast majority of visits. The mathematic definition of the second dimension is displayed in EquationEquation (2)
(2)
(2) , where
represents the total number of visiting activities performed by the user, and
is the frequency of visiting the 1st, 2nd … and Lth locations in physical space. The third dimension represents the configuration of fragments. A fragment’s configuration is reflected by the standard distance in physical space (Bachi Citation1963), which can represent the distribution of visited locations. The interpretation is straightforward: the larger the standard distances are, the wider the dispersion of the visited locations is. The mathematical definition is shown in EquationEquation (3)
(3)
(3) , where
is the ith unique location among all visited unique locations within the day by the user, MC refers to the mean center of all visited locations, and
is the distance between the ith unique location and the mean center of all visited locations.
Table 4. The descriptions of fragmentation indicators in cyber and physical space.
The three dimensions of cyber fragmentation are explained as follows. The mathematical definition of the first dimension in cyber space is similar to the physical space, as displayed in EquationEquation (4)(4)
(4) , where
is the total number of unique visited websites,
is the total number of activities performed by the user within the day, and
is the number of unique websites visited in the jth activity. The second dimension in cyber space, the distribution of fragment sizes, is measured by V-index, as shown in EquationEquation (5)
(5)
(5) , where
represents the total number of visits conducted by the user, and
is the frequency of visiting the 1st, 2nd … and Wth websites in cyber space. This indicator is interpreted as follows: a larger V-index indicates a more fragmented cyber activity, suggesting that visits to websites are evenly distributed across all websites rather than being concentrated on a few. The third dimension of cyber fragmentation, the configuration of fragments, is estimated by the average clustering coefficient calculated from cyber mobility networks, which represents an overall quantification of the clustering of all websites. The average clustering coefficient is calculated based on EquationEquations (6
(6)
(6) –Equation8
(8)
(8) ), where
is the sum of in-degree and out-degree of node v,
is the number of directed triangles through node v, and
is the number of nodes (Fagiolo Citation2007).
is the reciprocal degree of node v, representing the number of bilateral edges between node v and its neighbours, as displayed in EquationEquation 7
(7)
(7) , where
= 1 if there is a directed edge from node k to node v and zero otherwise.
In this study, our emphasis is not on examining every dimension of human activity fragmentation individually. Rather, we focus on obtaining an overall estimation of fragmentation in both cyber and physical spaces. To achieve this, we conducted principal component analysis (PCA) separately for the two spaces, which allowed us to derive overall fragmentation indicators for further investigation. The aggregated indicators resulting from PCA are defined as cyber human activity fragmentation (CHAF) and physical human activity fragmentation (PHAF) in the following sections. Notably, the first dimension in both cyber and physical spaces, as well as the third dimension in physical space, are presented in logarithmic form. Additionally, standardization was applied to all fragmentation indicators to ensure comparability.
4.2. Built environment factors
Fragmentation, as a characteristic of human activity, is also influenced by the surrounding built environment. However, since fragmentation describes human mobility, we quantify the built environment along individuals’ trajectories as independent variables for regression models. Initially, we computed the Voronoi diagram of 12,800 cellular towers in the study area to delineate the coverage area of each tower. Subsequently, we selected four groups of the built environment: form, function, landscape, and centrality (Li et al. Citation2022). The calculations of these variables are based on the Voronoi diagram, and the detailed computation process is described in . Then, the average of the logarithmic form of these variables along the trajectories can be calculated, except for tourist attractions (such as scenic spots and relics), lodgings (such as star and apartment hotels), transit (including bus stops, subway stations, and shuttles), institutions (such as government and major companies), and leisure (such as cinemas, KTVs, and fitness centres). Due to the sparse distribution of these categories, we employed dummy variables for them. A dummy variable, represented by binary values of 0 or 1, is utilized to indicate the absence or presence of a categorical effect that may influence the outcome. In this study, the dummy variables for the five categories denote whether a user’s trajectory passes through these five types of built environments. Taking the tourist attractions category as an example, if a user’s trajectory intersects with tourist attractions such as landmarks, the indicator representing the tourist attractions category for that user would be assigned 1; otherwise, the corresponding indicator will be 0.
Table 5. Description of built environment indicators along people’s trajectories.
4.3. Regression models
Ordinary least squares (OLS) regression models have been selected to examine the associations between human activity fragmentation (the dependent variable) and the built environment (independent variables). There are two dependent variables considered: Cyber Human Activity Fragmentation (CHAF) and Physical Human Activity Fragmentation (PHAF). In Model I, only the built environment indicators are utilized as independent variables. Conversely, Model II incorporates not only the built environment but also the effects of physical activities, aiming to account for potential interactions between cyber and physical activities. Consequently, additional four indicators are introduced: three from physical fragmentation and one representing the diversity of physical activities. Specifically, the diversity indicator is determined using Shannon entropy, a commonly employed measure in ecology and biogeography (Yue et al. Citation2017). The specific calculation formula is shown in EquationEquation (9)(9)
(9) , where
denotes all locations visited by the user,
represents the frequency of visits to the
location and the
is the diversity indicator. Models III and IV were designed to explore the spatial heterogeneity of the relationship between the built environment and human activity fragmentation, with Model III focusing on the physical space and Model IV on the cyber space. In both models, separate OLS models were constructed for every city in Jilin Province, based on its administrative divisions. Concerning the degrees of freedom in models I-IV, the total user sample size exceeds 80,000, and Baishan city has the smallest user sample of 3,037, which also substantially exceeds the number of independent variables in the OLS models. Hence, the models are ensured to have enough degrees of freedom.
To address the multicollinearity issues, variance inflation factor (VIF) and Pearson correlation analysis are performed among the independent variables. Since multicollinearity can lead to bias and greatly influence the results, variables with correlation coefficients larger than 0.7 or VIF greater than 10 are removed (Pan et al. Citation2020; Yu and Liu Citation2021).
5. Results
5.1. Distribution of fragmentation indicators
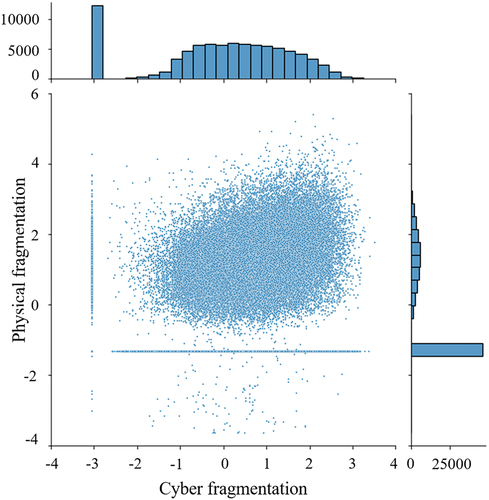
In , every blue point represents the overall fragmentation in cyber and physical spaces for one user, extracted from the URL and CDR records. The X-axis represents the overall cyber fragmentation (i.e. CHAF), and the Y-axis represents the overall physical fragmentation (i.e. PHAF). The two overall fragmentation indicators (i.e. CHAF and PHAF) are outcomes of principal component analysis (PCA), which has condensed the normalized three dimensions of fragmentation (i.e. number of fragments, distribution of fragment sizes, and configuration of fragments) into a single dimension. The PCA results indicate that the total explained variation ratios of principal components in cyber and physical spaces are 83% and 80%, respectively. In cyber space, the factor loadings of the three dimensions are 0.61, 0.51, and −0.60, respectively; in physical space, the factor loadings are 0.61, 0.57, and 0.55. The high total explained variation ratios and high factor loadings in both spaces suggest that the obtained principal components can effectively capture the characteristics of the original three dimensions. Therefore, CHAF and PHAF can provide an overall evaluation of the fragmentation of individuals’ activities in cyber and physical spaces, guiding subsequent regression analyses. The histograms in depict the distributions of CHAF and PHAF, with the top histogram representing CHAF and the right histogram illustrating PHAF. Additionally, the two straight lines in , a vertical and a horizontal line, symbolize two distinct user profiles. The vertical line represents individuals with relatively low cyber fragmentation but varying degrees of physical fragmentation, whereas the horizontal line represents those with minimal physical fragmentation but varying degrees of cyber fragmentation.
Figure 4. Scatter plot of Cyber Human Activity Fragmentation (CHAF) versus Physical Human Activity Fragmentation (PHAF) for every user, with histogram at the top showing the distribution of CHAF values, and histogram on the right showing the distribution of PHAF values.
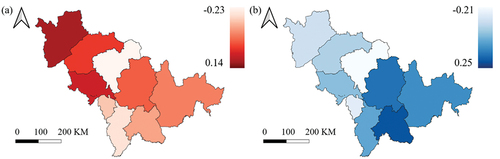
Using the geographic locations of cellular towers to approximate users’ physical locations, users are categorized into nine groups corresponding to the nine administrative cities within Jilin Province. Subsequently, the average CHAF and PHAF of all users in each administrative city are calculated separately, as depicted in . This visualization reveals an inverse spatial distribution pattern: cities in the southeast exhibit high average CHAF and low average PHAF, while cities in the northwest display the opposite trend.
Figure 5. (a) Spatial distribution of average fragmentation indicators in physical space (PHAF), and (b) cyber space (CHAF).
5.2. Regression results
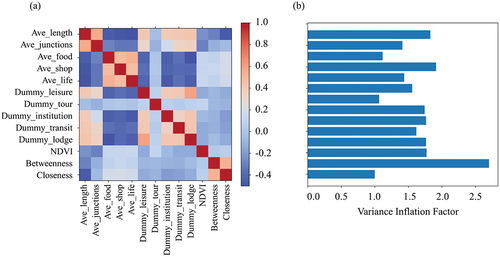
The indicator representing the number of fragments in physical space is removed due to the high correlation with the configuration of fragments in physical space. The correlation results show that the correlation coefficients between the rest variables are less than 0.7, and the VIF values for the rest variables are less than 4, as displayed in . These findings indicate that multicollinearity is not a significant concern in the models, thereby enhancing their reliability.
Figure 6. (a) The Pearson correlation coefficients among the built environment indicators. (b) The Variance Inflation Factor (VIF) values for the built environment indicators.
5.2.1. Regression results in physical space
Based on the results of Model I (), the form indicators and betweenness centrality are all negatively associated with PHAF, which means that long roads with high street junction density and betweenness centrality reduce PHAF. In general, long roads characterized by high street junction density and betweenness centrality typically represent the main roads within urban centres, rather than those situated in peripheral areas. One plausible interpretation for this result is the notable concentration of diverse functions and services within urban centres. Within these central zones, individuals often find their needs satisfactorily fulfilled within a single Voronoi polygon, thereby reducing the necessity to traverse across multiple polygons. Nevertheless, it is also apparent that individuals may engage in significant mobility within a single Voronoi polygon, which suggests that the relationship between human activity fragmentation and the built environment is correlated with the spatial scale. Regarding the function indicators, it is noted that all regression coefficients exhibit a positive association with PHAF. In essence, the presence and proportion of these functions can contribute to the degree of physical fragmentation, especially for tourist attractions, institutions, transit, and lodging. These four indicators are typically closely linked to travellers and individuals at work, who frequently move between locations for sightseeing or daily work-related activities.
Table 6. Regression coefficients for Jilin province.
5.2.2. Regression results in cyber space
In terms of cyber space, the form indicators exhibit a consistent negative correlation with CHAF, as delineated in . Analogous to the regression findings observed in physical space, the long roads with high street junction density reduce CHAF. Typically, such roads are predominantly situated in urban centres rather than suburban areas, which are often surrounded by a variety of facilities like shopping malls or cinemas. Consequently, individuals on these main roads are more inclined to engage in physical activities rather than cyber activities. Regarding the function indicators, the results exhibit diversity: the shopping and transit indicators are insignificant, the life service and institution indicators are negatively correlated with CHAF. Conversely, the food, leisure, and tourist attraction indicators are positively correlated with CHAF. Among these function indicators, the leisure and tourist attraction indicators have the largest regression coefficients, suggesting that leisurely people are more willing to conduct cyber activities compared with those preoccupied with other engagements. In sum, compared to physical space, the number of significant indicators in cyber space is comparatively fewer, a trend that aligns with the previous study (Zhang et al. Citation2022).
As for physical fragmentation (the second and the third dimensions in physical space) and diversity of physical activities, the indicators are all significantly associated with CHAF, of which the configuration of fragmentation indicator in physical space has the highest regression coefficient. The significant influence of physical indicators on CHAF suggests that there exists a notable interaction between cyber and physical activity, which might manifest as a form of interaction between cyber and physical spaces (Castells Citation2020; Zook Citation2008).
5.2.3. Comparison between cyber and physical spaces
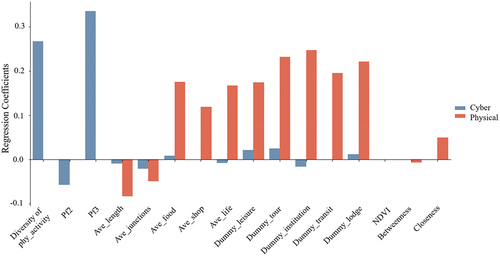
According to , the built environment had a stronger explanatory value for PHAF (R2 = 0.29) than CHAF (R2 = 0.25). Since some cyber activities are inspired by the surrounding built environment, such as recording beautiful sights, sharing interesting insights, and searching specific stores, these activities typically occur when individuals are situated in particular physical locations, such as tourist attractions or unfamiliar locations. Consequently, certain built environment indicators, like tourist attractions, indirectly influence cyber activities by influencing human mobility in physical space, which accounts for the relatively lower explanatory power of the built environment for CHAF. However, even for PHAF, the explanatory power remains comparatively lower compared to other studies examining built environments. The results might indicate that human activity fragmentation is not only attributable to the built environment but is also influenced by subjective factors such as individual choices, preferences, and demands. As depicted in , there exist additional disparities in the regression coefficients: relative to physical space, street junctions hold greater influence than the street length in cyber space; certain function and centrality indicators either lack significance or exhibit a negative correlation with CHAF; and all significant indicators in cyber space have smaller coefficients. Regarding the consistency between cyber and physical spaces, the most notable observation is the insignificance of NDVI in both spaces. Given that indicators such as Tourist attractions and Leisure areas, which also include greenness, exhibit significance in both spaces, we cannot conclude the lack of correlation between greenness and human activity fragmentation. On the contrary, the findings suggest that human activity fragmentation is more significantly influenced by distinctive and notable forms of greenness, such as scenic landscapes, rather than the ordinary greenness encountered along trajectories.
Figure 7. Regression coefficients for Models I and II. (Notes: All coefficients were standardized for cross-comparison, and variables that are not statistically significant are not presented in the figure.).
5.2.4. Model III and Model IV regression results
To delve deeper into the potential spatial disparities in the relationship between human activity fragmentation and the built environment, a series of OLS regression models were conducted using the nine administrative cities as distinct study areas ( and ). Firstly, according to , the ranking of internet users in each city correlates with population rankings derived from the Jilin Province census, thereby affirming the spatial representativeness of the datasets utilized in the study. From a holistic view, the explanatory power of every model in physical space surpasses the corresponding models in cyber space, consistent with the findings of Models I and II. Moreover, the number of significant variables also follows the same trend, with more significant built environment indicators observed in physical space compared to cyber space.
Figure 8. Regression coefficients for Model III (left) and Model V (right). (Notes: All coefficients were standardized for cross-comparison, and variables that are not statistically significant are not presented in the figure).
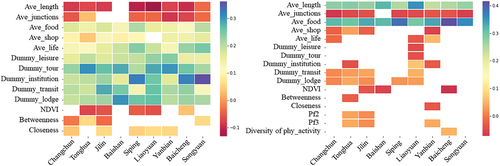
Table 7. The statistical descriptions for Model III (for PHAF) and Model IV (for CHAF).
Looking at the R2 values of the regression models from a localized perspective, the nine cities within Jilin Province exhibit varying rankings in cyber and physical spaces. For example, Changchun holds the fifth position based on the R2 of regression models in cyber space, while it ranks ninth based on the R2 of regression models in physical space. The inconsistency of the city’s rankings regarding R2 values across cyber and physical spaces implies spatial discrepancies in the explanatory power of the built environment on human activity fragmentation. Furthermore, the findings suggest the existence of additional factors influencing human activity fragmentation beyond those considered in this study. Moreover, variations are observed in the correlations between certain built environment indicators and fragmentation indicators across the nine cities. For instance, betweenness centrality exhibits a negative association with PHAF in Changchun, a positive association with PHAF in Tonghua, and no association with PHAF in Baishan. These differences in correlations across cities suggest that the impact of certain indicators on PHAF varies with changes in cities. Additionally, the types of significant indicators differ across cities, indicating that human activity fragmentation and its influencing factors are spatially heterogeneous. Regarding the crucial indicator, NDVI, two notable findings are observed. Firstly, irrespective of cities, NDVI demonstrates a negative influence on CHAF. This phenomenon might be attributed to the presence of green spaces in the physical environment, which redirects individuals’ focus towards tangible surroundings, consequently reducing their engagement in cyber activities and leading to decreased cyber human activity fragmentation. Secondly, within the context of two specific cities, Jilin and Baicheng, NDVI exhibits significance in both cyber and physical spaces. In the physical space, NDVI exhibits a negative influence on PHAF in Jilin, while it positively impacts PHAF in Baicheng. In cyber space, NDVI exhibits a negative influence in both cities. Jilin and Baicheng are two representative cities with varying degrees of urbanization. It is plausible that Baicheng’s ongoing urbanization has led to substantial land conversion for construction purposes, resulting in comparatively lower greenness within the city. Consequently, even routine green spaces along trajectories may attract attention and stay, thereby increasing PHAF.
6. Discussion and conclusion
Cyber space, shaped by ICTs, has emerged as a crucial place for communication and engagement with the world. Understanding the dynamics of human activities in cyber space is important for further exploring the new spatiality of cyber space and the complex interactions between cyber and physical spaces. This study delves into this issue by investigating fragmentation, a key characteristic of human activity, and its relationship with the built environment across different geographical locations. Based on CDR and HTTP URL data generated concurrently, we can also explore human activity fragmentation in cyber space, with physical space as the benchmark. Our findings are summarized as follows.
According to , the overall human activity fragmentation in cyber and physical spaces (i.e. CHAF and PHAF) is inversely distributed in space. This disparity suggests that cities situated in the southeast exhibit relatively higher average CHAF, while those in the northwest demonstrate higher average PHAF. One plausible explanation for this phenomenon is the variation in economic and technological development across these regions. Coastal cities tend to have more advanced economic and technological infrastructures compared to their northwest counterparts. Consequently, the widespread and mature adoption of ICTs in these areas likely facilitates cyber activities and potentially increases CHAF levels. Furthermore, our analysis reveals that CHAF exhibits a weaker correlation with the built environment compared to PHAF, consistent with findings from previous studies on visiting activities in cyber and physical spaces (Zhang et al. Citation2022). Similar to visiting activities, the small R2 of the regression model in cyber space may result from the indirect influence of certain built environment indicators on cyber activities. For instance, individuals typically use map services, such as Google Maps, only when navigating unfamiliar locations in physical space. Additionally, the findings presented in underscore the largest influence of the configuration of physical fragments on CHAF, confirming the existence of interactions between cyber and physical activity. Moreover, compared to the results observed in physical space, cyber space exhibits fewer significant variables and smaller regression coefficients for built environment indicators. This discrepancy may be attributed to the unique usage of cyber space, which transcends the traditional geographical constraints inherent in physical space. For instance, contemporary communication technologies like WeChat have revolutionized interpersonal interactions, making physical distances less consequential. Finally, the findings highlight the spatial heterogeneity in the correlations between built environment and fragmentation across the nine cities in Jilin Province, while the relationships between physical fragmentation indicators and CHAF is not influenced by geographical locations. For instance, the impact of the life service indicator on CHAF varies, exhibiting a negative association in Tonghua and a positive association in Liaoyuan. Conversely, the indicator representing the configuration of physical fragments consistently exhibits a positive correlation with CHAF across all nine cities. One plausible explanation for the consistent relationship between physical fragmentation indicators and CHAF across various cities is their intrinsic association as attributes of individuals. This relationship is likely more influenced by the individual’s sociodemographic characteristics, such as gender and occupation, rather than external environmental indicators (Ren and Kwan Citation2009).
Based on our findings, human activity fragmentation in cyber and physical spaces can be regarded as new features for characterizing and categorizing individuals. Individuals with different socio-economic statuses exhibit distinct orientations towards cyber space. For example, some individuals view cyber activities as substitutes for physical engagements, such as online communication and e-commerce, while others perceive them as indispensable tools for professional endeavours. These disparities in people’s perceptions and utilization of cyber space contribute to the significant divergence in human activity fragmentation between the two spaces. For instance, programmers typically exhibit higher levels of cyber human activity fragmentation compared to physical fragmentation, owing to the extensive website navigation required to solve code bugs. In contrast, real estate agents often display relatively higher levels of physical human activity fragmentation, resulting from the need to showcase multiple properties to prospective buyers until a suitable option is identified. Conversely, Uber drivers may demonstrate comparable fragmentation indicators in both spaces, as each new driving destination generates a corresponding cyber search record for navigation purposes. Moreover, the observed fragmentation patterns may also exhibit correlations with regional socio-economic disparities, as depicted in when projected onto a geographic map.
Moreover, our findings could also enlighten the future exploration of the association between cyber and physical spaces. As proposed by Liu et al. (Citation2022), cyber and physical spaces are interacting and communicating through people, thereby underscoring the significance of studying human activity in cyber space. As our findings indicate, the impact of built environment in physical space on cyber fragmentation is relatively minor compared to the impact of physical fragmentation. However, fragmentation is not the only characteristic of human activity, there are many other features whose relationships between cyber and physical spaces remain unclear, such as the frequency and spatial distribution of human activity. As stated by Salomon (Citation1986), there exist four different relationships between cyber and physical spaces: substitution, generation, modification, and neutrality. Additionally, the research conducted by Zhang et al. (Citation2022) suggested that cyber visiting activities exhibit stronger associations with landmarks, urban nodes, and main roads compared to physical visiting activities. Therefore, the relationships of other human activity characteristics may differ from fragmentation and require more exploration, which could also benefit the further investigation of cyber space.
Concerning the applicability of the proposed human activity fragmentation framework, it can be easily and widely applied to other public social media data as long as the utilized data includes essential components. Firstly, the data must have a temporal sequence, as the configuration of fragments in cyber space relies on establishing directed networks. Secondly, the data should capture human activity concurrently in both cyber and physical spaces to ensure comparability between the two spaces. Thirdly, the data should include geographic locations of physical activities for computing physical human activity fragmentation. Fourthly, our study employs website domains as proxies for geographic locations in cyber space. However, since cyber activities are not confined to browsing website domains, alternative data representing cyber activities, such as app usage, Twitter posts, and Weibo content, can serve as substitutes. For instance, geographic location in Twitter data can be used to compute physical fragmentation, while post content can be used to quantify cyber fragmentation. Assigning each post a keyword through semantic analysis allows treating posts with identical keywords as equivalent, similar to identical website domains in our study.
There are several limitations in our study that need further exploration in future research. Firstly, although POI, OpenStreetMap, and MODIS can reflect the surrounding built environment (Chen et al. Citation2019; Larkin et al. Citation2021; Mooney and Minghini Citation2017), the inclusion of emerging data sources, such as street images, could provide more detailed information for a comprehensive analysis (Wang and Vermeulen Citation2021). Secondly, the lack of a longer-term dataset might influence the robustness of the results. However, considering the high regularities of human behaviour (Leng, Santistevan, and Pentland Citation2021; Oliveira et al. Citation2016), fragmentation indicators calculated from one-day data are assumed sufficiently representative. Moreover, the increasing availability of cyber and physical data sources holds promise for addressing this limitation. Thirdly, future studies could explore cyber and physical spaces as an integrated entity using other effective methods such as discriminant analysis.
Authors’ contributions
LM processed the data, performed the analysis and drafted the manuscript. LX performed the collection of mobile phone data. LX and KM determined the direction of the study and revised the manuscript. All authors read and approved the final manuscript.
Availability of data and materials
The MODIS data can be obtained at https://lpdaac.usgs.gov/products/myd13q1v006/; the OpenstreetMap can be downloaded at http://download.geofabrik.de/asia/china.html#; the original POI data (point layers) and mobile phone data cannot be shared publicly due to restrictions.
Disclosure statement
No potential conflict of interest was reported by the author(s).
Additional information
Funding
References
- Adamic, L. A., R. M. Lukose, A. R. Puniyani, and B. A. Huberman. 2001. “Search in Power-Law Networks.” Physical Review E 64 (4): 046135. https://doi.org/10.1103/PhysRevE.64.046135.
- Alexander, B., C. Hubers, T. Schwanen, M. Dijst, and D. Ettema. 2011. “Anything, Anywhere, Anytime? Developing Indicators to Assess the Spatial and Temporal Fragmentation of Activities.” Environment and Planning B: Planning and Design 38 (4): 678–705. https://doi.org/10.1068/b35132.
- Ash, J. 2009. “Emerging Spatialities of the Screen: Video Games and the Reconfiguration of Spatial Awareness.” Environment & Planning A 41 (9): 2105–2124. https://doi.org/10.1068/a41250.
- Ash, J., R. Kitchin, and A. Leszczynski. 2015. “Digital turn, digital geography.” Social Science Research Network 2:1–26. https://doi.org/10.2139/ssrn.2674257.
- Bachi, R. 1963. “Standard Distance Measures and Related Methods for Spatial Analysis.” In Papers of the Regional Science Association, 83–132. USA: Springer. https://doi.org/10.1007/BF01934680.
- Ballantyne, P., A. Singleton, and L. Dolega. 2022. “Using Unstable Data from Mobile Phone Applications to Examine Recent Trajectories of Retail Centre Recovery.” Urban Informatics 1 (1): 21. https://doi.org/10.1007/s44212-022-00022-0.
- Batty, M. 1997. “Virtual Geography.” Futures 29 (4–5): 337–352. https://doi.org/10.1016/S0016-3287(97)00018-9.
- Boos, T. 2017. Inhabiting Cyberspace and Emerging Cyberplaces: The Case of Siena,Italy. USA: Springer.
- Castells, M. 2020. Space of Flows, Space of Places: Materials for a Theory of Urbanism in the Information Age in the City Reader. Routledge.
- Chen, E., Z. Ye, C. Wang, and W. Zhang. 2019. “Discovering the Spatio-Temporal Impacts of Built Environment on Metro Ridership Using Smart Card Data.” Cities 95:102359. https://doi.org/10.1016/j.cities.2019.05.028.
- Couclelis, H. 1998. “The New Field Workers.” Environment and Planning B: Planning and Design 25 (3): 321–323. https://doi.org/10.1068/b250321.
- Couclelis, H. 2003. “Housing and the New Geography of Accessibility in the Information Age.” Open House International 28 (4): 7–13.
- Couclelis, H. 2004. “Pizza Over the Internet: E-Commerce, the Fragmentation of Activity and the Tyranny of the Region.” Entrepreneurship & Regional Development 16 (1): 41–54. https://doi.org/10.1080/0898562042000205027.
- Didham, R. K., J. Ghazoul, N. E. Stork, and A. J. Davis. 1996. “Insects in Fragmented Forests: A Functional Approach.” Trends in Ecology & Evolution 11 (6): 255–260. https://doi.org/10.1016/0169-5347(96)20047-3.
- Dodge, M. 2001. “Cybergeography.” Environment and Planning B: Planning and Design 28 (1): 1–2. https://doi.org/10.1068/b2801ed.
- Etminani-Ghasrodashti, R., and M. Ardeshiri. 2015. “Modeling Travel Behavior by the Structural Relationships Between Lifestyle, Built Environment and Non-Working Trips.” Transportation Research Part A: Policy and Practice 78:506–518. https://doi.org/10.1016/j.tra.2015.06.016.
- Fagiolo, G. 2007. “Clustering in Complex Directed Networks.” Physical Review E 76 (2): 026107. https://doi.org/10.1103/PhysRevE.76.026107.
- Fahrig, L. 2019. “Habitat Fragmentation: A Long and Tangled Tale.” Global Ecology Biogeography 28 (1): 33–41. https://doi.org/10.1111/geb.12839.
- Gao, S., H. Chen, W. Luo, Y. Hu, and X. Ye. 2018. “Spatio-Temporal-Network Visualization for Exploring Human Movements and Interactions in Physical and Virtual Spaces.” In Human Dynamics Research in Smart and Connected Communities, Human Dynamics in Smart Cities, edited by S.-L. Shaw and D. Sui, 67–80. Cham: Springer International Publishing. https://doi.org/10.1007/978-3-319-73247-3_4.
- Hillier, B., and J. Hanson. 1989. The Social Logic of Space. UK: Cambridge University Press.
- Hubers, C., T. Schwanen, and M. Dijst. 2008. “ICT and Temporal Fragmentation of Activities: An Analytical Framework and Initial Empirical Findings.” Tijdschrift voor Economische en Sociale Geografie 99 (5): 528–546. https://doi.org/10.1111/j.1467-9663.2008.00490.x.
- Kwan, M.-P. 2001. “Cyberspatial Cognition and Individual Access to Information: The Behavioral Foundation of Cybergeography.” Environment and Planning B: Planning and Design 28 (1): 21–37. https://doi.org/10.1068/b2560.
- Kwan, M.-P. 2002. “Time, Information Technologies, and the Geographies of Everyday Life.” Urban Geography 23 (5): 471–482. https://doi.org/10.2747/0272-3638.23.5.471.
- Larkin, A., X. Gu, L. Chen, and P. Hystad. 2021. “Predicting Perceptions of the Built Environment Using GIS, Satellite and Street View Image Approaches.” Landscape and Urban Planning 216:104257. https://doi.org/10.1016/j.landurbplan.2021.104257.
- Leng, Y., D. Santistevan, and A. Pentland. 2021. “Understanding Collective Regularity in Human Mobility as a Familiar Stranger Phenomenon.” Scientific Reports 11 (1): 19444. https://doi.org/10.1038/s41598-021-98475-x.
- Lenz, B., and C. Nobis. 2007. “The Changing Allocation of Activities in Space and Time by the Use of ICT—“Fragmentation” as a New Concept and Empirical Results.” Transportation Research Part A: Policy and Practice 41 (2): 190–204. https://doi.org/10.1016/j.tra.2006.03.004.
- Li, X., Y. Li, T. Jia, L. Zhou, and I. H. Hijazi. 2022. “The Six Dimensions of Built Environment on Urban Vitality: Fusion Evidence from Multi-Source Data.” Cities 121:103482. https://doi.org/10.1016/j.cities.2021.103482.
- Liu, X., M. Chen, C. Claramunt, M. Batty, M.-P. Kwan, A. M. Senousi, T. Cheng, J. Strobl, C. Arzu, and J. Wilson. 2022. “Geographic Information Science in the Era of Geospatial Big Data: A Cyberspace Perspective.” The Innovation 3 (5): 100279. https://doi.org/10.1016/j.xinn.2022.100279.
- Lu, S., C. Shi, and X. Yang. 2019. “Impacts of Built Environment on Urban Vitality: Regression Analyses of Beijing and Chengdu, China.” International Journal of Environmental Research and Public Health 16 (23): 4592. https://doi.org/10.3390/ijerph16234592.
- Mooney, P., and M. Minghini. 2017. “A Review of OpenStreetMap Data.” In Mapping and the Citizen Sensor, 37–59. London: Ubiquity Press. https://doi.org/10.5334/bbf.c.
- Oliveira, E. M. R., A. C. Viana, C. Sarraute, J. Brea, and I. Alvarez-Hamelin. 2016. “On the Regularity of Human Mobility.” Pervasive and Mobile Computing 33:73–90. https://doi.org/10.1016/j.pmcj.2016.04.005.
- Pan, Y., S. Chen, S. Niu, Y. Ma, and K. Tang. 2020. “Investigating the Impacts of Built Environment on Traffic States Incorporating Spatial Heterogeneity.” Journal of Transport Geography 83:102663. https://doi.org/10.1016/j.jtrangeo.2020.102663.
- Pastor-Satorras, R., A. Vázquez, and A. Vespignani. 2001. “Dynamical and Correlation Properties of the Internet.” Physical Review Letters 87 (25): 258701. https://doi.org/10.1103/PhysRevLett.87.258701.
- Ren, F., and M.-P. Kwan. 2009. “The Impact of Geographic Context on E-Shopping Behavior.” Environment and Planning B: Planning and Design 36 (2): 262–278. https://doi.org/10.1068/b34014t.
- Rotem-Mindali, O., and I. Salomon. 2007. “The Impacts of E-Retail on the Choice of Shopping Trips and Delivery: Some Preliminary Findings.” Transportation Research Part A: Policy and Practice 41 (2): 176–189. https://doi.org/10.1016/j.tra.2006.02.007.
- Rutledge, D. T., 2003. “Landscape Indices As Measures of the Effects of Fragmentation: Can Pattern Reflect Process?”
- Salomon, I. 1986. “Telecommunications and Travel Relationships: A Review.” Transportation Research Part A: General 20 (3): 223–238. https://doi.org/10.1016/0191-2607(86)90096-8.
- Saxena, S., and P. L. Mokhtarian. 1997. “The Impact of Telecommuting on the Activity Spaces of Participants.” Geographical Analysis 29 (2): 124–144. https://doi.org/10.1111/j.1538-4632.1997.tb00952.x.
- Shaw, S.-L., and D. Sui. 2020. “Understanding the New Human Dynamics in Smart Spaces and Places: Toward a Splatial Framework.” Annals of the American Association of Geographers 110 (2): 339–348. https://doi.org/10.1080/24694452.2019.1631145.
- Shaw, S.-L., and H. Yu. 2009. “A GIS-Based Time-Geographic Approach of Studying Individual Activities and Interactions in a Hybrid Physical–Virtual Space.” Journal of Transport Geography 17 (2): 141–149. https://doi.org/10.1016/j.jtrangeo.2008.11.012.
- Wang, M., and F. Vermeulen. 2021. “Life Between Buildings from a Street View Image: What do Big Data Analytics Reveal About Neighbourhood Organisational Vitality?” Urban Studies 58 (15): 3118–3139. https://doi.org/10.1177/0042098020957198.
- Yang, Z., M. L. Franz, S. Zhu, J. Mahmoudi, A. Nasri, and L. Zhang. 2018. “Analysis of Washington, DC Taxi Demand Using GPS and Land-Use Data.” Journal of Transport Geography 66:35–44. https://doi.org/10.1016/j.jtrangeo.2017.10.021.
- Ye, Y., D. Li, and X. Liu. 2018. “How Block Density and Typology Affect Urban Vitality: An Exploratory Analysis in Shenzhen, China.” Urban Geography 39 (4): 631–652. https://doi.org/10.1080/02723638.2017.1381536.
- Yin, J., and G. Chi. 2022. “A Tale of Three Cities: Uncovering Human-Urban Interactions with Geographic-Context Aware Social Media Data.” Urban Informatics 1 (1): 20. https://doi.org/10.1007/s44212-022-00020-2.
- Yue, Y., Y. Zhuang, A. G. Yeh, J.-Y. Xie, C.-L. Ma, and Q.-Q. Li. 2017. “Measurements of POI-Based Mixed Use and Their Relationships with Neighbourhood Vibrancy.” International Journal of Geographical Information Science 31 (4): 658–675. https://doi.org/10.1080/13658816.2016.1220561.
- Yu, Z., and X. Liu. 2021. “Urban Agglomeration Economies and Their Relationships to Built Environment and Socio-Demographic Characteristics in Hong Kong.” Habitat International 117:102417. https://doi.org/10.1016/j.habitatint.2021.102417.
- Zhang, Y., Y. Li, E. Zhang, and Y. Long. 2022. “Revealing Virtual Visiting Preference: Differentiating Virtual and Physical Space with Massive TikTok Records in Beijing.” Cities 130:103983. https://doi.org/10.1016/j.cities.2022.103983.
- Zhao, Z.-D., Z.-G. Huang, L. Huang, H. Liu, and Y.-C. Lai. 2014. “Scaling and Correlation of Human Movements in Cyberspace and Physical Space.” Physical Review E 90 (5): 050802. https://doi.org/10.1103/PhysRevE.90.050802.
- Zheng, Z., and S. Zhou. 2017. “Scaling Laws of Spatial Visitation Frequency: Applications for Trip Frequency Prediction.” Computers, Environment and Urban Systems 64:332–343. https://doi.org/10.1016/j.compenvurbsys.2017.04.004.
- Zook, M. 2008. The Geography of the Internet Industry: Venture Capital, Dot-Coms, and Local Knowledge. USA: John Wiley & Sons.