
ABSTRACT
Biomarkers in population health research serve as indicators of incremental physiological deterioration and contribute to our understanding of mechanisms through which social disparities in health unfold over time. Yet, few population-based studies incorporate biomarkers of aging in early midlife, when disease risks may emerge and progress across the life course. We describe the distributions of several biomarkers of inflammation and neurodegeneration and their variation by sociodemographic characteristics using blood samples collected during Wave V of the National Longitudinal Study of Adolescent to Adult Health (ages 33–44 years). Higher mean levels of inflammatory and neurodegenerative biomarkers were associated with greater socioeconomic disadvantage. For example, the neurodegenerative markers, Neurofilament Light Chain and total Tau proteins were higher among lower income groups, though the relationship was not statistically significant. Similarly, proinflammatory marker Tumor Necrosis Factor-α (TNF-α) levels were higher among those with lower education. Significant differences in the mean levels of other proinflammatory markers were observed by race/ethnicity, sex, census region, BMI, and smoking status. These descriptive findings indicate that disparities in biomarkers associated with aging are already evident among young adults in their 30s and attention should focus on age-related disease risk earlier in the life course.
Introduction
Biomarkers in population-based studies can serve as sentinels of incremental physiological deterioration, identifying populations at higher risk of future adverse health outcomes before the onset of morbidity (Harris and Schorpp Citation2018). These physiological measures of health may also contribute to understanding the biological underpinnings of social disparities in health (Bagby et al. Citation2019; Harris and McDade Citation2018). For example, elevated inflammatory markers may indicate low-level chronic inflammation in response to persistent exposure to stress, often experienced disproportionately by marginalized and economically disadvantaged populations (Hatch and Dohrenwend Citation2007; Muscatell, Brosso, and Humphreys Citation2020). Similarly, elevated markers of neurocognitive damage may indicate accelerated cognitive aging and increased risk of cognitive decline (Hansson Citation2021). These biomarkers have been shown to be associated with an increased risk of age-related diseases and may ultimately increase age-specific mortality (Michaud et al. Citation2013; Rübsamen et al. Citation2021). Thus, immune system dysfunction and central nervous system deterioration may be important mechanisms for creating and sustaining well-documented health disparities in outcomes such as cancers (Grivennikov, Greten, and Karin Citation2010), cardiovascular disease (CVD) (Savoia and Schiffrin Citation2006; Willerson and Ridker Citation2004), and Alzheimer’s disease and related dementias (ADRD) (Stebbins et al. Citation2021; Walker, Ficek, and Westbrook Citation2019). We measure the circulating levels of various biomarkers of aging that range from innate peripheral immune to neurological health markers in a nationally representative sample of adults in their 30s and examine disparities by sociodemographic characteristics to inform future research into potential mechanisms through which social, psychological, and environmental factors are associated with life course health.
The majority of representative studies examining multiple biomarkers in human populations have focused on middle or older ages (Chen et al. Citation2019; Ikram et al. Citation2017; McDade Citation2011; Ryff, Seeman, and Weinstein Citation2019; Suzman Citation2009). These studies have shown that inflammatory biomarkers change significantly with increasing chronological age (Pawelec, Goldeck, and Derhovanessian Citation2014) and tend to vary by social and demographic characteristics, such as socioeconomic status and race and ethnicity (Dowd, Zajacova, and Aiello Citation2010; Muscatell, Brosso, and Humphreys Citation2020). While these studies have contributed to the body of knowledge on biomarkers of disease risk in older age groups, we do not know if these same trends are evident in younger adult populations. The fourth decade of life, when young people move through their 30s, is an often ignored, but critically important, life stage for understanding health trajectories across the life course. Early midlife adults are thought to be in their healthy years of life, with little chronic disease or disability. However, increasing research suggests that younger adult health has been declining in the era of obesity and opioid epidemics (National Academies of Sciences, E., and Medicine Citation2021). In addition, some chronic conditions, such as hypertension, diabetes, and inflammation, are asymptomatic, especially among adults who are not in workplaces with regular screenings or do not receive regular physical health checkups (Bucholz, Gooding, and de Ferranti Citation2018; Everett and Zajacova Citation2015; Gooding et al. Citation2014). Thus, biomarker measurements in early midlife are extremely valuable for understanding social patterns in the development of disease risks in the aging process and identifying possible interventions before permanent physiological damage occurs (Liu et al. Citation2017). Our research fills this gap regarding the early adult life precursors to the onset of disease.
Immune dysfunction has been associated with many age-related declines and diseases, ranging from CVD to cognitive decline and dementia (Aiello et al. Citation2006; Soysal et al. Citation2020; Stebbins et al. Citation2021). Within the immune system, cytokines are part of a complex cascade of molecules activated during a local and systemic inflammatory response designed to destroy pathogens and activate tissue repair processes (Bruunsgaard, Pedersen, and Pedersen Citation2001). Cytokine levels are associated with risk for chronic health outcomes including CVD (Ferrucci and Fabbri Citation2018; Furman et al. Citation2019) and AD/ADRD (Heneka, Kummer, and Latz Citation2014; Rubio-Perez and Morillas-Ruiz Citation2012). Further, C-reactive protein (CRP) is secreted in response to inflammatory cytokines and is indicative of an increased inflammatory state (Du Clos Citation2000). CRP is related to CVD risk (Casas et al. Citation2008; Danesh et al. Citation2004) but inconsistently associated with AD/ADRD (Engelhart et al. Citation2004; Locascio et al. Citation2008; Ravaglia et al. Citation2007; Teunissen et al. Citation2003). Neurological biomarkers have also been studied extensively to document cognitive decline in aging research (Hansson Citation2021; Shaw et al. Citation2007). Neurofilament Light Chain (NfL) and Tau proteins are considered to be promising biomarkers of the progression of neurodegenerative diseases (de Wolf et al. Citation2020; Khalil et al. Citation2020; Pase et al. Citation2019; Zetterberg Citation2019). Tau proteins are implicated in damaging neuropathological processes such as the formation of neurofibrillary tangles and amyloid beta plaques (Hansson Citation2021). NfL proteins are released in response to neuro-axonal damage (Khalil et al. Citation2020). Tau and NfL have been primarily measured in older age given their close relationship to AD/ADRD pathology or brain injury. Few studies examine neurodegenerative biomarkers in younger aged populations, but early cognitive decline may be captured by these biomarkers in young adults, signaling the onset of neuropathology before clinical disease is manifest.
To address these gaps in our understanding of the early life course onset of inflammatory and neurodegenerative disease risks and the origins of key social and economic disparities in markers of disease risk, we provide a descriptive overview of the distribution and variation in biomarkers of inflammation and neurodegeneration in the National Longitudinal Study of Adolescent to Adult Health (Add Health) using data from Wave V when the cohort was moving through their 30s and nearing midlife at ages 33–44 years. Findings will provide researchers with much-needed information on physiological indicators of health risk in a diverse, nationally representative population before the onset of chronic health symptomology.
Materials and Methods
Study Design and Population
Add Health is an ongoing longitudinal, nationally representative cohort study that has been following participants since the 1994–1995 school year. Add Health used a school-based design where adolescents were sampled from school rosters for an in-home interview in 1994–95 and followed from adolescence through adulthood with five in-home interviews. Full sampling details have been published elsewhere (Harris et al. Citation2019). Wave V (WV) was conducted in 2016–2018 using a mixed-mode survey of in-person and web/mail surveys. All Add Health Wave I respondents who were still living in the United States at the time of WV data collection were eligible for participation. WV nonrespondents were randomly sampled for an in-person non-response follow-up (NRFU) interview resulting in a total sample of 12,300 participants. We use data from Waves I and V in the current study.
All WV survey participants were invited to complete a separate in-person “biovisit” to provide a blood sample and other physical measurements. WV participants who consented to the biovisit (N = 7,995) were contacted to schedule an in-home visit with a trained phlebotomist. The study was able to schedule visits for 5,381 participants. The blood draw failed for 71 people, the exam stopped prior to the blood draw for 23, and 347 refused. Among the remaining 4,940 people, 125 blood samples were not viable (e.g., insufficient quantity, shipping issues, etc.), and 102 were missing the region stratifying variable and were excluded from analysis and leaving a final analytic sample of 4,713 unique individuals with biomarker data. The exact number of viable assay results for each of the biomarkers varied, ranging from 3,221 for IL-1β to 4,713 for IL-8 (see full details in ). Sampling weights for this biovisit subsample were derived to make results generalizable to the target population of adolescents in grades 7–12 in the USA in 1994–95 who have been followed over time to 2016–18 (Chen and Harris Citation2020).
Measurement
Biomarker Serum Concentrations
Five inflammatory cytokines were analyzed: IL-1β, 6, 8, 10, and TNF-α. All markers except IL-10 are proinflammatory and increase with age, while IL-10 is anti-inflammatory and decreases with aging (Singh and Newman Citation2011). Given the potential relevance of the balance of pro- and anti-inflammatory biomarkers (Dhabhar et al. Citation2009), we calculated a ratio of IL-6:IL-10, where a higher value indicates relatively higher inflammation. High sensitivity C-reactive protein (hsCRP) was also included as a measure of inflammation. NfL and Tau proteins are biomarkers of neurocognitive damage. All units are pg/mL except for hsCRP (mg/L). Additional details on laboratory assays and quality control measures are provided in the user guides (Whitsel et al. Citation2022a, Citation2022b forthcoming). Given distributions of biomarkers were right-skewed and ICC estimates increased, values were log-transformed for analysis.
Social, Demographic, and Health Variables
Sociodemographic variables were based on the survey responses at WV. If sociodemographic data were missing, data from previous waves was used if reasonably appropriate (see supplementary material for details). Self-reported variables include sex assigned at birth (male vs. female), nativity (foreign-born vs. native-born), WV region (West, Midwest, Northeast, South), WV educational attainment (high-school diploma/GED or lower, some college and/or technical training, and college degree or higher), and WV household income (<$25,000, $25,000–$49,999, $50,000-$99,999, ≥$100,000). A dichotomous age variable was calculated based on the weighted median age (by quarter year) in the entire WV sample.
Race/ethnicity was constructed based on self-selection from a list of options in the WV survey. Participants who chose more than one option were also asked to select one with which they most strongly identified. Respondents were placed into the category they selected or the category they most strongly identified with if they selected more than one. If they did not answer the question in WV, their race/ethnicity from Wave I was used. Final categories included “Asian,” “Black, African American,” “Hispanic,” and “White.” The “Native American/Alaska Native,” “Some other race or origin,” and “Pacific Islander” categories were excluded due to small sample sizes.
We included WV Body Mass Index (BMI) as a proxy measure of chronic disease risk (Global Burden of Disease Obesity Collaborators Citation2017) based on measured weight and height and calculated as weight (kg)/height (m)2. To enhance comparability across other studies, we categorized BMI as normal (<25 kg/m2), overweight (25–30 kg/m2), and obese (>30 kg/m2) based on common clinical cut points (Centers for Disease Control and Prevention Citation2022). Because the literature has demonstrated consistent associations between BMI and disease risk measured by these biomarkers (Rodríguez-Hernández et al. Citation2013), we expect similar associations in early midlife adults. We include WV smoking status (never, past, and current) as a measure of health behavior.
Statistical Methods
We first described the nationally representative distribution of biomarker values in early midlife adults in the U.S., weighted to account for the survey design. We then estimated population means and 95% confidence intervals (CI) for the biomarker serum concentrations stratified by sociodemographic variables. We use Analysis of Variance (ANOVA) to statistically compare the means of different sociodemographic groups given the variability in the data. To visualize these differences, stratified boxplots were created for each biomarker. IL-1β was the only marker with a high proportion (31.0%) of left-censoring at the limit of detection (LOD = 0.01 pg/mL). To account for this, Tobit regressions were used to estimate the overall and stratified population means, 95% CIs, and the probability of obtaining different means due to random chance (Long Citation1997; Tobin Citation1958). For these analyses, the IL-1β values extrapolated by LCBR below the LOD were also considered censored. A value of LOD/2 was imputed for left-censored values when creating boxplots and calculating percentile values. To account for multiple statistical tests, Holm’s step-down procedure was applied, resulting in a threshold of 0.0013 (Holm Citation1979). All statistical analyses were performed using SAS 9.4 except for Tobit regressions, which were estimated in StataSE 17 to properly account for sampling weights. Figures were produced using R version 3.5.1.
Several sensitivity analyses were performed including examination of basic confounding by age, sex assigned at birth, and presence of an inflammatory condition. Details can be found in the supplementary material.
Results
Weighted descriptive statistics for the study sample are shown in . Most participants were White (70.5%). A third (33.5%) of participants had an annual household income between $50,000–$99,999 and 32.2% made more than $100,000 per year. Almost half (46.9%) were classified as obese. The sample is split evenly by sex, and 41.5% had attained a college degree or higher. Most participants rated their health as good, very good, or excellent (85.6%), and self-reported diagnosis of heart disease, cancer, stroke, and chronic kidney disease was low (<2.5%), which is expected in this age group (Table S2).
Table 1. Weighted descriptive statistics for study sample, Add Health Wave V biosample (N = 4713).
Overall summary statistics for each biomarker are in . The log-transformed means and 95% CIs for the inflammatory biomarkers stratified by sociodemographic variables are shown in and the neurocognitive biomarkers in . The stratified means for IL-6 and IL-10 separately are in supplementary Table S6. The least-squares means adjusted for age, sex, and inflammatory condition are shown in supplementary Tables S4a and S5a. We found the most noticeable gradients by sociodemographic categories for the pro-inflammatory markers (e.g., hsCRP, IL-6, and IL-6/IL-10). Differences tended to be the most pronounced by BMI, smoking status, and race/ethnicity, though it varied by biomarker.
Table 2. Weighted distributions of inflammatory and neurodegenerative biomarkers, Add Health Wave V biosample (N = 4713).
Table 3. Weighted, log-transformed means and standard errors of inflammatory biomarkers by sociodemographic variables, Add Health Wave V biosample(N = 4713).
Table 4. Weighted, log-transformed means and standard errors of neurodegenerative biomarkers by sociodemographic variables, Add Health Wave V biosample (N = 4713).
Biomarker Distributions by Demographic Characteristics
No clear overall pattern emerged by age categories, but there were significant differences in both directions. Those older than the median age had significantly higher NfL (0.10 pg/mL, 95%CI: 0.06, 0.14), but lower IL-8 compared to those younger. Females had higher IL-6/IL-10 and hsCRP, but lower mean levels of TNF-α compared to men.
Foreign-born participants consistently had lower average levels of all biomarkers, particularly for IL-8, hsCRP, and NfL, though these differences were not statistically significant at the adjusted alpha level (). Living in the West was associated with the lowest IL-1β, IL-6, IL-8, and hsCRP levels, while the South had the highest average IL-1β (e.g. µSouth-µWest = 0.41, 95%CI: 0.19, 0.62) and hsCRP levels. The Midwest had the highest mean levels of IL-6/IL-10, TNF-α, NfL and Tau.
The Asian racial/ethnic group had comparatively lower proinflammatory biomarker levels. Those identifying as White had higher mean levels of IL-10, IL-8, TNF-α, and NfL. For instance, average IL-8 was 0.29 pg/mL higher among White vs. Asian participants (95% CI: 0.13, 0.45). Those who identified as Black, African American had the highest average proinflammatory levels of IL-1β, IL-6, IL-6/IL-10 ratio, and hsCRP. Those who identified as Hispanic had the lowest mean levels of NfL and total Tau.
Biomarker Distributions by Socioeconomic Status
Higher education was generally associated with lower levels of circulating proinflammatory biomarkers, particularly for IL6/IL10 and hsCRP. There was no significant difference in mean levels of IL-8 by education (p = 0.91). Those with the lowest level of education had higher measures of NfL and Tau, but differences were not significant at the adjusted alpha level (NfL: p = 0.02, Tau: p = 0.35). Average biomarker levels by household income categories showed a similar but less consistent relationship. For example, those with the lowest income (<$25,000/year) had, on average, a 0.45 pg/mL higher IL-6/IL-10 ratio (95% CI: 0.34,0.56) than those in the highest income category (≥$100,000/year). Those with higher household income also had lower levels of IL-1β, TNF-α, hsCRP, and Tau. Those in the lowest income category had the highest levels of IL-10, an anti-inflammatory marker (). There was a less clear relationship for NfL; the highest levels of NfL were among those in the lowest and highest income categories ().
Biomarkers Distributions by BMI
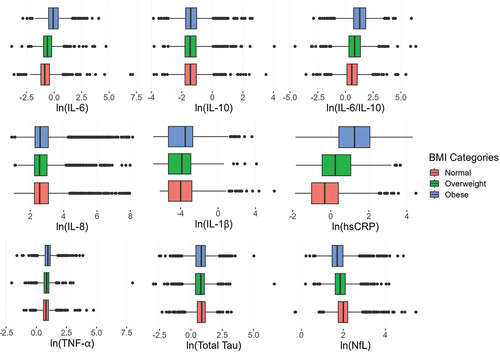
Those in higher BMI categories had higher levels of proinflammatory cytokines in most cases and lower levels of NFL and Tau (). There are differences in the distributions by BMI category for pro-inflammatory (TNF-α, IL-6, hsCRP, and the IL-6/IL-10) markers. As BMI increases, biomarker levels shift upward, with the highest levels among those who classified as obese (). For example, average hsCRP was 1.33 mg/L units higher in obese participants compared to normal BMI participants (95% CI: 1.22, 1.45). Contrary to other proinflammatory biomarkers, the levels of IL-8 were highest among those classified as having normal BMI. The distributions of NfL are shifted downwards as BMI increases (µnormal-µobese = 0.28,95%CI: 0.23, 0.32), and the lowest mean serum concentration of total Tau was among those who were overweight (µnormal-µoverweight = 0.12, 95%CI: 0.06, 0.18).
Figure 1. Distribution of inflammatory and cognitive biomarkers by BMI categories, add health wave V biosample, N = 4713.
Biomarker Distributions by Smoking Status
Current smokers had the highest average concentrations of proinflammatory and neurodegenerative biomarkers. For all markers except hsCRP and NfL, never-smokers had the lowest mean levels (). For instance, total Tau was 0.11 pg/mL higher in current smokers compared to never-smokers (95%CI: 0.04, 0.18).
The observed patterns remained in sensitivity analyses controlling for age, sex assigned at birth and inflammatory conditions (Table S4a and S5a). After controlling for covariates, associations were still generally the strongest for BMI, smoking status, and race/ethnicity (Table S4b and S5b). Boxplots for each remaining biomarker, stratified by social and demographic variables, are presented in the Supplementary Material.
Discussion
Add Health provides biosocial data on a US-representative cohort progressing from adolescence through young- to early mid-adulthood. The addition of serum inflammatory and neurodegenerative biomarkers in WV provides researchers with valuable new data to understand how inflammatory and neurodegenerative disease risks are related to social and environmental factors as the cohort moved through their 30s. In this paper, we describe the distributions of a variety of circulating inflammatory and cognitive biomarkers and how these distributions vary by sociodemographic characteristics. Our descriptive results suggest that there are apparent and statistical differences in the distributions of these biomarkers by sociodemographic characteristics, especially for IL-6, IL-6/IL-10, hsCRP, and TNF-α. Increased levels of proinflammatory markers were associated with higher BMI, lower household income, and lower educational attainment. Higher levels of total Tau and NfL were observed with many sociodemographic and health characteristics including race/ethnicity, low income, BMI, and current smoking. There was no significant relationship between neurodegenerative markers and educational attainment, but those with lower education had higher serum NfL. NfL also appeared to be higher for the oldest age group, supporting the notion that NfL-related neuropathological changes may begin to appear in early midlife. These results persisted after controlling for basic confounders in sensitivity analyses.
While inflammatory and cognitive blood-based biomarker data are rare in younger adult populations, our results show some similarities with other large, nationally representative samples. The average serum hsCRP from the 2017–2018 National Health and Nutrition Examination Survey (NHANES) was similar (3.46 mg/L vs. 3.83 mg/L in Add Health). The 2016 Venous Blood Study (VBS) of the Health and Retirement Study (HRS) included mean serum levels of hsCRP (4.95 mg/L), IL-6 (8.67 pg/mL), TNF- α, and IL-10 (4.06 pg/mL) and found generally higher mean values compared to the Add Health WV Biosample. These differences are expected given inflammation generally increases with age (Michaud et al. Citation2013). HRS VBS is a much older study population (age 55+) and NHANES includes a much wider age range, while our sample is restricted to ages 33–44 years. It is surprising that mean levels of IL-10 were much higher in HRS compared to Add Health (4.06 pg/mL vs. 0.35 pg/mL), given it is an anti-inflammatory cytokine. This may provide evidence that the relative balance of pro- and anti-inflammatory cytokines is more important or that a more aged immune system is one that has less control over cytokine production. Alternatively, it is possible that selection related to age at study start in Add Health results in a healthier older population who have biomarkers that are more similar or even healthier than some younger age groups.
There are limited analogous data with which to compare the cognitive biomarkers, especially in younger age populations. The Rotterdam Study tested plasma concentrations of total Tau (mean: 2.6) in a population-based cohort of non-demented participants sampled suburban Netherlands (de Wolf et al. Citation2020). The average total tau plasma concentration was similar to our Add Health sample, but the variation was smaller. Again, the differences could be attributed to age differences between the samples (Rotterdam mean age = 71.9 years) or there may be other contributing factors such as different target populations or laboratory measurement methods. An example of serum concentrations of NfL comes from a subset of participants 60 years or older in another European population-based cohort (Khalil et al. Citation2020; Koini et al. Citation2021). These participants had a higher average serum concentration of NfL (32.30 pg/mL) compared to our sample and demonstrated evidence of increases in serum NfL as participants aged. A subsample of participants 65 years and older in the Chicago Health and Aging Project (N = 1327) demonstrated higher serum concentrations of NfL (mean: 25.7 pg/mL). Conversely, this sample had a lower Tau levels (mean: 0.40 pg/mL) compared to the Add Health WV Biosample (Rajan et al. Citation2020). Of note, these other studies were not US-representative population-based samples. Further, there is no standardized collection nor measurement protocol used by population studies, making comparisons difficult.
Gradients were typically in the expected direction for proinflammatory markers. For example, the distributions of hsCRP, IL-6, and IL-6/IL-10 were elevated in the overweight category and highest among obese persons. However, IL-8 was highest among those with normal BMI and lowest among the overweight group. This relationship remained even after a sensitivity analysis in which we controlled for continuous age, sex, and recent inflammatory conditions/medications. IL-10 is an anti-inflammatory marker, so we may have expected to see higher levels with younger age, increasing social privilege or improving health metrics, but this was not always the case. For example, those with the lowest household income had the highest mean level of IL-10 even after covariate adjustment. These results are purely descriptive, but this may suggest that the ratio of the pro-inflammatory to anti-inflammatory is a better indicator of systemic inflammation.
Differences in neurodegenerative markers by BMI were in the opposite direction of our expectations. Those with normal BMI had the highest mean level of serum NfL and total Tau concentrations. Importantly, biomarker differences do not control for other covariates, but some smaller studies have supported the notion that higher BMI may be correlated with lower NFL levels (Beydoun et al. Citation2013; Rebelos et al. Citation2022). Thus, these findings warrant more investigation into possible biological mechanisms of NfL and Tau, particularly among younger ages. Of note, sensitivity analyses still found these unexpected relationships between BMI and the two neurocognitive biomarkers persisted after controlling for age, sex, inflammatory conditions, and past head/neck injury.
We observed gradients in the expected direction by socioeconomic indicators (Figure S5-S6) for the proinflammatory cytokines IL-1β, IL-6, IL-6:IL-10, TNF-α, and hsCRP (i.e. inverse relationships) but not for all biomarkers. It is possible that there may be non-linear relationships, such as a threshold effect, at this point in the life course. For example, mean NfL and Tau values by household income categories were similar except the lowest income category, which had a higher value. Individuals with the lowest household income exhibit higher levels of neurodegeneration, indicating an increased risk for dementia.
There were some small differences by race/ethnicity for IL-6, IL-6/IL-10, hsCRP, total Tau, and NfL. Proinflammatory markers were typically lowest among those identifying as Asian and highest among those identifying as Black/African American. Because race is a social construct and there is a large body of literature demonstrating racial disparities in the experience of psychosocial stressors such as poverty, discrimination, and structural oppression (Bailey et al. Citation2017; Williams, Lawrence, and Davis Citation2019), the higher levels that were observed among Black/African American participants may be attributed to factors associated with structural racism. Further studies measuring structural racism and psychosocial pathways among black participants are needed. In contrast to the increased levels of several pro-inflammatory markers, serum NfL levels were lower among those identifying as Black/African American and Hispanic compared to those identifying as White and Asian. There is a dearth of research on NfL across racial/ethnic populations (and as stated above, among young adults). More research on whether these demographic patterns are persistent into older age is warranted. One possibility is differences in the risk of traumatic brain injuries, which are associated with increased serum NfL (Khalil et al. Citation2018). In our sample, the weighted proportion of participants who reported ever having a head or neck injury was higher among those identifying as white (26%) compared to other racial/ethnic groups (13–17%). The prevalence of obesity was also higher among those identifying as Black, African American, and Hispanic, and our analyses demonstrated those classified as obese had lower mean NfL levels. Sensitivity analyses examining differences in NfL by race/ethnicity controlling for head/neck injury and BMI showed differences were attenuated but remained.
Our study has several limitations. First, we encountered measurement constraints with left-censored data for IL-1β, which we addressed using Tobit regressions. Additionally, the WV Biosample used in our study represents only a subset of the Wave V participants. To address this limitation and enhance the generalizability of our findings, we applied appropriate weights to the observations, making them representative of the original Wave I nationally representative sample of adolescents in grades 7–12 during the 1994–95 school year. Furthermore, several of the biomarkers included in our study have not been extensively tested in this age range. Consequently, we lack well-established benchmarks or reference values against which to directly compare our measurements. Despite this limitation, continued monitoring of these biomarkers in representative and diverse samples such as Add Health is required to establish if these differences continue later in life and if they are associated with incident chronic disease and early emergence of health disparities.
In conclusion, we identified relatively early and emerging disparities in a range of key biomarkers of health in the Add Health study. Our findings suggest that research on how social and psychosocial exposures affect inflammatory and cognitive age-related processes should begin at much younger ages than what is commonly observed in the literature. Indeed, most studies on biomarkers of aging have focused on populations aged 45 years and older. Yet, even as young adults move through their 30s, there are differences in indicators of inflammation and neurodegeneration. Aging is an ongoing, lifelong process that should be studied across the life course to understand the processes of healthy aging and disease progression. Many of the chronic diseases of major public health concern such as cardiovascular diseases, cancer, and dementia have complex etiologies that are believed to unfold over years, if not decades. Moreover, the large level of selection into older age cohorts because of survival biases may mask associations with sociodemographic characteristics. Therefore, studying biomarkers in younger adult populations provides a window for understanding pathophysiology of aging diseases before the onset of clinical symptoms and can identify social and demographic groups most at risk.
Supplemental Material
Download MS Word (3.4 MB)Disclosure statement
No potential conflict of interest was reported by the author(s).
Supplementary material
Supplemental data for this article can be accessed online at https://doi.org/10.1080/19485565.2024.2334687
Additional information
Funding
References
- Aiello, A. E., M. N. Haan, L. Blythe, K. Moore, J. M. Gonzalez, and W. Jagust. 2006. The influence of latent viral infection on rate of cognitive decline over 4 years. Journal of the American Geriatrics Society 54 (7) (July 1):1046–54. doi:10.1111/j.1532-5415.2006.00796.x.
- Bagby, S. P., D. Martin, S. T. Chung, and N. Rajapakse. 2019. From the outside In: Biological mechanisms linking social and environmental exposures to chronic disease and to health disparities. American Journal of Public Health 109 (S1) (January 1):S56–63. doi:10.2105/AJPH.2018.304864.
- Bailey, Z. D., N. Krieger, M. Agénor, J. Graves, N. Linos, and M. T. Bassett. 2017. Structural racism and health inequities in the USA: Evidence and interventions. Lancet 389 (10077) (April 8):1453–63. doi:10.1016/S0140-6736(17)30569-X.
- Beydoun, M. A., H. A. Beydoun, M. R. Shroff, M. H. Kitner-Triolo, and A. B. Zonderman. 2013. Helicobacter Pylori seropositivity and cognitive performance among US adults: Evidence from a large national survey. Psychosomatic Medicine 75 (5):486–96. doi:10.1097/PSY.0b013e31829108c3.
- Bruunsgaard, H., M. Pedersen, and B. K. Pedersen. 2001. Aging and proinflammatory cytokines. Current Opinion in Hematology 8 (3):131–36. doi:10.1097/00062752-200105000-00001.
- Bucholz, E. M., H. C. Gooding, and S. D. de Ferranti. 2018. Awareness of cardiovascular risk factors in U.S. Young adults aged 18–39 years. American Journal of Preventive Medicine 54 (4) (April 1):e67–77. doi:10.1016/j.amepre.2018.01.022.
- Casas, J. P., T. Shah, A. D. Hingorani, J. Danesh, and M. B. Pepys. 2008. C-Reactive protein and coronary heart disease: A critical review. Journal of Internal Medicine 264 (4) (October 1):295–314. doi:10.1111/j.1365-2796.2008.02015.x.
- Centers for Disease Control and Prevention. 2022. Defining Adult Overweight & Obesity | Overweight & Obesity | CDC. https://www.cdc.gov/obesity/basics/adult-defining.html.
- Chen, X., E. Crimmins, P. (Perry) Hu, J. K. Kim, Q. Meng, J. Strauss, Y. Wang, J. Zeng, Y. Zhang, and Y. Zhao. 2019. Venous blood-based biomarkers in the china health and retirement longitudinal study: Rationale, design, and results from the 2015 wave. American Journal of Epidemiology 188 (11) (November 1):1871–77. doi:10.1093/aje/kwz170.
- Chen, P., and K. M. Harris. 2020. Construction of wave V biomarker weight.
- Danesh, J., J. G. Wheeler, G. M. Hirschfield, S. Eda, G. Eiriksdottir, A. Rumley, G. D. O. Lowe, M. B. Pepys, and V. Gudnason. 2004. C-Reactive protein and other circulating markers of inflammation in the prediction of coronary heart disease. New England Journal of Medicine 350 (14) (April 1):1387–97. doi:10.1056/NEJMoa032804.
- de Wolf, F., M. Ghanbari, S. Licher, K. McRae-McKee, L. Gras, G. J. Weverling, P. Wermeling, S. Sedaghat, M. K. Ikram, and R. Waziry. 2020. Plasma tau, neurofilament light chain and amyloid-β levels and risk of dementia; a population-based cohort study. Brain A Journal of Neurology 143 (4):1220–32. doi:10.1093/brain/awaa054.
- Dhabhar, F. S., H. M. Burke, E. S. Epel, S. H. Mellon, R. Rosser, V. I. Reus, and O. M. Wolkowitz. 2009. Low serum IL-10 concentrations and loss of regulatory association between IL-6 and IL-10 in adults with major depression. Journal of Psychiatric Research 43 (11):962–69. doi:10.1016/j.jpsychires.2009.05.010.
- Dowd, J. B., A. Zajacova, and A. E. Aiello. 2010. Predictors of inflammation in U.S. Children aged 3–16 years. American Journal of Preventive Medicine 39 (4) (October 1):314–20. doi:10.1016/j.amepre.2010.05.014.
- Du Clos, T. W. 2000. Function of C-Reactive protein. Annals of Medicine 32 (4) (January 1):274–78. doi:10.3109/07853890009011772.
- Engelhart, M. J., M. I. Geerlings, J. Meijer, A. Kiliaan, A. Ruitenberg, J. C. van Swieten, T. Stijnen, A. Hofman, J. C. M. Witteman, and M. M. B. Breteler. 2004. Inflammatory proteins in plasma and the risk of dementia: The Rotterdam study. Archives of Neurology 61 (5) (May 1):668–72. doi:10.1001/archneur.61.5.668.
- Everett, B., and A. Zajacova. 2015. Gender differences in hypertension and hypertension awareness among young adults. Biodemography and Social Biology 61 (1) (January 2):1–17. doi:10.1080/19485565.2014.929488.
- Ferrucci, L., and E. Fabbri. 2018. Inflammageing: Chronic inflammation in ageing, cardiovascular disease, and frailty. Nature Reviews Cardiology 15 (9) (September 1):505–22. doi:10.1038/s41569-018-0064-2.
- Furman, D., J. Campisi, E. Verdin, P. Carrera-Bastos, S. Targ, C. Franceschi, L. Ferrucci, D. W. Gilroy, A. Fasano, G. W. Miller, et al. 2019. Chronic inflammation in the etiology of disease across the life span. Nature Medicine 25 (12) (December 1):1822–32. doi:10.1038/s41591-019-0675-0.
- Global Burden of Disease Obesity Collaborators. 2017. Health effects of overweight and obesity in 195 countries over 25 years. New England Journal of Medicine 377 (1) (July 6): 13–27. 10.1056/NEJMoa1614362
- Gooding, H. C., S. McGinty, T. K. Richmond, M. W. Gillman, and A. E. Field. 2014. Hypertension awareness and control among young adults in the national longitudinal study of adolescent health. Journal of General Internal Medicine 29 (8) (August 1):1098–104. doi:10.1007/s11606-014-2809-x.
- Grivennikov, S. I., F. R. Greten, and M. Karin. 2010. Immunity, inflammation, and cancer. Cell 140, (6) (March 19):883–99. doi:10.1016/j.cell.2010.01.025.
- Hansson, O. 2021. Biomarkers for neurodegenerative diseases. Nature Medicine 27 (6) (June 1):954–63. doi:10.1038/s41591-021-01382-x.
- Harris, K. M., C. T. Halpern, E. A. Whitsel, J. M. Hussey, L. A. Killeya-Jones, J. Tabor, and S. C. Dean. 2019. Cohort profile: The national longitudinal study of adolescent to adult health (add health). International Journal of Epidemiology 48 (5) (October 1):1415–1415k. doi:10.1093/ije/dyz115.
- Harris, K. M., and T. W. McDade. 2018. The biosocial approach to human development, behavior, and health across the life course. RSF: The Russell Sage Foundation Journal of the Social Sciences 4 (4) (April 1):2. doi:10.7758/RSF.2018.4.4.01.
- Harris, K. M., and K. M. Schorpp. 2018. Integrating biomarkers in social stratification and health research. Annual Review of Sociology 44 (1):361–86. doi:10.1146/annurev-soc-060116-053339.
- Hatch, S. L., and B. P. Dohrenwend. 2007. Distribution of traumatic and other stressful life events by race/ethnicity, gender, SES and age: A review of the research. American Journal of Community Psychology 40 (3–4) (December 1):313–32. doi:10.1007/s10464-007-9134-z.
- Heneka, M. T., M. P. Kummer, and E. Latz. 2014. Innate immune activation in neurodegenerative disease. Nature Reviews Immunology 14 (7) (July 1):463–77. doi:10.1038/nri3705.
- Holm, S. 1979. A simple sequentially rejective multiple test procedure. Scandinavian Journal of Statistics 6 (2):65–70. JSTOR.
- Ikram, M. A., G. G. O. Brusselle, S. D. Murad, C. M. van Duijn, O. H. Franco, A. Goedegebure, C. C. W. Klaver, T. E. C. Nijsten, R. P. Peeters, B. H. Stricker, et al. 2017. The Rotterdam study: 2018 update on objectives, design and main results. European Journal of Epidemiology 32 (9) (September 1):807–50. doi:10.1007/s10654-017-0321-4.
- Khalil, M., L. Pirpamer, E. Hofer, M. M. Voortman, C. Barro, D. Leppert, P. Benkert, S. Ropele, C. Enzinger, F. Fazekas, et al. 2020. Serum neurofilament light levels in normal aging and their association with morphologic brain changes. Nature communications 11 (1) (February 10):812. doi:10.1038/s41467-020-14612-6.
- Khalil, M., C. E. Teunissen, M. Otto, F. Piehl, M. P. Sormani, T. Gattringer, C. Barro, L. Kappos, M. Comabella, F. Fazekas, et al. 2018. Neurofilaments as biomarkers in neurological disorders. Nature Reviews Neurology 14 (10) (October 1):577–89. doi:10.1038/s41582-018-0058-z.
- Koini, M., L. Pirpamer, E. Hofer, A. Buchmann, D. Pinter, S. Ropele, C. Enzinger, P. Benkert, D. Leppert, and J. Kuhle. 2021. Factors influencing serum neurofilament light chain levels in normal aging. Aging (Albany NY) 13 (24):25729. doi:10.18632/aging.203790.
- Liu, R. S., A. E. Aiello, F. K. Mensah, C. E. Gasser, K. Rueb, B. Cordell, M. Juonala, M. Wake, and D. P. Burgner. 2017. Socioeconomic status in childhood and C reactive protein in adulthood: A systematic review and meta-analysis. Journal of Epidemiology and Community Health 71 (8):817–26. doi:10.1136/jech-2016-208646.
- Locascio, J. J., H. Fukumoto, L. Yap, T. Bottiglieri, J. H. Growdon, B. T. Hyman, and M. C. Irizarry. 2008. Plasma amyloid β-protein and C-Reactive protein in relation to the rate of progression of Alzheimer disease. Archives of Neurology 65 (6) (June 1):776–85. doi:10.1001/archneur.65.6.776.
- Long, J. S. 1997. Regression Models for Categorical and Limited Dependent Variables/J. Scott Long. Advanced Quantitative Techniques in the Social Sciences Series. Newbury Park, Calif. u.a. http://media.obvsg.at/AC02009995-1001, https://www.oeaw.ac.at/resources/Record/990000735210504498.
- McDade, T. 2011. The state and future of blood-based biomarkers in the health and retirement study. Forum for Health Economics & Policy 14 (2). doi: 10.2202/1558-9544.1263.
- Michaud, M., L. Balardy, G. Moulis, C. Gaudin, C. Peyrot, B. Vellas, M. Cesari, and F. Nourhashemi. 2013. Proinflammatory cytokines, aging, and age-related diseases. Journal of the American Medical Directors Association 14 (12) (December 1):877–82. doi:10.1016/j.jamda.2013.05.009.
- Muscatell, K. A., S. N. Brosso, and K. L. Humphreys. 2020. Socioeconomic status and inflammation: A meta-analysis. Molecular Psychiatry 25 (9) (September 1):2189–99. doi:10.1038/s41380-018-0259-2.
- National Academies of Sciences, E., and Medicine. 2021. Division of behavioral and social sciences and education; committee on national statistics; committee on population; committee on rising midlife mortal‑ity rates and socioeconomic disparities. High and rising mortality rates among working‑age adults. In High and rising mortality rates among working-age adults, T. Becker, M. Majmundar, K. Harris ed.
- Pase, M. P., A. S. Beiser, J. J. Himali, C. L. Satizabal, H. J. Aparicio, C. DeCarli, G. Chêne, C. Dufouil, and S. Seshadri. 2019. Assessment of plasma total tau level as a predictive biomarker for dementia and related endophenotypes. JAMA Neurology 76 (5):598–606. doi:10.1001/jamaneurol.2018.4666.
- Pawelec, G., D. Goldeck, and E. Derhovanessian. 2014. Inflammation, ageing and chronic disease. Host Pathogens * Immune Senescence 29 (August 1):23–28. doi:10.1016/j.coi.2014.03.007.
- Rajan, K. B., N. T. Aggarwal, E. A. McAninch, J. Weuve, L. L. Barnes, R. S. Wilson, C. DeCarli, and D. A. Evans. 2020. Remote blood biomarkers of longitudinal cognitive outcomes in a population study. Annals of Neurology 88 (6) (December 1):1065–76. doi:10.1002/ana.25874.
- Ravaglia, G., P. Forti, F. Maioli, M. Chiappelli, F. Montesi, E. Tumini, E. Mariani, F. Licastro, and C. Patterson. 2007. Blood inflammatory markers and risk of dementia: The conselice study of brain aging. Neurobiology of Aging 28 (12) (December 1):1810–20. doi:10.1016/j.neurobiolaging.2006.08.012.
- Rebelos, E., E. Rissanen, M. Bucci, O. Jääskeläinen, M.-J. Honka, L. Nummenmaa, D. Moriconi, S. Laurila, P. Salminen, S.-K. Herukka, et al. 2022. Circulating neurofilament is linked with morbid obesity, renal function, and brain density. Scientific Reports 12 (1) (May 12):7841. doi:10.1038/s41598-022-11557-2.
- Rodríguez-Hernández, H., L. E. Simental-Mendía, G. Rodríguez-Ramírez, and M. A. Reyes-Romero. 2013. Obesity and inflammation: Epidemiology, risk factors, and markers of inflammation. Ed. Abdelfattah El Ouaamari. International Journal of Endocrinology 2013 (April 17):678159. doi:10.1155/2013/678159.
- Rubio-Perez, J. M., and J. M. Morillas-Ruiz. 2012. A review: Inflammatory process in Alzheimer’s disease, role of cytokines. Ed. Toshio Kawamata. Scientific World Journal 2012 (April 1): 756357. doi:10.1100/2012/756357.
- Rübsamen, N., A. Maceski, D. Leppert, P. Benkert, J. Kuhle, H. Wiendl, A. Peters, A. Karch, and K. Berger. 2021. Serum neurofilament light and tau as prognostic markers for all-cause mortality in the elderly general population—an analysis from the MEMO study. BMC Medicine 19 (1) (February 15):38. doi:10.1186/s12916-021-01915-8.
- Ryff, C. D., T. Seeman, and M. Weinstein. 2019. Midlife in the United States (MIDUS 2): Biomarker project, 2004-2009. Inter-University Consortium for Political and Social Research distributor.
- Savoia, C., and E. L. Schiffrin. 2006. Inflammation in hypertension. Current Opinion in Nephrology and Hypertension 15 (2):152–58. doi:10.1097/01.mnh.0000203189.57513.76.
- Shaw, L. M., M. Korecka, C. M. Clark, V. M.-Y. Lee, and J. Q. Trojanowski. 2007. Biomarkers of neurodegeneration for diagnosis and monitoring therapeutics. Nature Reviews Drug Discovery 6 (4) (April 1):295–303. doi:10.1038/nrd2176.
- Singh, T., and A. B. Newman. 2011. Inflammatory markers in population studies of aging. Ageing Research Reviews 10 (3):319–29. doi:10.1016/j.arr.2010.11.002.
- Soysal, P., F. Arik, L. Smith, S. E. Jackson, and A. T. Isik. 2020. Inflammation, frailty and cardiovascular disease. In Frailty and cardiovascular diseases : Research into an elderly population, ed. N. Veronese, 55–64. Cham: Springer International Publishing. doi:10.1007/978-3-030-33330-0_7.
- Stebbins, R. C., J. K. Edwards, B. L. Plassman, Y. C. Yang, G. A. Noppert, M. Haan, and A. E. Aiello. 2021. Immune function, cortisol, and cognitive decline & dementia in an aging latino population. Psychoneuroendocrinology 133 (November):105414. doi:10.1016/j.psyneuen.2021.105414.
- Suzman, R. 2009. The national social life, health, and aging project: An introduction. The Journals of Gerontology: Series B 64B (suppl_1) (November 1):i5–11. doi:10.1093/geronb/gbp078.
- Teunissen, C. E., M. P. J. van Boxtel, H. Bosma, E. Bosmans, J. Delanghe, C. De Bruijn, A. Wauters, M. Maes, J. Jolles, H. W. M. Steinbusch, et al. 2003. Inflammation markers in relation to cognition in a healthy aging population. Journal of Neuroimmunology 134 (1) (January 1):142–50. doi:10.1016/S0165-5728(02)00398-3.
- Tobin, J. 1958. Estimation of relationships for limited dependent variables. Econometrica 26 (1) JSTOR:24–36. doi:10.2307/1907382.
- Walker, K. A., B. N. Ficek, and R. Westbrook. 2019. Understanding the role of systemic inflammation in Alzheimer’s disease. ACS chemical neuroscience 10 (8) (August 21):3340–42. doi:10.1021/acschemneuro.9b00333.
- Whitsel, E. A., R. Angel, R. O’Hara, L. Qu, K. Carrier, and K. M. Harris. 2022a. Add Health Wave V Documentation: Inflammation and Immune Function. doi:10.17615/99s8-5w62.
- Whitsel, E. A., R. Angel, R. O’Hara, L. Qu, K. Carrier, and K. M. Harris. 2022b. Add Health Wave V Documentation: Neurodegeneration. doi:10.17615/3qsg-z237.
- Willerson, J. T., and P. M. Ridker. 2004. Inflammation as a Cardiovascular Risk Factor. Circulation 109 (21_suppl_1) (June 1):II–2. doi:10.1161/01.CIR.0000129535.04194.38.
- Williams, D. R., J. A. Lawrence, and B. A. Davis. 2019. Racism and health: Evidence and needed research. Annual Review of Public Health 40 (1) (April 1):105–25. doi:10.1146/annurev-publhealth-040218-043750.
- Zetterberg, H. 2019. Blood-based biomarkers for Alzheimer’s disease—an update. Journal of Neuroscience Methods 319:2–6. doi:10.1016/j.jneumeth.2018.10.025.