?Mathematical formulae have been encoded as MathML and are displayed in this HTML version using MathJax in order to improve their display. Uncheck the box to turn MathJax off. This feature requires Javascript. Click on a formula to zoom.
ABSTRACT
Ethanolamine is an abundant compound in the gastrointestinal tract and a valuable source of carbon and nitrogen for pathogenic bacteria harboring ethanolamine utilization (eut) genes. Eut-positive pathogens can consume free ethanolamine to outcompete commensal microbes, which often lack eut genes, and establish infection. Ethanolamine can also act as a host recognition signal for eut-positive pathogens to upregulate virulence genes during colonization. Therefore, reducing free ethanolamine titers may represent a novel approach to preventing infection by eut-positive pathogens. Interestingly, the commensal microorganism Levilactobacillus brevis ATCC 14869 was found to encode over 18 eut genes within its genome. This led us to hypothesize that L. brevis can compete with eut-positive pathogens by clearing free ethanolamine from the environment. Our results demonstrate that despite being unable to metabolize ethanolamine under most conditions, L. brevis ATCC 14869 responds to the compound by increasing the expression of genes encoding proteins involved in microcompartment formation and adhesion to the intestinal epithelial barrier. The improved intestinal adhesion of L. brevis in the presence of ethanolamine also enhanced the exclusion of eut-positive pathogens from adhering to intestinal epithelial cells. These findings support further studies to test whether L. brevis ATCC 14869 can counter enteric pathogens and prevent or reduce the severity of infections. Overall, the metabolic capabilities of L. brevis ATCC 14869 offer a unique opportunity to add to the armamentarium of antimicrobial therapies as well as our understanding of the mechanisms used by beneficial microbes to sense and adapt to host microenvironments.
Introduction
Ethanolamine (H2N-CH2-CH2-OH) is a constituent of phosphatidylethanolamine, which is an essential compound found in all cell membranes.Citation1 While titers range from 2 to 46 µM throughout the human body, ethanolamine is particularly abundant in the gastrointestinal tract (up to 5 mM).Citation2 This is due to the breakdown of phosphatidylethanolamine through the rapid turnover of cells that make up both the intestinal epithelium and gut microbiota.Citation3,Citation4 As such, gut bacteria that possess the ethanolamine utilization (eut) operon, which includes the genes to sense, transport, and catabolize ethanolamine, have a significant advantage in this setting.Citation2 The eut genes are most commonly associated with enteric pathogens that utilize ethanolamine to circumvent nutritional immunity and leverage their growth to establish an infection.Citation5
While ethanolamine is an important nutrient source, it also has a significant role in promoting bacterial pathogenesis. It is not uncommon for bacteria to rely on environmental cues to regulate the expression of important genes needed in a particular setting. Certainly, ethanolamine serves the same function and, for eut-positive pathogens, upregulates the expression of virulence genes that help these pathogens outcompete the host microbiota to establish a successful infection. For instance, ethanolamine promotes the expression of the genes responsible for cellular adhesion and intracellular survival located outside of the eut loci in enterohemorrhagic E. coli (EHEC),Citation6-10 uropathogenic E. coli (UPEC),Citation11,Citation12 and Salmonella enterica serovar Typhimurium.Citation12-18
Despite the prevalence of eut genes in enteric pathogens, a small proportion of commensal lactic acid bacteria have also acquired these genes. Of particular interest, Levilactobacillus brevis ATCC 14869 possesses over 18 eut genes. This includes the enzymatic and structural proteins needed for microcompartment-mediated ethanolamine metabolism. To our knowledge, no lactobacilli harboring these genes have been explored experimentally. Since most ethanolamine-utilizing pathogens rely on this metabolite for both signaling and the circumvention of nutritional immunity, eut-positive probiotic strains could potentially mitigate infections by clearing free ethanolamine from the environment. Additionally, these beneficial microbes could also use this compound as a signal to enhance host colonization by upregulating adhesin genes located outside of the eut locus. If true, such probiotic microbes could illicit a multifaceted attack by both sequestering nutrients from eut-positive pathogens and outcompeting them for space on intestinal epithelia.
In the present study, we sought to determine if ethanolamine is used by L. brevis as a nutrient source or a signal to alter adherence capabilities. By combining culture-based techniques and high-performance liquid chromatography (HPLC), the effect of ethanolamine on the growth of L. brevis was assessed, while transmission electron microscopy (TEM), RNA sequencing, and qPCR analysis were used to evaluate how ethanolamine impacts L. brevis gene expression and bacterial microcompartment formation. Intestinal adherence of L. brevis and its ability to competitively exclude pathogen colonization were also assessed using cell culture.
Results
Increasing concentrations of ethanolamine do not confer a growth advantage to L. brevis ATCC 14869
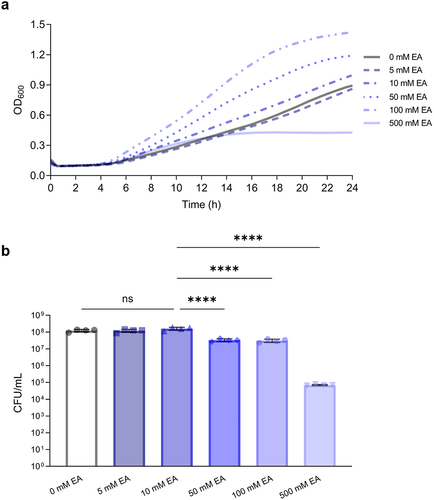
The growth of L. brevis in 1:9 diluted MRS supplemented with increasing concentrations of ethanolamine () was assessed. Overall, there was a significant growth difference observed when L. brevis was grown at varying ethanolamine titers (ANOVA; F = 41.92, p < .0001; ). At 5 mM (Tukey’s multiple-comparisons test; p > .9999) or 10 mM (Tukey’s multiple-comparisons test; p = .1504) of ethanolamine there was no significant difference in growth compared to the absence of ethanolamine. Indeed, as ethanolamine concentrations increased to 50 mM, 100 mM and 500 mM, there was a significant decrease in L. brevis growth when compared to growth at 10 mM (Tukey’s multiple-comparisons test; p < .0001; ). The opposite trend was observed when growth was assessed with optical density. Final OD600 values were boosted with increasing concentrations of ethanolamine ().
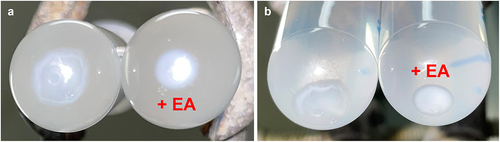
Figure 1. Increasing concentrations of ethanolamine (EA) do not confer a growth advantage to L. brevis.
Levilactobacillus brevis ATCC 14869 does not utilize ethanolamine under standard growth conditions in vitro
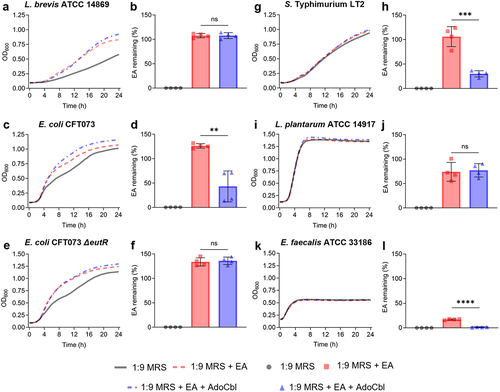
The bacterium was cultured in 1:9 diluted MRS spiked with 10 mM ethanolamine, with or without 150 nM adenosylcobalamin. Since adenosylcobalamin is a required cofactor for ethanolamine metabolism, final supernatant titers of ethanolamine were compared between the cultures grown with only ethanolamine and those with ethanolamine and adenosylcobalamin. Although there was an increase in OD600 measurements (), L. brevis ATCC 14869 did not significantly reduce ethanolamine in the supernatant (two-tailed t test; p = .9656; ). In contrast, E. coli CFT073 (two-tailed t test; p = .0020; ) and E. faecalis ATCC 33186 (two-tailed t test; p < .0001; ) did not demonstrate an increase in optical density but did significantly reduce ethanolamine in the supernatant when grown in the same conditions. The E. coli CFT073 ∆eutR mutant showed the same trend in optical density () but did not significantly reduce ethanolamine titers (two-tailed t test; p = .7156; ). Salmonella Typhimurium LT2 was like E. coli CFT073, with minimal differences in optical density () paired with a significant reduction in remaining ethanolamine (two-tailed t test; p = .004; ). Lactiplantibacillus plantarum, which is closely related to L. brevis genetically but does not possess any eut genes, showed no change in optical density () and did not reduce the ethanolamine spiked into the culture medium (two-tailed t test; p = .7997; ).
Figure 2. Ethanolamine (EA) clearance during growth.
Utilization of ethanolamine by L. brevis ATCC 14869 in reduced nitrogen conditions hampers growth
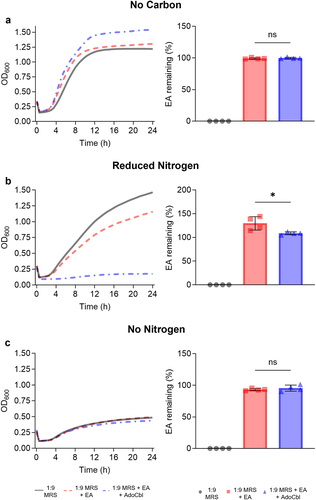
The bacterium was cultured in carbon free MRS (cfMRS), reduced nitrogen MRS (rnMRS), or nitrogen free MRS (nfMRS) spiked with 10 mM EA, with or without 150 nM adenosylcobalamin. When grown in cfMRS increased OD600 measurements were observed (), however, L. brevis ATCC 14869 did not significantly reduce ethanolamine in the supernatant (two-tailed t test; p = .4941; ). Interestingly, when grown in rnMRS, the opposite trend was observed wherein L. brevis ATCC 14869 significantly reduced ethanolamine in the supernatant (two-tailed t test; p = .0270; ) which resulted in lower OD600 readings. nfMRS seemed insufficient to support substantial growth of the bacterium whether ethanolamine was present or not, as mean OD600 did not exceed 0.5 (). In line with these findings, L. brevis ATCC 14869 could not reduce the ethanolamine spiked into nfMRS (two-tailed t test; p = .4131; ).
Figure 3. Utilization of ethanolamine as a nitrogen source reduces the growth of L. brevis ATCC 14869.
The presence of ethanolamine and adenosylcobalamin results in bacterial microcompartment formation in L. brevis ATCC 14869
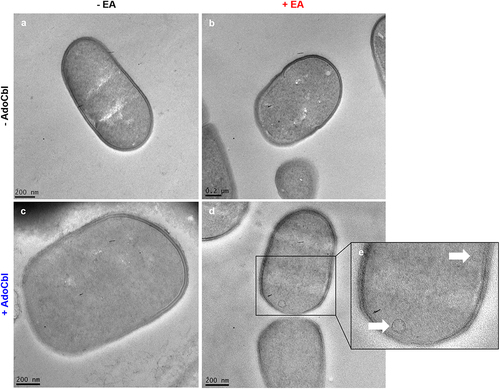
Cultures of L. brevis ATCC 14869 grown with either 10 mM ethanolamine or 150 nM adenosylcobalamin did not produce microcompartment structures, as determined by TEM (). Conversely, bacterial cells grown with both ethanolamine and adenosylcobalamin produced observable microcompartment structures (indicated by white arrows) located near the cellular membrane ().
Figure 4. Transmission electron microscopy (TEM) of L. brevis ATCC 14869 reveals bacterial microcompartment formation.
Ethanolamine and adenosylcobalamin upregulate eut, pdu, and apf gene expression in L. brevis ATCC 14869
Differentially expressed genes were defined as those with a |log FC| > 1 and p < .05. This analysis revealed 116 differentially expressed genes between cultures grown with and without ethanolamine and adenosylcobalamin (). This includes multiple genes from both the eut and pdu operons (), as well as a putative aggregation promoting factor (apf) (). In contrast, growth with ethanolamine or adenosylcobalamin alone resulted in 14 or 0 differentially expressed genes, respectively (). qPCR was used to verify the observed expression pattern of select genes of interest, namely, the eutB, eutH, pduC, pduB and apf genes (). In comparison to cultures grown in media alone, there was a significant increase in the expression of eutB (two-tailed t test; p = .0465; ), apf (two-tailed t test; p = .0054; ), pduC (two-tailed t test; p = .0290; ) and pduB (two-tailed t test; p = .0045; ) in cultures grown with ethanolamine and adenosylcobalamin relative to the housekeeping genes gyrA and rpoD.Citation19,Citation20 Conversely, there was no significant difference in the expression of eutH (two-tailed t test; p = .8165; ).
Figure 5. RNA sequencing analysis of L. brevis ATCC 14869 grown with ethanolamine (EA) and adenosylcobalamin (AdoCbl).
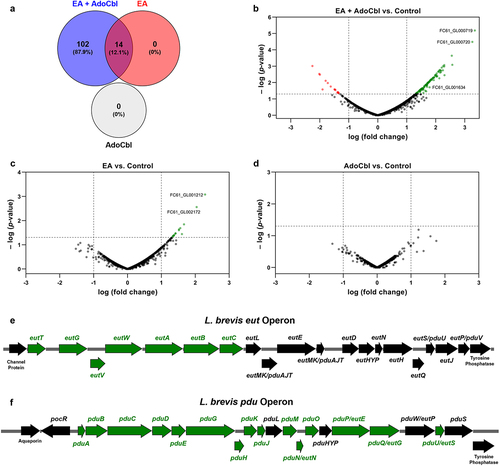
Figure 6. qPCR analysis of L. brevis ATCC 14869 eut, pdu, and apf genes.
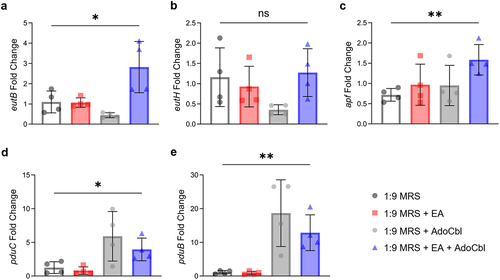
Table 1. Differentially expressed transcripts by L. brevis in the presence of ethanolamine and adenosylcobalamin.
The cell surface hydrophobicity of L. brevis ATCC 14869 does not change in the presence of ethanolamine
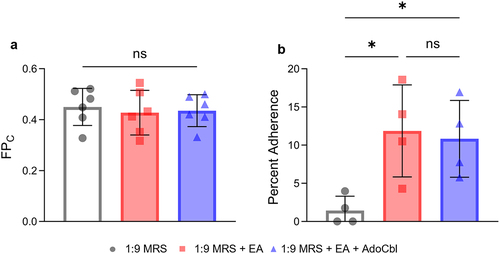
A MATH assay was used to determine if ethanolamine alters cell surface hydrophobicity; L. brevis was grown with or without 10 mM ethanolamine and 150 nM adenosylcobalamin. When differences in the fraction partitioned to the hydrocarbon phase (FPC) between groups were assessed, there was no significant difference observed (ANOVA; F = 1.387, p = .8716; ).
Figure 7. The influence of ethanolamine (EA) on L. brevis ATCC 14869 adhesion to abiotic factors.
The ability of L. brevis ATCC 14869 to adhere to mucin in vitro increases in the presence of ethanolamine
Using a plate-based assay,Citation21 the percent adherence for each well was measured relative to the initial number of bacteria added. There was a significant difference in the percent adherence of L. brevis observed between conditions (ANOVA; F = 6.061, p = .0215; ). Cells grown overnight in the presence of ethanolamine (Tukey’s multiple-comparisons test; p = .0282) or ethanolamine and adenosylcobalamin (Tukey’s multiple-comparisons test; p = .0459) adhered significantly more to mucin-coated wells when compared to those grown in media alone.
Ethanolamine and adenosylcobalamin influence the ability of L. brevis ATCC 14869 to adhere to intestinal epithelial cells
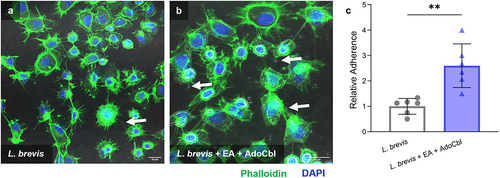
Caco-2 cells are commonly used as a model of the intestinal epithelial barrier.Citation22 Therefore, the ability of L. brevis to adhere to Caco-2 cells following growth under various conditions was used as a measure of cellular adherence to the intestinal epithelium. Briefly, bacterial cells grown overnight with or without 10 mM ethanolamine and 150 nM adenosylcobalamin were allowed to adhere to Caco-2 cells and the resulting adherent bacteria were quantified via CFU analysis. There was a significant 2.5-fold increase in the cellular adherence to Caco-2 cells of L. brevis ATCC 14869 grown overnight in the presence of 10 mM ethanolamine and 150 nM adenosylcobalamin (two-tailed t test; p = .0016; ) relative to bacteria grown in media alone.
Figure 8. Ethanolamine (EA) influences L. brevis ATCC 14869 adhesion to human intestinal epithelial cells.
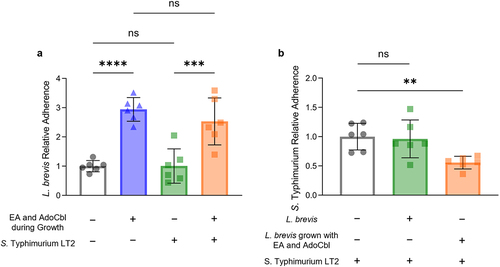
Ethanolamine and adenosylcobalamin enhance the ability of L. brevis ATCC 14869 to competitively exclude S. Typhimurium LT2 from binding intestinal epithelial cells
A competitive exclusion assay was used to assess the ability of L. brevis grown with or without 10 mM ethanolamine and 150 nM adenosylcobalamin to competitively exclude S. Typhimurium LT2 from binding a model of the intestinal epithelium. There was a significant difference in the relative adherence of L. brevis across conditions (ANOVA; F = 20.76, p < .0001; ). In both the presence (Tukey’s multiple-comparisons test; p = .0005) and absence (Tukey’s multiple-comparisons test; p < .0001) of S. Typhimurium LT2, L. brevis ATCC 14869 grown with ethanolamine and adenosylcobalamin had significantly increased adhesion relative to cells grown in media alone. Interestingly, the quantity of S. Typhimurium LT2 recovered from cells first incubated with L. brevis grown with ethanolamine and adenosylcobalamin was significantly less (ANOVA; F = 6.485, p = .0093) than that recovered from cells incubated with S. Typhimurium LT2 alone (Tukey’s multiple-comparisons test; p = .0015; ).
Figure 9. Ethanolamine (EA) enhances the ability of L. brevis ATCC 14869 to competitively exclude Salmonella Typhimurium LT2 from binding human intestinal epithelial cells.
Discussion
This is the first study to demonstrate that a lactic acid bacterium can respond to environmental ethanolamine to alter gene expression and enhance cellular adherence. Despite possessing a fully intact and functional eut operon (), L. brevis ATCC 14869 does not gain a growth advantage when cultured in the presence of ethanolamine (). In fact, despite having increased optical density (), bacterial growth remained unaltered in the presence of physiologically relevant amounts of ethanolamine in standard bacteriological media (). However, L. brevis could utilize ethanolamine in low nitrogen conditions at a severe cost to the organisms growth.
While L. brevis ATCC 14869 did not display growth benefits from ethanolamine supplementation, it was still plausible that it could preferentially utilize ethanolamine as a carbon or nitrogen source. Upon assessing ethanolamine titers remaining in the culture supernatant following growth, this was not the case (). Unlike E. coli CFT073 (), S. Typhimurium LT2 (), and E. faecalis ATCC 33186 (), L. brevis was unable to reduce ethanolamine spiked into the standard culture medium (). Furthermore, while both E. coli CFT073 and S. Typhimurium LT2 have been shown to use ethanolamine as a signaling molecule to increase the expression of genes related to adhesion,Citation6 there were very minimal increases in optical density when grown with ethanolamine in comparison to L. brevis ATCC 14869. The same negative result was observed in the Gram-positive bacterium L. plantarum ATCC 14917 (), a relative of L. brevis. Because the bacteriological media used contains sources of both carbon and nitrogen that may be preferred over ethanolamine, the growth of L. brevis was also assessed in both cfMRS and rnMRS. When grown in cfMRS, the same trend was observed where an increased optical density in the presence of ethanolamine was observed but was not accompanied by a reduction of the compound in the supernatant. To our surprise, L. brevis significantly reduced ethanolamine from culture when grown in rnMRS, however, ethanolamine utilization dramatically reduced the growth of L. brevis. While further investigation is required, it is interesting to speculate that the metabolism of ethanolamine by L. brevis leads to the production of toxic metabolites that prevent further growth of the organism. Therefore, these findings suggest that unlike other eut-positive pathogens and related lactobacilli, ethanolamine causes significant changes to the phenotype of L. brevis ATCC 14869 including an increased propensity to self-aggregate during growth ().
Pathogens that possess eut genes have a distinct advantage over commensal microbes during the early stages of infection.Citation23 EHEC and S. Typhimurium LT2 utilize ethanolamine as a nutrient source and as a signal to enhance the expression of virulence genes.Citation7-10,Citation24 Using the EutBC ammonia-lyase complex, eut-positive pathogens break down ethanolamine into acetaldehyde and ammonia.Citation23 These molecules then serve as important carbon and nitrogen sources to enhance bacterial growth in an otherwise competitive gastrointestinal environment.
Although L. brevis ATCC 14869 could not reduce ethanolamine under most conditions, TEM imaging still revealed the production of microcompartments within the organism (). This suggests that the production of microcompartment structures may serve an alternative purpose in this bacterium. Both the ethanolamine and 1,2-propanediol degradative pathways involve aldehyde intermediates that demonstrate cytotoxic activity. Due to this, it has been proposed that microcompartments could be created to sequester these toxic aldehydes and protect the cell.Citation14,Citation25-27 In fact, mutants lacking the appropriate microcompartments accumulate high levels of aldehydes that arrested growth.Citation28,Citation29 Considering our evidence showing ethanolamine metabolism halts the growth of L. brevis (), the formation of microcompartments may be used to limit the escape of these harmful compounds or to prevent ethanolamine metabolism as a whole. In pathogens that possess both eut and pdu operons, like Salmonella, there is a system to repress the transcription of eut microcompartment proteins during the expression of pdu microcompartment proteins via a PocR-dependent mechanism.Citation30 Notably, L. brevis ATCC 14869 possesses a fully intact and functional pdu operon () in addition to the eut genes (). Our results demonstrated that only the pdu shell proteins are expressed upon the activation of both operons (), suggesting that L. brevis ATCC 14869 might use a similar mechanism to prevent the detrimental mixing of microcompartment proteins.Citation30 Therefore, the deleterious effect of ethanolamine utilization on L. brevis in rnMRS might be explained by the accumulation of toxic aldehydes resulting from ethanolamine metabolism in the absence of the appropriate microcompartment. In other ethanolamine-utilizing bacteria, like L. monocytogenes, the microcompartment-mediated metabolism of ethanolamine is linked to flavin-based extracellular electron transport,Citation31,Citation32 which cannot be ruled out for L. brevis ATCC 14869. The presence of these structures could also indicate preparation for the metabolism of 1,2-propanediol, which is structurally similar to ethanolamine and whose metabolism is under control of the pdu operon.
The ability to form cellular aggregates is a desirable trait for some probiotic microorganismsCitation33 because it can mitigate pathogen adherence to the intestinal epithelium by forming a protective barrier through self-aggregation or coaggregation with other commensal bacteria. Indeed, these probiotics may also directly co-aggregate with pathogens to promote clearance in the feces.Citation34,Citation35 Therefore, the ability of L. brevis ATCC 14869 to enhance aggregation () in the presence of ethanolamine is a desirable characteristic, making it a prime candidate for use in probiotic contexts to inhibit pathogen colonization. Previous literature suggests that increased cell surface hydrophobicity of probiotic bacteria improves intestinal colonization and contributes to cellular auto-aggregation.Citation36,Citation37 When both ethanolamine and adenosylcobalamin were present, the cell surface hydrophobicity of L. brevis ATCC 14869 was not significantly different than cultures grown without ethanolamine ().
Despite our observations, the mechanism that mediates this improved aggregation is still unknown. RNA sequencing analysis revealed that ethanolamine and adenosylcobalamin trigger the upregulation of an aggregation promoting factor-like surface protein ( and ). This was confirmed via qPCR analysis, where a significant upregulation in the gene encoding this putative aggregation promoting factor was observed (). Aggregation promoting factors (apf) have been associated with numerous functional roles in lactobacilli.Citation33 For instance, L. coryniformis DSM 20,001 produces a coaggregation-promoting factor that facilitates binding to pathogenic strains of E. coli and campylobacter.Citation34 Similarly, an apf synthesized by L. acidophilus NCFM was shown to promote an auto-aggregation phenotype as well as the ability to mediate adherence to both intestinal epithelial cells and mucin glycoproteins.Citation33 Considering the wealth of literature supporting the functional roles of apf and apf-like proteins in promoting adherence in the gut, the upregulation of an apf by L. brevis ATCC 14869 in the presence of ethanolamine and adenosylcobalamin () to promote adherence () is not unlikely. This provides a potential mechanism by which this commensal microorganism uses ethanolamine to improve gut epithelial binding and colonization.
While improved adhesion in the presence of ethanolamine is significant, the use of L. brevis ATCC 14869 as a probiotic may rely on its ability to prevent pathogen adherence in the gut. Interestingly, L. brevis ATCC 14869 retained its increased binding capacity when grown in the presence of ethanolamine and adenosylcobalamin when S. Typhimurium LT2 was present in culture (). More importantly, the amount of adherent S. Typhimurium LT2 recovered from cells pre-incubated with L. brevis ATCC 14869 (grown overnight with ethanolamine and adenosylcobalamin) was approximately half of that recovered from cells incubated with the pathogen alone or those pre-incubated with L. brevis ATCC 14869 grown in the absence of ethanolamine. These findings suggest that the production of an apf and the self-aggregation phenotype of L. brevis ATCC 14869 resulting from growth in the presence of ethanolamine and adenosylcobalamin can potentially inhibit pathogen binding in the gut. Thus, in vivo studies are warranted to assess both the efficacy and safety of L. brevis ATCC 14869 supplementation in reducing both pathogen load and infection severity through competitive exclusion.Citation38,Citation39
Ethanolamine reaches its highest bodily concentration (~5 mM) in the gut.Citation2 For this reason, it is logical that pathogens, commensals, and probiotic strains possess a mechanism to use this molecule. Although numerous studies have shown that EutR is directly responsible for the upregulation of virulence genes outside the eut operon,Citation6,Citation8 some virulence genes are still upregulated in ∆eutR strains of EHEC.Citation8 This suggests that eut-positive microbes may possess a currently uncharacterized mechanism, independent of EutR, by which they are able to upregulate specific genes in the presence of ethanolamine. Since L. brevis ATCC 14869 does not possess the EutR system, the results of this study implicate the existence of a novel mechanism to sense ethanolamine and regulate gene expression.
In conclusion, the present study has identified a potentially novel apf that is upregulated in L. brevis ATCC 14869 in response to ethanolamine and adenosylcobalamin, which mediates adhesion to mucin and intestinal epithelial cells. We have also shown that while L. brevis ATCC 14869 can be swayed to utilize ethanolamine in a low nitrogen environment, it is detrimental to the growth of this bacterium.
Materials and methods
Chemicals
Ethanolamine hydrochloride was obtained from Sigma-Aldrich® (catalog no. E6133) and stored under the conditions defined by the manufacturer. Appropriate concentrations were made the day of experimental use in De Man, Rogosa and Sharpe (MRS) broth (BD Difco™; catalog no. DF0881-17-5). Adenosylcobalamin was obtained from Sigma-Aldrich® (catalog no. V6629) and was stored at a concentration of 0.5 mM at −20°C in a mixture of ethanol and ddH2O (60:40 [v/v]). Dilutions were made and filter sterilized on the day of experimental use in MRS broth from this stock. p-Toluenesulfonyl chloride was obtained from Sigma-Aldrich® (catalog no. V001581) and stored under the conditions defined by the manufacturer. The appropriate dilution of p-toluenesulfonyl chloride was made in acetonitrile on the day of each experiment.
Overnight culture preparation
Levilactobacillus brevis ATCC 14869 and Lactiplantibacillus plantarum subsp. plantarum ATCC 14917 (a eut-negative control) were streaked from a frozen stock onto MRS agar and incubated in 5% CO2 at 37°C under stationary conditions for 48 and 24 hours, respectively. Experimental cultures were prepared by inoculating 10 mL of MRS broth with a single colony and incubating in 5% CO2 at 37°C under stationary conditions for 24 hours.
Uropathogenic isolate Escherichia coli CFT073, Escherichia coli CFT073 ΔeutR,Citation12 and Salmonella enterica ssp. enterica serovar Typhimurium LT2 were streaked from frozen stocks onto lysogeny broth agar (10 g tryptone, 5 g yeast extract and 10 g NaCl with 15 g agar dissolved in 1 L ddH2O; LB) and were incubated aerobically at 37°C under stationary conditions for 24 hours. Experimental cultures were prepared by inoculating 10 mL of LB broth with a single colony and incubating aerobically at 37°C under stationary conditions for 24 hours.
Enterococcus faecalis ATCC 33186 were streaked from a frozen stock onto brain heart infusion (BD Difco™; catalog no. DF0037-17-8; BHI) agar and incubated aerobically at 37°C under stationary conditions for 24 hours. Experimental cultures were prepared by inoculating 10 mL of BHI broth with a single colony and incubating aerobically at 37°C under stationary conditions for 24 hours.
Ethanolamine tolerance assay
Four independent overnight cultures of L. brevis ATCC 14869 were prepared as described. Bacterial cultures were then washed twice and resuspended in 10 mL of 1× phosphate-buffered saline (8 g NaCl, 0.2 g KCl, 1.44 g Na2HPO4 and 0.24 g KH2PO4 dissolved in 1 L ddH2O; pH 7.4; PBS). Exactly 100 μL of the washed bacterial cells were used to inoculate 10 mL of filter-sterilized, 1:9 diluted MRS containing 150 nM adenosylcobalamin and either 0 mM, 5 mM, 10 mM, 50 mM, 100 mM or 500 mM of ethanolamine. 300 μL of the resulting cultures were immediately transferred into a 96-well U-shaped-bottom plate (Falcon; catalog no. 35177) in technical duplicate for growth analysis. Plates were incubated at 37°C for 24 hours and the optical density was measured at 600 nm (OD600) every 30 minutes using a microplate reader following a 2 second orbital shake (BioTek, Eon). Final colony forming units per milliliter (CFU/mL) was quantified using MRS plates after 24 hours.
Ethanolamine clearance assay
Overnight cultures of L. brevis ATCC 14869, L. plantarum ATCC 14917, E. coli CFT073, E. coli CFT073 ΔeutR, S. Typhimurium LT2, and E. faecalis ATCC 33186 were washed and resuspended in PBS and 100 μL was used to inoculate 10 mL of filter-sterilized, 1:9 diluted MRS with or without 10 mM ethanolamine and 150 nM adenosylcobalamin. Cultures of L. brevis ATCC 14869 and L. plantarum ATCC 14917 were incubated in 5% CO2 at 37°C under stationary conditions for 24 hours, while E. coli CFT073, E. coli CFT073 ΔeutR, S. Typhimurium LT2 and E. faecalis ATCC 33186 were incubated aerobically at 37°C under stationary conditions for 24 hours. In addition, 300 μL of the resulting cultures were immediately transferred into a 96-well plate for OD600 analysis, as described above. After 24 hours, the culture supernatants were removed, and remaining ethanolamine was quantified using high-performance liquid chromatography (HPLC). To assess whether L. brevis ATCC 14869 can utilize ethanolamine in the absence of traditional nutrient sources, the same experiments were performed in carbon free MRSCitation40 (5 g peptone, 5 g meat extract, 2.5 g yeast extract, 1 g K2HPO4, 0.5 g polysorbate 80, 2.5 g C₂H₃NaO₂, 1 g C6H17N3O7, 0.2 g MgSO4·7H2O, and 0.05 g MnSO4·H2O dissolved in 400 mL ddH2O; pH 6.7; cfMRS), reduced nitrogen MRS (1 g peptone, 0.8 g meat extract, 0.4 g yeast extract, 20 g D-Glucose, 2 g K2HPO4, 1 g polysorbate 80, 5 g C₂H₃NaO₂, 0.2 g C6H17N3O7, 0.2 g MgSO4·7H2O, and 0.05 g MnSO4·H2O dissolved in 1 L ddH2O; pH 6.5; rnMRS), and nitrogen free MRS (20 g D-Glucose, 2 g K2HPO4, 1 g polysorbate 80, 5 g C₂H₃NaO₂, 0.2 g MgSO4·7H2O, and MnSO4·H2O dissolved in 1 L ddH2O; pH 6.5; nfMRS). A reduced carbon MRS group was not included as 1:9 diluted MRS serves this purpose.
Prior to HPLC analysis, samples and ethanolamine standards were subject to a previously described derivatization protocol using p-toluenesulfonyl chloride.Citation41 Briefly, the culture supernatant was diluted (1:9) with HPLC grade H2O and combined with 0.5 M potassium phosphate buffer (pH 11) and 10 mg/mL p-toluenesulfonyl chloride (dissolved in HPLC grade acetonitrile) at a ratio of 1:1:2. This reaction mixture was vortexed and incubated at 56°C for 30 to 45 minutes. The samples were subsequently vortexed and filtered (0.45 μM) into amber HPLC vials. An Agilent 1100 HPLC instrument equipped with a degasser (G1379A), quaternary pump (G1311A), autosampler (G1313A) and diode array detector (G1315B) was used for ethanolamine quantification of all the samples and standards. The samples were separated using an Agilent Poroshell 120 EC-C18 (4.6- by 150-mm i.d., 4-μm particle size) column preserved at ambient temperature and detected using a diode array detector at 228 nm. The mobile phase was comprised of acetonitrile and water (60:40 [v/v]) spiked with 0.1% (v/v) orthophosphoric acid. An injection volume of 10 μL at a flow rate of 0.85 mL/min was used. Run times were 12 minutes long, with ethanolamine eluting at ~2.7 minutes. Data were analyzed using ChemStation B.04.03 with reference to an external calibration curve (1 to 10 mM) for ethanolamine quantification.
TEM of bacterial cells
TEM imaging was performed at the Advanced Analysis Centre at the University of Guelph (Guelph, Ontario, Canada). Briefly, overnight cultures of L. brevis ATCC 14869 were grown in 40 mL of filter-sterilized, 1:9 diluted MRS with or without 10 mM ethanolamine and 150 nM adenosylcobalamin by inoculating it with 100 μL of washed bacterial cells and incubating overnight, as previously described above. Subsequently, cultures were centrifuged for 10 minutes at 5000 × g. Bacterial pellets were then washed and re-pelleted in filter-sterilized 20 mM HEPES (pH 6.8) prior to sample preparation. Bacterial cells were fixed with 2.5% (w/v) glutaraldehyde and 2% (w/v) paraformaldehyde in 50 mM HEPES, enrobed in Noble agar and fixed with 1% (w/v) osmium tetraoxide before being embedded in LR White resin. 80 nm sections were cut and then contrast stained with both lead citrate and uranyl acetate. Sections were then imaged using a Tecnai F20 G2 transmission electron microscope operated at 120 kVe equipped with a Gatan Ultra scan 4K CCD camera under standard operating conditions.
RNA extraction and reverse transcription
Overnight cultures of L. brevis ATCC 14869 at stationary phase were grown in 40 mL of filter-sterilized, 1:9 diluted MRS with or without 10 mM ethanolamine and 150 nM adenosylcobalamin were centrifuged at 4°C for 5 minutes at 6000 × g and the bacterial pellet was resuspended in 1 mL of cold TRIzol reagent (Ambion; catalog no. 15596018) for 10 minutes at room temperature. Next, the bacteria and TRIzol solution was transferred to bead-beating tubes containing approximately 100 μL of 0.1 micron zirconium beads. These tubes were then incubated for 5 minutes at room temperature, and subsequently placed in a Bead Beater (MRC) set at 7 m/s for two cycles of 45 seconds. Following this, 0.2 volumes of chloroform (ThermoFisher) were added, and the samples were briefly vortexed prior to 10 minutes of incubation at room temperature. The samples were then centrifuged at 4°C for 20 minutes at 13,000 rpm. The aqueous layer containing the RNA was then removed and mixed with an equal volume of 70% ethanol prepared using nuclease-free water. Then, 600 μL of the resulting solution was transferred to a spin column and collecting tube (ThermoFisher; catalog no. 12183025) and centrifuged at 12,000 × g for 1 minute at room temperature. This process was repeated until the entire sample volume was spun through the cartridge. The flow-through was subsequently discarded, and 600 μL of Wash Buffer I (ThermoFisher; catalog no. 12183025) was added to the spin cartridge. The cartridge was then centrifuged at 12,000 × g for 1 minute at room temperature and the flow-through was discarded. The spin cartridge was subsequently inserted into a new collection tube. Next, 80 μL of preprepared PureLink® DNase mixture (ThermoFisher; catalog no. 12185010) was added directly onto the surface of the spin column and allowed to incubate at room temperature for 15 minutes. Then, 600 μL of Wash Buffer I was again added to the spin cartridge and centrifuged at 12,000 × g for 1 minute at room temperature. The flow-through was then discarded, and the spin cartridge was again placed in a new collection tube. Next, 600 μL of Wash Buffer II (ThermoFisher; catalog no. 12183025) was added to the spin cartridge and centrifuged at 12,000 × g for 1 minute at room temperature. The flow-through was discarded, and this step was repeated once. After discarding the flow-through for a second time, the spin cartridge was centrifuged again at 12,000 × g for 2 minutes to dry the membrane. The spin cartridge was then placed in a new microfuge tube, and 50 μL of prewarmed (56°C) nuclease-free water was added to the center of the cartridge. The cartridge was then centrifuged at 12,000 × g for 2 minutes to elute the RNA. The resulting solution was then separated into preferred aliquots for quality and quantity analysis, qPCR and RNA sequencing.
After RNA preparation, cDNA was synthesized from 1000 ng of RNA samples aliquoted for qPCR using a High-Capacity cDNA reverse transcription kit (Applied Biosystems; catalog no. 4368813) as per the manufacturer’s instructions.
RNA sequencing analysis
RNA was extracted according to the previously described method, and samples were assessed for quality and quantity using an Agilent 2100 Bioanalyzer. All samples demonstrated a high RNA Integrity Number (RIN) ≥ 9. To prepare the libraries for RNA sequencing analysis, the Stranded Total RNA Prep Ligation with Ribo-Zero Plus kit from Illumina and 10 bp IDT for Illumina indices were used. A NextSeq2000 system was employed for sequencing, producing high-quality reads of 2 × 51 bp.
Quality control and adapter trimming was performed using bcl2fastq (v2.20.0.445). Read mapping was done with HISAT2 (v2.2.0)Citation42 and read quantification was performed using Subread’s featureCounts functionality (v2.0.1).Citation43 The read counts were then loaded into R and normalized using the Trimmed Mean of M values (TMM) algorithm in edgeR (1.14.5).Citation44 Subsequent values were converted to counts per million (cpm). Differential expression analysis was then performed using edgeR’s exact test for differences between two groups of negative-binomial counts with an estimated dispersion value of 0.1. Furthermore, the qlfTest was conducted for all genes; differentially expressed genes were identified as those with a |log Fold Change| > 1 and p < .05.
qPCR analysis
RNA was extracted and reverse transcription of L. brevis ATCC 14869 samples was performed as previously described. The prepared cDNA was diluted 15× in nuclease-free water and used for the qPCR reaction with the PowerTrack™ SYBR Green Master Mix (ThemoFisher; catalog no. A46113). The primers used in this study, designed using Primer-BLAST,Citation45 are described in . In summary, gyrA and rpoD were used as reference genes and the primers targeting eut operon (eutB, eutH), pdu operon (pduC, pduB) and the apf gene were used as indicators of eut operon, pdu operon, and apf gene expression. Reagent volumes for the 20 μL reactions contained 5 μL of diluted cDNA, 10 μL of the PowerTrack™ Master Mix, and 5 μL of primer mix containing 2 μM of each the forward and reverse primers (final concentration of 500 nM). Each reaction was performed in technical triplicate and qPCR was conducted on a QuantStudio 5 real-time PCR system and analyzed using the QuantStudio Design and Analysis software v1.4.3 (ThermoFisher). Reaction conditions were as follows: 50°C for 2 min, 95°C for 10 min, 40 cycles of 95°C for 15 s and 60°C for 1 min. The fold change of each target gene was determined through comparison with the average expression of the reference genes (2−ΔΔCT).Citation46
Microbial adhesion to hydrocarbons (MATH) assay
Overnight cultures of L. brevis ATCC 14869 were grown in 10 mL of filter-sterilized, 1:9 diluted MRS with or without 10 mM ethanolamine and 150 nM adenosylcobalamin. These cultures were centrifuged at 5000 × g for 15 minutes and resuspended in 10 mL of ddH2O containing 0.2 mM NaCl (pH 6). A microplate reader (BioTek, Eon) was used to calculate the initial absorbance (Ao) at 600 nm of each sample. A 5 mL aliquot of these washed bacteria cells was then mixed with 300 μL of n-hexadecane (Sigma Aldrich®; catalog no. H6703) and vortexed for 2 minutes. The samples were allowed to rest for 15 minutes to facilitate phase separation. Next, a sample of the bacterial suspension was retrieved and dispensed into a new tube. The absorbance (Af) at 600 nm of the recovered sample was then calculated. To determine the fraction partitioned to the hydrocarbon phase (FPc), the following formula was used:
In vitro mucin adhesion assay
A mucin adhesion assayCitation21 was performed in 96-well U-shaped-bottom plates (Falcon; catalog no. 35177). Initially, 100 μL of a mucin solution (10 mg/mL) in 1× PBS was immobilized in each well for 1 hour at 37°C. This was followed by overnight incubation at 4°C. The wells were then washed with 200 μL of 1× PBS and incubated with bovine serum albumin (20 g/L; BSA [Sigma Aldrich®; catalog no. A4628]) for 2 hours at 4°C before being washed again with PBS to eliminate the unbound BSA. Overnight cultures of L. brevis ATCC 14869 were grown in filter-sterilized, 1:9 diluted MRS with or without 10 mM ethanolamine and 150 nM adenosylcobalamin alongside the 96-well plate preparation. The initial CFU/mL was determined for each overnight culture. Next, 100 μL of each culture was added to the wells and incubated aerobically for 1 hour at 37°C. After incubation, the wells were washed five times with 200 μL of sterile citrate buffer (8.3 g/L NaCl, 0.26 g/L KCl, and 1.5 g/L Na2HPO4, 1 M citrate; pH 5) to remove the unbound bacteria. Lastly, 200 μL of 0.5% (v/v) Triton X-100 (Sigma Aldrich®; catalog no. T8787) in PBS was added to remove adherent bacteria and the contents of each well were thoroughly mixed and plated to obtain final CFU/mL. Percent adherence was calculated relative to the initial CFU/mL determined prior to adhesion.
Caco-2 bacterial adhesion assay
Caco-2 adhesion assays and confocal imaging were performed in 24-well plates (Sarstedt; catalog no. 83.3922). Caco-2 cells were grown in an incubator at 37°C with 5% CO2 and 95% relative humidity to ~80–90% confluence in Minimum Essential Medium (Gibco™; catalog no. 2416804; MEM) containing 20% (v/v) fetal bovine serum (Gibco™; catalog no. 12483020; FBS) and 2 mM L-glutamine (Sigma Aldrich®; catalog no. G3126). On the day of experimentation, the cells were washed twice with PBS and subsequently placed in MEM prior to infection. Entire experiments were performed in technical duplicate in two identical plates, with one being used for CFU/mL analysis and the other for confocal imaging purposes. Overnight cultures of L. brevis ATCC 14869 were grown in advance in filter-sterilized, 1:9 diluted MRS with or without 10 mM ethanolamine and 150 nM adenosylcobalamin. The bacterial cells were centrifuged at 5000 × g for 10 minutes and resuspended in PBS. These cultures were then used to infect the wells containing Caco-2 cells (ATCC; HTB-37™). The cells were then incubated for 3 hours at 37°C in 5% CO2. Each well was washed thrice with PBS to remove all nonadherent bacteria. To calculate remaining CFU/mL of adherent bacteria, 0.4% (v/v) Triton X-100 in PBS was used to induce lysis of the Caco-2 cells. The contents of each well were thoroughly mixed, and the resulting suspension was used to calculate remaining CFU/mL. Relative adherence was calculated in relation to the adherent bacteria recovered from the cultures grown without ethanolamine or adenosylcobalamin. For imaging, a Nikon A1R confocal microscope was used. Prior to imaging, the wells were stained with 30 mM of Phalloidin for 30 minutes and 5 nM of DAPI for 5 minutes and were subsequently submerged in Prolong® Gold Antifade Reagent (ThermoFisher; catalog no. P36930). Images were acquired using both DIC and fluorescent modes, and subsequently overlayed using the Nikon A1R software to view multiple channels simultaneously.
Caco-2 competitive exclusion assay
Caco-2 competitive exclusion assays were performed in 24-well plates. Caco-2 cells were grown in an incubator at 37°C with 5% CO2 and 95% relative humidity to ~80–90% confluence in MEM containing 20% (v/v) FBS and 2 mM L-glutamine. On the day of experimentation, the cells were washed twice with PBS and subsequently placed in 1 mL of MEM. Overnight cultures of L. brevis ATCC 14869 were grown in filter-sterilized, 1:9 diluted MRS with or without 10 mM ethanolamine and 150 nM adenosylcobalamin. Overnight cultures of S. Typhimurium LT2 were grown in LB. Overnight cultures of L. brevis and S. Typhimurium contained approximately 1 × 10⁸ CFU/mL. The bacterial cells were centrifuged at 5000 × g for 10 minutes and resuspended in PBS. Next, Caco-2 cells were incubated with or without L. brevis ATCC 14869, which was grown overnight with or without ethanolamine and adenosylcobalamin, for 3 hours at 37°C in 5% CO2. Each well was subsequently washed with PBS to remove non-adhered bacteria. Cells were then placed in MEM before being infected with S. Typhimurium LT2 for 30 minutes under the same incubation conditions. Once again, each well was washed thrice with PBS to remove any unadhered bacteria. To calculate remaining CFU/mL of adherent bacteria, 0.4% (v/v) Triton-X100 was used to lyse the Caco-2 cells. The contents of each well were thoroughly mixed, and the resulting suspension was plated on both MRS and LB agar to calculate remaining CFU/mL of L. brevis and S. Typhimurium LT2, respectively. For L. brevis ATCC 14869, relative adherence was calculated in relation to the adherent bacteria recovered from the cultures grown without ethanolamine or adenosylcobalamin and incubated with the Caco-2 cells in MEM alone. For S. Typhimurium, relative adherence was similarly calculated in relation to bacteria recovered from wells incubated with S. Typhimurium alone.
Statistical analyses
GraphPad Prism v9.5.1 was used to perform most statistical analyses. The Shapiro–Wilk test or D’Agostino and Pearson test was used to assess normality. Normally distributed data were compared with an unpaired, two-tailed t test. One-way ANOVA was used for comparison of three or more independent groups, complemented with Tukey’s multiple-comparisons test. Nonparametric data were compared with an unpaired Mann–Whitney test or an unpaired, one-way Kruskal–Wallis test, complemented with Dunn’s multiple-comparison test. R v4.2.1 was used to analyze RNA sequencing data.
Author contributions
PPA, JAC and JPB conceived the study idea. PPA, JAC, GAS, WK, and AP developed and carried out the physical experiments. PPA, JAC, GAS, and WK performed the computational analysis. PPA wrote the original manuscript and designed the figures. All authors contributed critical feedback and helped shape the research, analysis, and final manuscript.
Disclosure statement
No potential conflict of interest was reported by the author(s).
Data availability statement
Illumina RNA sequencing reads can be found in NCBI under BioProject accession number PRJNA1001957.
Additional information
Funding
References
- Vance JE. Historical perspective: phosphatidylserine and phosphatidylethanolamine from the 1800s to the present. J Lipid Res. 2018;59(6):923–20. doi:10.1194/jlr.R084004.
- Kaval KG, Garsin DA, Sperandio V. Ethanolamine utilization in bacteria. mBio. 2018;9(1):e00066–18. doi:10.1128/mBio.00066-18.
- Patel D, Witt SN. Ethanolamine and phosphatidylethanolamine: partners in health and disease. Oxid Med Cell Longev. 2017;2017:1–18. doi:10.1155/2017/4829180.
- Pokhrel A, Kang SY, Schmidt-Dannert C. Ethanolamine bacterial microcompartments: from structure, function studies to bioengineering applications. Curr Opin Microbiol. 2021;62:28–37. doi:10.1016/j.mib.2021.04.008.
- Tsoy O, Ravcheev D, Mushegian A. Comparative genomics of ethanolamine utilization. J Bacteriol. 2009;191(23):7157–7164. doi:10.1128/JB.00838-09.
- Gonyar LA, Kendall MM, Bäumler AJ. Ethanolamine and choline promote expression of putative and characterized fimbriae in enterohemorrhagic Escherichia coli O157: H7. Infect Immun. 2014;82(1):193–201. doi:10.1128/IAI.00980-13.
- Luzader DH, Clark DE, Gonyar LA, Kendall MM. EutR is a direct regulator of genes that contribute to metabolism and virulence in enterohemorrhagic Escherichia coli O157: H7. J Bacteriol. 2013;195(21):4947–4953. doi:10.1128/JB.00937-13.
- Kendall MM, Gruber CC, Parker CT, Sperandio V, Handelsman J. Ethanolamine controls expression of genes encoding components involved in interkingdom signaling and virulence in enterohemorrhagic Escherichia coli O157: H7. mBio. 2012;3(3):10–128. doi:10.1128/mBio.00050-12.
- Bertin Y, Girardeau JP, Chaucheyras-Durand F, Lyan B, Pujos-Guillot E, Harel J, Martin C. Enterohaemorrhagic Escherichia coli gains a competitive advantage by using ethanolamine as a nitrogen source in the bovine intestinal content. Environ Microbiol. 2011;13(2):365–377. doi:10.1111/j.1462-2920.2010.02334.x.
- Rowley CA, Anderson CJ, Kendall MM, Lorenz M. Ethanolamine influences human commensal Escherichia coli growth, gene expression, and competition with enterohemorrhagic E. coli O157: H7. mBio. 2018;9(5):e01429–18. doi:10.1128/mBio.01429-18.
- Dadswell K, Creagh S, McCullagh E, Liang M, Brown IR, Warren MJ, McNally A, MacSharry J, Prentice MB. Bacterial microcompartment-mediated ethanolamine metabolism in Escherichia coli urinary tract infection. Infect Immun. 2019;87(8):10–128. doi:10.1128/IAI.00211-19.
- Sintsova A, Smith S, Subashchandrabose S, Mobley HL, Raffatellu M. Role of ethanolamine utilization genes in host colonization during urinary tract infection. Infect Immun. 2018;86(3):e00542–17. doi:10.1128/IAI.00542-17.
- Kofoid E, Rappleye C, Stojiljkovic I, Roth J. The 17-gene ethanolamine (eut) operon of Salmonella typhimurium encodes five homologues of carboxysome shell proteins. J Bacteriol. 1999;181(17):5317–5329. doi:10.1128/JB.181.17.5317-5329.1999.
- Stojiljkovic I, Bäumler AJ, Heffron F. Ethanolamine utilization in Salmonella typhimurium: nucleotide sequence, protein expression, and mutational analysis of the cchA cchB eutE eutJ eutG eutH gene cluster. J Bacteriol. 1995;177(5):1357–1366. doi:10.1128/jb.177.5.1357-1366.1995.
- Anderson CJ, Kendall MM. Location, location, location. Salmonella senses ethanolamine to gauge distinct host environments and coordinate gene expression. Microb Cell. 2016;3(2):89–91. doi:10.15698/mic2016.02.479.
- Anderson CJ, Clark DE, Adli M, Kendall MM, Baumler AJ. Ethanolamine signaling promotes Salmonella niche recognition and adaptation during infection. PLOS Pathog. 2015;11(11):e1005278. doi:10.1371/journal.ppat.1005278.
- Winter SE, Thiennimitr P, Winter MG, Butler BP, Huseby DL, Crawford RW, Russell JM, Bevins CL, Adams LG, Tsolis RM. et al. Gut inflammation provides a respiratory electron acceptor for Salmonella. Nature. 2010;467(7314):426–429. doi:10.1038/nature09415.
- Thiennimitr P, Winter SE, Winter MG, Xavier MN, Tolstikov V, Huseby DL, Sterzenbach T, Tsolis RM, Roth JR, Bäumler AJ. et al. Intestinal inflammation allows Salmonella to use ethanolamine to compete with the microbiota. Proc Natl Acad Sci USA. 2011;108(42):17480–17485. doi:10.1073/pnas.1107857108.
- Duary RK, Batish VK, Grover S. Expression of the atpD gene in probiotic Lactobacillus plantarum strains under in vitro acidic conditions using RT-qPCR. Res Microbiol. 2010;161(5):399–405. doi:10.1016/j.resmic.2010.03.012.
- Fraunhofer ME, Geißler AJ, Behr J, Vogel RF. Comparative genomics of Lactobacillus brevis reveals a significant plasmidome overlap of brewery and insect isolates. Curr Microbiol. 2019;76(1):37–47. doi:10.1007/s00284-018-1581-2.
- Sanchez B, Saad N, Schmitter JM, Bressollier P, Urdaci MC. Adhesive properties, extracellular protein production, and metabolism in the Lactobacillus rhamnosus GG strain when grown in the presence of mucin. J Microbiol Biotechnol. 2010;20(6):978–984. doi:10.4014/jmb.0911.11007.
- Sambuy Y, De Angelis I, Ranaldi G, Scarino ML, Stammati A, Zucco F. The Caco-2 cell line as a model of the intestinal barrier: influence of cell and culture-related factors on Caco-2 cell functional characteristics. Cell Biol Toxicol. 2005;21(1):1–26. doi:10.1007/s10565-005-0085-6.
- Garsin DA. Ethanolamine utilization in bacterial pathogens: roles and regulation. Nat Rev Microbiol. 2010;8(4):290–295. doi:10.1038/nrmicro2334.
- Ormsby MJ, Logan M, Johnson SA, McIntosh A, Fallata G, Papadopoulou R, Papachristou E, Hold GL, Hansen R, Ijaz UZ. et al. Inflammation associated ethanolamine facilitates infection by Crohn’s disease-linked adherent-invasive Escherichia coli. EBioMedicine. 2019;43:325–332. doi:10.1016/j.ebiom.2019.03.071.
- Sampson EM, Bobik TA. Microcompartments for B12-dependent 1,2-propanediol degradation provide protection from DNA and cellular damage by a reactive metabolic intermediate. J Bacteriol. 2008;190(8):2966–2971. doi:10.1128/JB.01925-07.
- Chen P, Andersson DI, Roth JR. The control region of the pdu/cob regulon in Salmonella typhimurium. J Bacteriol. 1994;176(17):5474–5482. doi:10.1128/jb.176.17.5474-5482.1994.
- Havemann GD, Sampson EM, Bobik TA. PduA is a shell protein of polyhedral organelles involved in coenzyme B(12)-dependent degradation of 1,2-propanediol in Salmonella enterica serovar typhimurium LT2. J Bacteriol. 2002;184(5):1253–1261. doi:10.1128/JB.184.5.1253-1261.2002.
- Rondon MR, Kazmierczak R, Escalante-Semerena JC. Glutathione is required for maximal transcription of the cobalamin biosynthetic and 1,2-propanediol utilization (cob/pdu) regulon and for the catabolism of ethanolamine, 1,2-propanediol, and propionate in Salmonella typhimurium LT2. J Bacteriol. 1995;177(19):5434–5439. doi:10.1128/jb.177.19.5434-5439.1995.
- Rondon MR, Horswill AR, Escalante-Semerena JC. DNA polymerase I function is required for the utilization of ethanolamine, 1,2-propanediol, and propionate by Salmonella typhimurium LT2. J Bacteriol. 1995;177(24):7119–7124. doi:10.1128/jb.177.24.7119-7124.1995.
- Sturms R, Streauslin NA, Cheng S, Bobik TA, Metcalf WW. In Salmonella enterica, ethanolamine utilization is repressed by 1,2-propanediol to prevent detrimental mixing of components of two different bacterial microcompartments. J Bacteriol. 2015;197(14):2412–2421. doi:10.1128/JB.00215-15.
- Zeng Z, Boeren S, Bhandula V, Light SH, Smid EJ, Notebaart RA, Abee T. Bacterial microcompartments coupled with extracellular electron transfer drive the anaerobic utilization of ethanolamine in Listeria monocytogenes. mSystems. 2021;6(2):e01349–20. doi:10.1128/mSystems.01349-20.
- Light SH, Su L, Rivera-Lugo R, Cornejo JA, Louie A, Iavarone AT, Ajo-Franklin CM, Portnoy DA. A flavin-based extracellular electron transfer mechanism in diverse Gram-positive bacteria. Nature. 2018;562(7725):140–144. doi:10.1038/s41586-018-0498-z.
- Goh YJ, Klaenhammer TR. Functional roles of aggregation-promoting-like factor in stress tolerance and adherence of Lactobacillus acidophilus NCFM. Appl Environ Microbiol. 2010;76(15):5005–5012. doi:10.1128/AEM.00030-10.
- Schachtsiek M, Hammes WP, Hertel C. Characterization of Lactobacillus coryniformis DSM 20001T surface protein cpf mediating coaggregation with and aggregation among pathogens. Appl Environ Microbiol. 2004;70(12):7078–7085. doi:10.1128/AEM.70.12.7078-7085.2004.
- Buck BL, Altermann E, Svingerud T, Klaenhammer TR. Functional analysis of putative adhesion factors in Lactobacillus acidophilus NCFM. Appl Environ Microbiol. 2005;71(12):8344–8351. doi:10.1128/AEM.71.12.8344-8351.2005.
- Farid W, Masud T, Sohail A, Ahmad N, Naqvi SMS, Khan S, Ali A, Khalifa SA, Hussain A, Ali S. et al. Gastrointestinal transit tolerance, cell surface hydrophobicity, and functional attributes of Lactobacillus acidophilus strains isolated from indigenous Dahi. Food Sci Nutr. 2021;9(9):5092–5102. doi:10.1002/fsn3.2468.
- de Souza BMS, Borgonovi TF, Casarotti SN, Todorov SD, Penna ALB. Lactobacillus casei and Lactobacillus fermentum strains isolated from mozzarella cheese: probiotic potential, safety, acidifying kinetic parameters and viability under gastrointestinal tract conditions. Probiotics Antimicrob Proteins. 2019;11(2):382–396. doi:10.1007/s12602-018-9406-y.
- Stuivenberg G, Daisley B, Akouris P, Reid G. In vitro assessment of histamine and lactate production by a multi-strain synbiotic. J Food Sci Technol. 2022;59(9):3419–3427. doi:10.1007/s13197-021-05327-7.
- Mead GC. Prospects for ‘competitive exclusion’ treatment to control salmonellas and other foodborne pathogens in poultry. Vet J. 2000;159(2):111–123. doi:10.1053/tvjl.1999.0423.
- Sajib M. 2018. Preparation and evaluation of arabinoxylan based prebiotics. Masters Thesis, Lunds University. https://www.lunduniversity.lu.se/lup/publication/8903875.
- Munir MA, Badri KH. The importance of derivatizing reagent in chromatography applications for biogenic amine detection in food and beverages. J Anal Methods Chem. 2020;2020:5814389. doi:10.1155/2020/5814389.
- Kim D, Paggi JM, Park C, Bennett C, Salzberg SL. Graph-based genome alignment and genotyping with HISAT2 and HISAT-genotype. Nat Biotechnol. 2019;37(8):907–915. doi:10.1038/s41587-019-0201-4.
- Liao Y, Smyth GK, Shi W. featureCounts: an efficient general purpose program for assigning sequence reads to genomic features. Bioinformatics. 2014;30(7):923–930. doi:10.1093/bioinformatics/btt656.
- Robinson MD, McCarthy DJ, Smyth GK. edgeR: a Bioconductor package for differential expression analysis of digital gene expression data. Bioinformatics. 2010;26(1):139–140. doi:10.1093/bioinformatics/btp616.
- Ye J, Coulouris G, Zaretskaya I, Cutcutache I, Rozen S, Madden TL. Primer-BLAST: a tool to design target-specific primers for polymerase chain reaction. BMC Bioinf. 2012;13(1):134. doi:10.1186/1471-2105-13-134.
- Livak KJ, Schmittgen TD. Analysis of relative gene expression data using real-time quantitative PCR and the 2(-delta delta C(T)) method. Methods. 2001;25(4):402–408. doi:10.1006/meth.2001.1262.
Appendix
Table A1. Levilactobacillus brevis ATCC 14869 qPCR primer sequences.
Figure A1. Ethanolamine promotes in vitro aggregation of Levilactobacillus brevis ATCC 14869.