
 ?Mathematical formulae have been encoded as MathML and are displayed in this HTML version using MathJax in order to improve their display. Uncheck the box to turn MathJax off. This feature requires Javascript. Click on a formula to zoom.
Abstract
The current mixers in the compressed air foam system used to generate liquid foam have high flow resistance. Kenics static mixer may be a better choice for making foam because its spiral structure can lower the flow resistance. However, the effects of the structure of Kenics static mixer on the properties of liquid foam remain unclear. The primary objective of this work is to study the influences of aspect ratio, transition angle, and the number of elements of Kenics static mixer on foaming performance and make the structural design optimization. The results indicated that the aspect ratio of the Kenics static mixer had the greatest impact on the foam properties, followed by the number of elements, and the transition angle had the smallest impact. The velocity distributions were distinct at the same relative position for different aspect ratios. When the number of elements exceeded four, the increase in the number of elements hardly changed the velocity distributions. The results also emphasized the critical role of velocity distribution in improving the coefficient of variation and elucidated a strong correlation between the coefficient of variation and foaming performance. The findings can offer guidance for the optimal design of the foam generator.
GRAPHICAL ABSTRACT
1. Introduction
Liquid foam has been used in many industrial fields such as fire fighting (Sheng et al., Citation2018), food process (Yu et al., Citation2022), dust control (Wang et al., Citation2012), enhanced oil recovery (Bera et al., Citation2017), and so forth in the past few decades. The physical properties of the liquid foam depend crucially on its structural properties including the foam expansion ratio ( = foam volume/liquid volume) and the bubble size distribution. A large number of foaming techniques have been developed in the past in order to control these parameters (Drenckhan & Saint-Jalmes, Citation2015; Stoffel et al., Citation2012). Unfortunately, to most users’ despair, a great majority of the current techniques typically cover only a relatively small range of these parameters and have low foaming efficiency.
Compared with the typical aspirated foam system, a compressed air foam system (CAFS) provides higher foaming efficiency and lower water consumption, and the expansion ratio of foam made by CAFS can be adjusted expediently to meet the needs of different industrial applications (Laundess et al., Citation2011, Citation2012). The foam generator is the core part of the CAFS. Many scholars have studied the optimization of the structure of foam generators in CAFS and they have mostly focused on baffle-type, mesh-type, and pore-type foam generators. Wang et al. (Citation2012) analyzed the key structural characteristic of baffle-type foam generators and they studied the speed and pressure distribution of the foam generator under different parameters. The results showed that when the vortex generator was 24 mm away from the throat and the baffle angle was 45°, the gas–liquid mixing strength in the foam generator reached the maximum. Lu et al. (Citation2015) designed a new spiral mesh foam generator and found that the pressure gradient gap between the top and bottom of the two ends of the foam generator strongly affected the foaming performance. Parikh (Citation2017) studied the foaming properties and pressure drop loss of chamber containing glass beads with different diameters and found that the bubble size decreased by increasing the chamber pressure. However, the above mentioned foam generators (baffle-type, mesh-type, and pore-type) used to make liquid foam have low gas–liquid mixing strength and high flow resistance. In addition, although the accuracy in simulating the ability to capture the flow field has been significantly improved with the development of CFD (Cao et al., Citation2022; Christafakis & Tsangaris, Citation2008; Sarmiento-Laurel et al., Citation2022; Stec & Synowiec, Citation2017), the structural optimization of foam generator was rarely studied by CFD simulation due to the vastly complex two-phase mixing of gas and foaming liquid involved. Therefore, it is necessary to explore a high-efficiency foam generator and use CFD software to simulate the turbulence characteristics of the flow field and foaming performance of the foam generator.
The Kenics static mixer is one of the most commonly used mixers for single-phase dispersion. Its spiral structure can lower flow resistance and guarantee adequate mixing strength. Many scholars have studied the mixing characteristics of the Kenics mixer (Hobbs & Muzzio, Citation1997, Citation1998a; Hosni et al., Citation2023; Jiang et al., Citation2021; Szalai & Muzzio, Citation2003). However, the previous works on the Kenics mixer focused on single-phase dispersion. The current understanding of the gas–liquid two-phase flow and the foaming behaviour of a Kenics mixer in the CAFS is still primitive and inadequate.
The objective of this work is to study the influences of the structure of Kenics static mixer on foaming performance and make the structural design optimization based on CFD simulation and experimental study. The main contributions of this work include three aspects: (1) The effects of the aspect ratio, transition angle, and the number of elements of Kenics static mixer on the foaming performance was investigated by experimental study, and the optimal structure of the Kenics static mixer for making liquid foam with small bubble size and high expansion ratio was determined. (2) A coupled Euler model and realizable model numerical simulation method were conducted within the Fluent framework to characterize the turbulence characteristics of the flow field during foaming. The correlation between flow field characteristics and the foaming performance of the Kenics static mixer was established. (3) A quantitative parameter was proposed to predict the foaming performance of the Kenics mixer and the feasibility was verified by experimental and numerical study. The research in this paper provides guidance for the application of CFD software in the structural optimization of foam generators and the development of new foam generators.
2. Experiments
2.1. Materials and methods
The commercial foaming agent used in this work was purchased from Jiangsu Jiangya Co., Ltd., from China. The foaming agent contains the mixtures of fluorocarbon surfactant Capstone 1157 and hydrocarbon surfactant alkyl polyglycoside. The structure of thes two surfactants can be found in previous literature (Yu et al., Citation2022, Citation2023). The commercial foaming agent is provided as the concentrate and thus the foaming liquid for making foam was diluted the concentrate with water at a ratio of 3:97 before use. The gas used for making foam in this work was air. The properties of the two fluids are shown in Table .
Table 1. Fluid properties.
Orthogonal experimental design is a method to study multifactor and multilevel optimization design by using mathematical statistics and orthogonality (Wang et al., Citation2022; Xiao et al., Citation2019). In this work, the three factors we choose are the number of elements, the aspect ratio and the transition angle of the static mixer, which are often referred in the literature (Kumar et al., Citation2008; Song & Han, Citation2005). The three levels of the number of units are 3, 4 and 5, the three levels of the aspect ratio are 1.0, 1.5 and 2.0, and the three levels of the transition angle are 45°, 60° and 90°. The table of the orthogonal test is shown in Table .
Table 2. Orthogonal experimental design.
2.2. Equipment and procedures
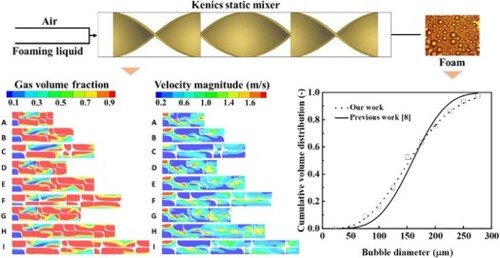
The compressed air foam system we built mainly included four parts: a compressed air supply system, a foaming liquid supply system, a foam generator, and a foam delivery pipe, as shown in Figure . The housing of the foam generator was made of acrylic material with an inner diameter (D) of 10 mm, a wall thickness of 2 mm and a length (L) of 240 mm. The mixers were fabricated by a 3D printer with nylon material, as shown in Figure . The liquid foam supply system was connected directly to the inlet of the foam generator. The inlet gas flow and liquid flow
were obtained by the gas and liquid flow meters, respectively. The gas–liquid pressure was measured by a YB80A high-precision digital display pressure gauge.
Figure 1. Schematic diagram of the compressed air foam system (CAFS) with a three-element Kenics mixer.

Figure 2. Photographs of the Kenics mixer fabricated by 3D printing.

Before the experiment, we opened the inlet on the vessel and poured 30 L foaming solution into the vessel. Then, the inlet was closed, and the digital pressure gauge was opened. The gas and liquid pressures were adjusted to the experimental values (∼0.4 MPa). After the gas and liquid pressures were stabilized, the flow rate was adjusted to the experimental value by regulating valves. After approximately 15 s of foam production, a certain amount of foam was collected for measurement of bubble size and expansion ratio.
2.3. Characterization of foam properties
2.3.1. Expansion ratio
The foam expansion ratio is defined as the ratio of the volume of air and solution in the foam. Ideally, the air is completely sucked in liquid to produce foam, and all air and solution contribute to foam production (Harding et al., Citation2016; Jiang et al., Citation2019; Liu et al., Citation2022; Souidi et al., Citation2012; Wang et al., Citation2014). The expansion ratio of the foam can be approximated by the following formula:
(1)
(1) Here, Vfoam is the foam volume, and Mfoam is the foam mass. In the experiment, we used a beaker to collect 500 ml foam and then measured the quality of the foam on a balance (Shimadzu, Japan).
2.3.2. Average bubble diameter and bubble size distribution
We observed and recorded bubble size through a microscope and measured bubble diameter and size distribution of the bubbles using Image J software. As shown in Figure a, two coverslips were placed on the glass slide with a thickness of 150 (2 h), and there was a certain space for placing the foam between the two coverslips. A small amount of the fresh foam was dipped in a glass rod and placed between two coverslips. To form a monolayer of bubbles for clear observation, a syringe containing foaming liquid was used to flush the bubbles. After forming a monolayer of bubbles, two coverslips were covered with another coverslip and placed under a microscope for observation. We used Scope Image 9.0, an advanced image processing software paired with a microscope, to capture bubble images. Finally, the image was processed by image J software to calculate the average bubble size and bubble size distribution. When the measured bubble diameter
, the bubble is not squeezed, and the true bubble diameter is
. When the measured bubble diameter
, the bubble is squeezed to produce deformation; thus,
is not the true bubble diameter. In this case, Gaillard et al. proposed a more precise way to approximate the true bubble diameter (Gaillard et al., Citation2015):
(2)
(2) Here,
,
is the refractive index (
),
is the radius of the circular light source of the microscope, and
is the distance between the slide and the circular light source of the microscope.
Figure 3. (a) Setup of the apparatus for bubble size measurement. (b) Schematic diagram of the liquid drainage apparatus.

2.3.3. 25% drainage time
We used the drainage apparatus in Figure b to measure the 25% drainage time of the foam. The drainage apparatus was mainly made of plexiglass and consisted of two parts: the upper foam receiver (containing a filter) for collecting the foam, and the lower receiving pot for collecting the drained liquid. The 25% drainage time was measured as follows. We first measured the mass of the drainage apparatus and then injected the foam into the foam receiver. When the receiver was filled with foam, we opened the timer and placed the receiver on the balance to measure the mass
. The foam receiver was finally fixed on the bracket, and the drainage receiving tank was placed directly below. The knob at the connection was adjusted to make the drained liquid flow down, and a digital balance was used to record the liquid quality
. When
, we paused the timer and recorded the 25% drainage time.
3. Numerical simulation
3.1. Euler model of multiphase flow
The Euler model is the most complex multiphase flow model. Conservation equations of mass, momentum, energy and volume fraction of each phase are solved in this model and are presented below.
3.1.1. Mass equation
In the Euler model of multiphase flow, the continuity equation of the phase is:
(3)
(3) where
are the volume fraction, density, and velocity of the
phase, respectively, and
is the mass transfer from the
phase to the
phase.
3.1.2. Momentum equation
The momentum conservation equation for the phase is:
(4)
(4) where
is the pressure common to all phases,
is the pressure-strain tensor of the q phase,
(
) is the relative velocity of the two phases, and
and
are the interphase force, body force, lift force, virtual mass force, wall slip force, and turbulent dispersion force, respectively.
It can be seen from the momentum conservation equation that six forces are involved in the simulation. Next, we will analyze in detail which forces are appropriate in our simulations.
Interphase force
Momentum exchange between the phases is based on the value of the fluid-fluid exchange coefficient because the interphase forces
. The exchange coefficient is related to
(the drag function, which is defined differently for the different exchange-coefficient models). Considering the actual situation, we chose the Schiller-Naumann model (Wang et al., Citation2015).
Body force
During our simulation, we take gravity into account for the body force, and the magnitude of the acceleration of gravity is 9.81 m/s2.
Lift force
Lift forces are not appropriate for closely packed particles or very small particles. In the actual foaming process, the diameter of the bubble is less than 1 mm, and bubbles are tightly packed, so the lift force does not need to be considered. Some previous studies did not consider the lift force when studying bubbles generated by gas–liquid mixing (Chen et al., Citation2005; Krishna et al., Citation2001; Van Baten & Krishna, Citation2003).
Virtual mass force
The virtual mass effect is significant when the secondary phase density is much smaller than the primary phase density. Therefore, we considered this force.
Wall slip force
In the actual foaming process, the slip velocity is very small, the phase relative velocity component tangential to the wall surface is smaller. Therefore, we did not consider the wall slip force in the simulation.
Turbulent dispersion force
The turbulent dispersion force accounts for the interphase turbulent momentum transfer. It acts as a turbulent diffusion in dispersed flows. In our case, the effect of this force should be small, so we ignore the turbulent dispersion force.
In summary, the various forces and their models used in the simulation are shown in Table .
Table 3. The various forces and their models used in the simulation.
3.1.3. Energy equation
To describe the conservation of energy in Eulerian multiphase applications, a separate enthalpy equation can be written for each phase:
(5)
(5) where
is the specific enthalpy of the
phase,
is the heat flux,
is the intensity of heat exchange between the
and
phases,
is the interphase enthalpy (for example, the enthalpy of the vapour at the temperature of the droplets, in the case of evaporation),
is the enthalpy of species
in phase
, and
is the diffusive flux of species
in phase
. The last term in the equation represents energy transfer due to species diffusion.
3.1.4. Turbulence equation
The flow involved in the production of foam is generally turbulent. For CFD analysis, various models can be used to analyze Reynold’s average Navier–Stokes (RANS) equation, in which flow quantities decomposed into mean and fluctuating parts by which approximate the equations. For the flow conditions far away from the wall, the results of the model are more accurate because it contains complex nonlinear damping functions (Panchigar et al., Citation2022) which helps to reduce computational time in our work. Therefore, the
model is uesd in our simulation.
3.2. Boundary conditions and solution method
Air is set as the primary phase, and velocity inlet boundary conditions are employed. The inlet velocity is set as 0.566 m/s. Foaming liquid is set as the secondary phase, and the inlet is the velocity inlet. According to the gas–liquid ratio, the inlet velocities are 0.175, 0.131, 0.0955, and 0.07 m/s. The outlet is set as the pressure outlet boundary condition. The hydraulic diameters of the air inlet, foam solution inlet, and outlet are set as 0.011, 0.015, and 0.016 m, respectively. The turbulence intensities of all the inlets and outlets were set as 5%.
The simulations are performed using the ANSYS Fluent 19.0 solver. The solver utilizes the finite-volume method to discretize the partial differential equations into a system of algebraic equations. The pressure-based solver and the steady calculation model are adopted. The mixed model is adopted, the first-order upwind is selected for the spatial discrete scheme, and an initial value is obtained after calculation. Then, on this basis, the Euler model is used, and the second-order upwind scheme is used for the calculation to obtain a more accurate solution. The convergence criterion is set to for the residuals of the continuity equation, momentum equation, energy equation, volume fraction equation, and turbulence equations. We choose hybrid initialization as the initialization scheme which provides better initial pressure and velocity fields than standard initialization for flows with complex geometries.
3.3. Coefficient of variation
The mixing uniformity is one of the most important parameters to characterize the mixing performance. The most common measure used to describe the mixture homogeneity is the coefficient of variation (), which shows the deviation from the average mixture composition.
can be determined based on statistical analysis using the following equation (Hobbs & Muzzio, Citation1998; Stec & Synowiec, Citation2019):
(6)
(6) Here
,
is obtained by randomly taking more than 2000 points in the outlet section and then calculating the average gas volume fraction at all points. In the follow work, we believe that the smaller the value of
is, the better the gas–liquid mixing effect.
3.4. Grid independence
The grids are generated using ICEM CFD software. We adopt structured grids, as shown in Figure . The mesh quality is above 0.4. A grid independence analysis is conducted with three different sizes of the grid, i.e. 5.0, 1.0, and 0.8. The coefficient of variation is basically the same when the size of grids is 1.0 and 0.8, as shown in Figure . Therefore, the size of the grid used in this work was 0.8.
Figure 4. Mesh generation and independence analysis. (a) The fluid domain of Kenics static mixer. (b) Structured mesh of Kenics static mixer with three elements. (c) Structured mesh of Kenics static mixer in a view parallel to the flow direction. (d) CoV under different grid sizes.

4. Results and discussion
4.1. Experimental and numerical results
A comparison between the experimental and numerical results of the nine cases is shown in Figure . As illustrated in Figure a, foams created by mixer A and D have relatively low expansion ratios among all cases, whereas the foam formed by mixer F has the highest expansion ratio. This is due to the fact that the mixer A and D have larger CoV, resulting in a weaker turbulent mixing effect. The expansion ratio of foam can reflect the efficiency of gas utilization during foam generation. As CoV is reduced, the mixing efficiency, the utilization rate of gas, and the expansion ratio of foam are expected to increase under the same conditions. The above results indicate the consistency of the experimental and numerical data. This means that in the practical engineering application of optimizing the structure of foam generator, we can take the CoV as the index to evaluate the foaming performance of foam generator, and determine the optimal structure according to the CoV, so as to improve the foaming efficiency of foam generator.
Figure 5. Experimental and numerical results of nine cases at four air-liquid ratios. (a) The expansion ratio of foam. (b) Average bubble diameter of foam. (c) 25% drainage time of foam. (d) of the exit section of Kenics mixer with different structures.

Obviously, for the cases using mixer A and D, the foam has larger bubble diameters than the other cases in Figure b. This is due to mixer A and D having bigger CoV, resulting in a weaker turbulent mixing effect. Previous studies pointed out that the larger turbulence effect was the main reason for producing the foam with a smaller bubble diameter (Chu et al., Citation2019; Deane & Stokes, Citation2002). As indicated in Figure c, the foam produced by mixer A and D has the shortest 25% drainage time, which demonstrates their poor foam stability. In addition to the gas–liquid ratio of 6:1, the foam produced by mixer F has the longest liquid drainage time. The drainage time of the foam is affected by both the expansion ratio and the bubble size. Sarma et al. reported that a greater expansion ratio and a more uniform bubble size distribution yield a more stable foam with a longer drainage time (Sarma & Khilar, Citation1988). Previous studies also showed that the drainage time becomes longer by decreasing bubble size (Magrabi et al., Citation2002; Rand & Kraynik, Citation1983). The cross-sectional area of the liquid drainage channel (Plateau border) is proportional to the square of the bubble radius and the drainage rate of foam is roughly proportional to the fourth power of the Plateau border size (Magrabi et al., Citation2002). The expansion ratios of foam produced by mixer A and D are smaller and the average bubble diameters are larger than in other cases. And Figures and show that their bubble size distributions are very inhomogeneous. Therefore, foams produced by mixer A and D have relatively fast liquid drainage rates and poor foam stability, while the foam produced by mixer F has better stability.
Figure 6. Bubble images at the air-liquid ratio of 8:1. Image of bubbles produced by (a) mixer A, (b) mixer D, (c) mixer F, and (d) mixer I.

Figure 7. Bubble size distribution of foam produced by nine mixers at the air-liquid ratios of (a) 6:1, (b) 8:1, (c) 11:1, and (d) 15:1.

Laundess et al. (Citation2011) studied the size distribution of compressed air foam and found that the size distribution of compressed air foam follows the Rosin/Rammler curve.
(7)
(7) Here, Q represents the cumulative volume distribution and
is the bubble diameter (μm). The Rosin/Rammler parameter q represents the distribution of bubble sizes. Laundess et al. found that the size distribution of compressed air foam with an expansion ratio of 7.0 produced using FC-600 surfactant followed the Rosin/Rammler curve of q = 20. The expansion ratio of the foam produced by the nine Kenics static mixers is different at the same gas–liquid ratio. Therefore, we only use the Rosin/Rammler curve to fit the size distribution of foam produced by I with an expansion ratio of 7.0 (±0.2) for comparison. The fitted curve is shown in Figure .
Figure 8. Cumulative bubble size distributions.

The fitted curve with in Figure shows that the Rosin/Rammler curve can well describe the bubble size distribution of compressed air foam. The foam produced by the Kenics static mixer follows the Rosin/Rammler curve of q = 14.6 at the foam expansion ratio of 7.0. This value is different from the value in the literature (q = 20) (Laundess et al., Citation2011). There are two main reasons: (1) The surfactant they use is FC-600, which is different from the surfactant we use. It is well known that the choice of different kinds of surfactant during foaming will produce foam with different properties. (2) The foaming apparatus we use is different. As shown in Figure , our foam has a higher cumulative frequency at small foam diameters (25-175 μm) and lower cumulative frequencies at larger foam diameters (175-300 μm) and our foam has a smaller average bubble size.
To determine what causes the different properties of foam produced by Kenics static mixer with different structures, we further show a cloud map of gas volume and mixture velocity distribution, as shown in Figures and . Figure shows that the gas volume distribution of the last element of mixer F is almost unchanged along the z direction and the gas volume and velocity distributions are very uniform. However, the gas volume and velocity field in the last element of mixer A and D are not fully developed (Figure ). When it comes to the mixture velocity contours in Figure , the outflow velocity distribution of mixer F where the volume distribution of the gas is rather homogeneous is practically symmetrical about the centre of the cross-sectional circle. In comparison, the velocity distribution on the two semicircles of the other cases, particularly for mixer A and D which have poor gas uniformity, is quite unequal. We can reasonably deduce that the gas volume distribution is closely related to the velocity distribution of the air–liquid mixture over the cross-section and the symmetry of velocity significantly affects the gas–liquid mixing effect and the foaming performance. Therefore, when using the spiral-type foam generator, one should reasonably consider its structure to produce a uniform velocity distribution, so as to produce a higher mixing effect and improve the foaming performance of the foam generator.
Figure 9. Simulation results of the Kenics static mixer (Y-Z plane) with a gas-liquid ratio of 8:1. (a) The gas volume contours of the Y-Z plane. (b) The mixture velocity contours of the Y-Z plane.

Figure 10. Simulation results of the Kenics static mixer (X-Y plane) with a gas-liquid ratio of 8:1. (a) The gas volume contours of the outlet section of the X-Y plane. (b) The mixture velocity contours of the outlet section of the X-Y plane.

Next, we discuss the influence of the number of elements, transition angle, and aspect ratio of the Kenics static mixer on the foaming performance.
4.2. Influence of the aspect ratio on mixing and foaming performance
Figure shows the influence of the aspect ratio on the mixing and foaming performance. The experimental results reveal that with the increase in the aspect ratio, the expansion ratio and 25% drainage time increase, and the average bubble diameter decreases. Numerical findings also suggest that increasing the aspect ratio helps to enhance the mixing performance of the Kenics mixer, as shown in Figure d.
Figure 11. Influence of the aspect ratio on mixing performance at different gas-liquid ratios. (a) Expansion ratio for different aspect ratios. (b) Average bubble diameter for different aspect ratios. (c) 25% drainage time for different aspect ratios. (d) for different aspect ratios.

We analyze the velocity distribution at the same relative location (X = 0, L/8, L/4, 3 L/8, L/2, 5 L/8, 3 L/4, 7 L/8, and L) under different aspect ratios in Figure . Figure a shows the planar cross-sections from the second element of the Kenics static mixer. Figure b shows the mixed velocity contours at the same relative positions of mixer A, F, and H at the gas–liquid ratio of 8:1. They all have 90° transition angles but they have various aspect ratios of 1, 1.5, and 2.0. Our results indicate that the velocity field at L/8 to 7L/8 is essentially constant for the three aspect ratios. To put it another way, the flow is fully developed, and the transition from element 2 to element 3 has a negligible effect on the flow field within the range from L/4 to 7L/8. The flow fields of the two sections of 0 to L/8 and 7L/8 to L (about 25% of the length of the mixer element) are affected by the element-to-element transition region. This is basically consistent with previous work (Kumar et al., Citation2008). We can see that the velocity distributions are distinct at the same relative position for different aspect ratios, which is inconsistent with Hobbs’ findings, as we simulate gas–liquid two-phase mixing while the works by Hobbs et al. focused on single-phase dispersion (Hobbs & Muzzio, Citation1998a).
Figure 12. (a) The cross-sectional planes from the second element of the Kenics static mixer. (b) Contours of the mixture velocity at the same relative position for different aspect ratios.

It is difficult to judge the influence of different aspect ratios on the turbulence efficiency only from the velocity cloud contours, thus we show the absolute values of the velocity gradients on four straight lines between the X = 0 and X = L cross-sections, namely, ae, bf, cg, and dh, to quantitatively compare the turbulence effectiveness of various aspect ratios. The results are displayed in Figure . The turbulence efficiency is expected to rise as the absolute value of the velocity gradient increases. After calculation, we found that the turbulence efficiency of Kenics mixer with an aspect ratio of 1.5 is 120% of that with an aspect ratio of 1.0, and the turbulence efficiency of Kenics mixer with an aspect ratio of 2.0 is 126% of that with an aspect ratio of 1.0. On the one hand, the amount of gas wrapped around the liquid to make foam rises due to the increased turbulence efficiency, which increases the expansion ratio. On the other hand, the larger turbulence efficiency leads to the increase of contact frequency between bubbles and a decrease of bubble size.
Figure 13. (a) Position of four lines on the fluid domain. (b) Position of 8 points on the X-Y plane. The absolute values of the velocity gradients of (c) ae, (d) bf, (e) cg, and (f) dh.

4.3. Influence of the transition angle on mixing and foaming performance
According to the experimental results (Figure ), when the transition angle increases, the expansion ratio and the 25% drainage time slightly rise and the average bubble diameter decreases. The difference in the value of the CoV at different transition angles is not obvious, as depicted in Figure d.
Figure 14. Influence of the transition angle on mixing performance. (a) Expansion ratio for different transition angles. (b) Average bubble diameter for different transition angles. (c) 25% drainage time for different transition angles. (d) for different transition angles.

Similar to our previous analysis of the aspect ratio, we also used velocity contours to analyze how transition angles affect the mixing performance. For the air–liquid ratio of 8:1, we choose velocity contours at the same relative position from the mixer B, E, and H for analysis, as illustrated in Figure . From Figure , we can see that the velocity distributions are distinct at the same relative position for different transition angles. This indicates that changing the transition angle has little effect on the velocity distribution. In other words, the change in transition angle does not affect the mixing efficiency of the mixer element. This is consistent with our CoV results in Figure d. Thus, transition angle has little effect on the properties of the generated foam, as shown in Figure a-14c.
Figure 15. Contours of the mixture velocity at the same relative position for various transition angles.

4.4. Influence of the number of elements on mixing and foaming performance
In Figure , the value of the coefficient of variation decreases as the number of elements rises, while the expansion ratio rises, the average bubble diameter decreases, and the 25% drainage time increases. We also found that the difference in properties of foam made by a three-element mixer and a four-element mixer is greater than that in properties of foam made by a four-element mixer and a five-element mixer. When the number of elements is 4 and 5, the results of CoV, average bubble diameter, and the 25% drainage time are quite near.
Figure 16. Influence of the number of elements on mixing performance. (a) Expansion ratio for different numbers of elements. (b) Average bubble diameter for different numbers of elements. (c) 25% drainage time for different numbers of elements. (d) for different numbers of elements.

As shown in Figure , the velocity for the first element changes greatly along the X direction due to strong turbulence and an unstable velocity field. The velocity curve progressively becomes flat after the flow passes through the second and third elements. The similarity between the velocity distributions of the fourth and fifth elements, suggests that the flow field has been stabilized. It is clear that as the number of elements rises from three to four, the turbulence field expands. The usage of gas is more effective and the foam expansion ratio becomes higher. When the number of elements exceeds four, the increase in the element number hardly improve the mixing uniformity and foam properties. In this case, the increase in the number of elements helps maintain the original flow field rather than enhancing the turbulence intensity.
Figure 17. Velocity magnitude of the same relative locations under different numbers of elements.

According to the above results, we found that the aspect ratio had the greatest impact on the foaming efficiency of the foam generator, followed by the number of units, and the transition angle was the smallest. This suggests that when optimizing the structure of the foam generator, we should focus on the effect of aspect ratio to maximize the foaming efficiency while controlling the cost.
5. Conclusion
In this work, we developed a series of Kenics static mixers to produce liquid foam in a compressed air foam system (CAFS). A coupled Euler model and realizable model numerical simulation method were conducted within the Fluent framework to study the effects of the aspect ratio, transition angle, and the number of elements on the turbulence characteristics of the flow field and foaming performance of Kenics static mixer. The conclusions were as follows:
In the compressed air foam system, the bubble size distribution of foam made by Kenics static mixers follows the Rosin/Rammler curve and its cumulative frequency at small bubble diameters is higher than that of previous works (Laundess et al., Citation2011). Improving the symmetry of the velocity field helps to enhance the gas–liquid mixing strength, reduce the bubble size and increase the foam expansion ratio. The coefficient of variation (CoV) acquired by CFD simulation can explain the variations in expansion ratio, bubble size, and 25% drainage time of liquid foam in the experiment and we highlight that the CoV can be used to predict the foaming performance of the Kenics static mixer.
The velocity distributions are distinct at the same relative position for different aspect ratios, but the effect of element-to-element transition for various aspect ratios is essentially the same, accounting for about 25% of the entire flow field. The aspect ratio has the maximum influence on foaming performance because the increase in the aspect ratio gives rise to an increase in turbulence length, which enhances the air–liquid mixing strength. The aspect ratio of 2.0 in our work offers superior foaming performance.
When the number of elements exceeds four, increasing the number of elements will not affect the foam properties. In this case, velocity distributions are not changed and the increase in the number of elements helps to maintain the original flow field rather than enhance the turbulence efficiency. The four-element Kenics static mixer can be used as the foam generator because it provides high foaming performance and takes up less space.
The transition angle has little impact on the foaming performance of the Kenics static mixer. Our findings show that the velocity distributions are nearly identical at the same relative position for various transition angles. The ideal transition angle of Kenics static mixer to produce liquid foam is 90° in our work.
In this work, we mainly focused on the influence of the structure of the Kenics static mixer on the foam properties including bubble size and expansion ratio. The limitation of this work is that we did not consider how changes in bubble size and expansion ratio affect the pressure drop of the Kenics static mixer. The pressure loss in the foam generator is the critical factor that affects the foaming efficiency of the CAFS, and a detailed pressure drop model will be proposed in future work.
Disclosure statement
The authors declare that they have no known competing financialinterests or personal relationships that could have appeared to influence the work reported in this paper.
Additional information
Funding
References
- Bera, A., Mandal, A., Belhaj, H., & Kumar, T. (2017). Enhanced oil recovery by nonionic surfactants considering micellization, surface, and foaming properties. Petroleum Science, 14(2), 362–371. https://doi.org/10.1007/s12182-017-0156-3
- Cao, Z., Song, C., Gao, X., Zhang, X., Zhang, F., & Liu, B. (2022). Effects of pulsed endwall air injection on corner separation and vortical flow of a compressor cascade. Engineering Applications of Computational Fluid Mechanics, 16(1), 879–903. https://doi.org/10.1080/19942060.2022.2046643
- Chen, P., Duduković, M., & Sanyal, J. (2005). Three-dimensional simulation of bubble column flows with bubble coalescence and breakup. AIChE Journal, 51(3), 696–712. https://doi.org/10.1002/aic.10381
- Christafakis, A. N., & Tsangaris, S. (2008). Two-phase flows of droplets in contractions and double bends. Engineering Applications of Computational Fluid Mechanics, 2(3), 299–308. https://doi.org/10.1080/19942060.2008.11015230
- Chu, P., Finch, J., Bournival, G., Ata, S., Hamlett, C., & Pugh, R. J. (2019). A review of bubble break-up. Advances in Colloid and Interface Science, 270(270), 108–122. https://doi.org/10.1016/j.cis.2019.05.010
- Deane, G. B., & Stokes, M. D. (2002). Scale dependence of bubble creation mechanisms in breaking waves. Nature, 418(6900), 839–844. https://doi.org/10.1038/nature00967
- Drenckhan, W., & Saint-Jalmes, A. (2015). The science of foaming. Advances in Colloid and Interface Science, 222, 228–259. https://doi.org/10.1016/j.cis.2015.04.001
- Gaillard, T., Honorez, C., Jumeau, M., Elias, F., & Drenckhan, W. (2015). A simple technique for the automation of bubble size measurements. Colloids and Surfaces A: Physicochemical and Engineering Aspects, 473, 68–74. https://doi.org/10.1016/j.colsurfa.2015.01.089
- Harding, B., Zhang, B., Liu, Y., Chen, H., & Mannan, M. S. (2016). Improved research-scale foam generator design and performance characterization. Journal of Loss Prevention in the Process Industries, 39, 173–180. https://doi.org/10.1016/j.jlp.2015.11.016
- Hobbs, D., & Muzzio, F. (1997). The kenics static mixer: A three-dimensional chaotic flow. Chemical Engineering Journal, 67(3), 153–166. https://doi.org/10.1016/S1385-8947(97)00013-2
- Hobbs, D., & Muzzio, F. (1998). Optimization of a static mixer using dynamical systems techniques. Chemical Engineering Science, 53(18), 3199–3213. https://doi.org/10.1016/S0009-2509(98)00115-8
- Hosni, M., Hammoudi, M. H., Si-Ahmed, E. K., Legrand, J., & Douib, L. (2023). Single and two-phase flows in a horizontal pipe with a kenics static mixer: Effect of pressure drop on mixing. The Canadian Journal of Chemical Engineering, 101(2), 828–844. https://doi.org/10.1002/cjce.24402
- Jiang, X., Xiao, Z., Jiang, J., Yang, X., & Wang, R. (2021). Effect of element thickness on the pressure drop in the kenics static mixer. Chemical Engineering Journal, 424, 130399. https://doi.org/10.1016/j.cej.2021.130399
- Jiang, Z., Li, W., Liu, X., Li, B., & Liu, L. (2019). Experimental study of the effects of a Low-expansion foam generator structure on the foaming quality. 2019 9th International Conference on Fire Science and Fire Protection Engineering (ICFSFPE), 2019.10.18-2019.10.20, https://doi.org/10.1109/icfsfpe48751.2019.9055765.
- Krishna, R., Van Baten, J., Urseanu, M., & Ellenberger, J. (2001). A scale up strategy for bubble column slurry reactors. Catalysis Today, 66(2-4), 199–207. https://doi.org/10.1016/S0920-5861(00)00641-6
- Kumar, V., Shirke, V., & Nigam, K. (2008). Performance of kenics static mixer over a wide range of Reynolds number. Chemical Engineering Journal, 139(2), 284–295. https://doi.org/10.1016/j.cej.2007.07.101
- Laundess, A. J., Rayson, M. S., Dlugogorski, B. Z., & Kennedy, E. M. (2011). Small-scale test protocol for firefighting foams DEF (AUST) 5706: Effect of bubble size distribution and expansion ratio. Fire Technology, 47(1), 149–162. https://doi.org/10.1007/s10694-009-0136-2
- Laundess, A. J., Rayson, M. S., Dlugogorski, B. Z., & Kennedy, E. M. (2012). Suppression performance comparison for aspirated, compressed-air and in situ chemically generated class B foams. Fire Technology, 48(3), 625–640. https://doi.org/10.1007/s10694-010-0155-z
- Liu, Y., Jing, M., Xu, R., Luan, X., Jiang, J., & Zhang, B. (2022). Study of key properties of expansion foam for process safety incident mitigation using an improved foam generator. Journal of Loss Prevention in the Process Industries, 74, 104661. https://doi.org/10.1016/j.jlp.2021.104661
- Lu, X., Wang, D., Shen, W., Wang, H., Zhu, C., & Liu, J. (2015). Experimental investigation of the pressure gradient of a new spiral mesh foam generator. Process Safety and Environmental Protection, 94, 44–54. https://doi.org/10.1016/j.psep.2014.12.002
- Magrabi, S., Dlugogorski, B. Z., & Jameson, G. (2002). A comparative study of drainage characteristics in AFFF and FFFP compressed-air fire-fighting foams. Fire Safety Journal, 37(1), 21–52. https://doi.org/10.1016/S0379-7112(01)00024-8
- Panchigar, D., Kar, K., Shukla, S., Mathew, R. M., Chadha, U., & Selvaraj, S. K. (2022). Machine learning-based CFD simulations: A review, models, open threats, and future tactics. Neural Computing and Applications, 34(24), 21677–21700. https://doi.org/10.1007/s00521-022-07838-6
- Parikh, D. (2017). Experimental study of pressure drop and bubble size in a laboratory scale compressed air foam generation system. Colorado School of Mines.
- Rand, P. B., & Kraynik, A. M. (1983). Drainage of aqueous foams: Generation-pressure and cell-size effects. Society of Petroleum Engineers Journal, 23(01), 152–154. https://doi.org/10.2118/10533-PA
- Sarma, D. S. R., & Khilar, K. C. (1988). Effects of initial gas volume fraction on stability of aqueous air foams. Industrial & Engineering Chemistry Research, 27(5), 892–894. https://doi.org/10.1021/ie00077a029
- Sarmiento-Laurel, C., Cardemil, J. M., & Calderón-Muñoz, W. R. (2022). Local entropy generation model for numerical CFD analysis of fluid flows through porous media, under laminar and turbulent regimes. Engineering Applications of Computational Fluid Mechanics, 16(1), 804–825. https://doi.org/10.1080/19942060.2022.2040595
- Sheng, Y., Lu, S., Jiang, N., Wu, X., & Li, C. (2018). Drainage of aqueous film-forming foam stabilized by different foam stabilizers. Journal of Dispersion Science and Technology, 39(9), 1266–1273. https://doi.org/10.1080/01932691.2017.1393432
- Song, H.-S., & Han, S. P. (2005). A general correlation for pressure drop in a kenics static mixer. Chemical Engineering Science, 60(21), 5696–5704. https://doi.org/10.1016/j.ces.2005.04.084
- Souidi, K., Mardaru, A., Roudet, M., Marcati, A., Della Valle, D., & Djelveh, G. (2012). Effect of impellers configuration on the gas dispersion in high-viscosity fluid using narrow annular gap unit. Part 1: Experimental approach. Chemical Engineering Science, 74, 287–295. https://doi.org/10.1016/j.ces.2012.02.055
- Stec, M., & Synowiec, P. M. (2017). Study of fluid dynamic conditions in the selected static mixers part I—research of pressure drop. The Canadian journal of chemical engineering, 95(11), 2156–2167. https://doi.org/10.1002/cjce.22929
- Stec, M., & Synowiec, P. M. (2019). Study of fluid dynamic conditions in the selected static mixers part III—research of mixture homogeneity. The Canadian Journal of Chemical Engineering, 97(4), 995–1007. https://doi.org/10.1002/cjce.23290
- Stoffel, M., Wahl, S., Lorenceau, E., Höhler, R., Mercier, B., & Angelescu, D. E. (2012). Bubble production mechanism in a microfluidic foam generator. Physical Review Letters, 108(19), 198302. https://doi.org/10.1103/PhysRevLett.108.198302
- Szalai, E., & Muzzio, F. (2003). Fundamental approach to the design and optimization of static mixers. AIChE Journal, 49(11), 2687–2699. https://doi.org/10.1002/aic.690491103
- Van Baten, J., & Krishna, R. (2003). Comparison of hydrodynamics and mass transfer in airlift and bubble column reactors using CFD. Chemical Engineering & Technology: Industrial Chemistry-Plant Equipment-Process Engineering-Biotechnology, 26(10), 1074–1079. https://doi.org/10.1002/ceat.200301796
- Wang, H., Wang, D., Tang, Y., Qin, B., & Xin, H. (2014). Experimental investigation of the performance of a novel foam generator for dust suppression in underground coal mines. Advanced Powder Technology, 25(3), 1053–1059. https://doi.org/10.1016/j.apt.2014.02.011
- Wang, H. T., Wang, D. M., & Ren, W. X. (2012). Computer simulation on key structure parameters of foam generator for dust control in underground coal mines. Advanced Materials Research, 466, 421–424. http://doi.org/10.4028/www.scientific.net/amr.466-467.421
- Wang, L., Jia, Y., Yan, X., & Zhou, C. (2015). Gas–liquid numerical simulation on micro-bubble generator and optimization on the nozzle-to-throat spacing. Asia-Pacific Journal of Chemical Engineering, 10(6), 893–903. https://doi.org/10.1002/apj.1926
- Wang, X., Ma, X., Hu, Z., & Sun, S. (2022). Multi-Parameter Optimization of Heat Dissipation Structure of Double Disk Magnetic Coupler Based on Orthogonal Experimental Design. Energies, 15(23), 8801. https://doi.org/10.3390/en15238801
- Xiao, J., Chen, Z., Shen, X., Jiang, C., & Lu, P. (2019). Orthogonal experiments on the key structural parameters optimization of mine dust removal foam generator by fluent numerical simulation. IOP Conference Series: Earth and Environmental Science, 218(1), 12115. https://doi.org/10.1088/1755-1315/218/1/012115
- Yu, X., Qiu, K., Li, H., Miao, X., Wang, J., Li, Q., & Lu, S. (2023). Interfacial and rheological properties of long-lived foams stabilized by rice proteins complexed to transition metal ions in the presence of alkyl polyglycoside. Journal of Colloid and Interface Science, 630, 645–657. https://doi.org/10.1016/j.jcis.2022.10.126
- Yu, X., Qiu, K., Yu, X., Li, Q., Zong, R., & Lu, S. (2022). Stability and thinning behaviour of aqueous foam films containing fluorocarbon and hydrocarbon surfactant mixtures. Journal of Molecular Liquids, 359, 119225. https://doi.org/10.1016/j.molliq.2022.119225