
ABSTRACT
Introduction
Diabetes increases preventative sickness and costs healthcare and productivity. Type 2 diabetes and macrovascular disease consequences cause most diabetes-related costs. Type 2 diabetes greatly costs healthcare institutions, reducing economic productivity and efficiency. This cost of illness (COI) analysis examines the direct and indirect costs of treating and managing type 1 and type 2 diabetes mellitus.
Methodology
According to the Preferred Reporting Items for Systematic Reviews and Meta-Analyses guidelines, Cochrane, PubMed, Embase, CINAHL, Scopus, Medline Plus, and CENTRAL were searched for relevant articles on type 1 and type 2 diabetes illness costs. The inquiry returned 873 2011–2023 academic articles. The study included 42 papers after an abstract evaluation of 547 papers.
Results
Most articles originated in Asia and Europe, primarily on type 2 diabetes. The annual cost per patient ranged from USD87 to USD9,581. Prevalence-based cost estimates ranged from less than USD470 to more than USD3475, whereas annual pharmaceutical prices ranged from USD40 to more than USD450, with insulin exhibiting the greatest disparity. Care for complications was generally costly, although costs varied significantly by country and problem type.
Discussion
This study revealed substantial heterogeneity in diabetes treatment costs; some could be reduced by improving data collection, analysis, and reporting procedures. Diabetes is an expensive disease to treat in low- and middle-income countries, and attaining Universal Health Coverage should be a priority for the global health community.
Key points for decision makers
Evidence on the economic burden of type 2 diabetes has increased significantly.
Studies have emerged documenting the economic costs of type 2 diabetes in low- and middle-income countries (LMICs), providing insights into its impact in underdeveloped nations.
However, there is a lack of research on the labour market effects of diabetes in LMICs.
Costs and labour market effects of diabetes escalate over time and with disease severity.
Early investments in prevention and disease management are highly valuable.
Cost-of-illness studies may not adequately account for biases, potentially leading to under- or overestimation of intervention or drug value for money.
Find strategies to decrease the economic burden of type 2 diabetes, with a specific emphasis on reducing costs associated with medications and inpatient care for managing complications.
Harmonise or standardise the collection and reporting of cost of illness data to ensure consistent and reliable measurements across studies.
Introduction
Diabetes mellitus is characterised by chronic hyperglycemia. Over time, this can harm the cardiovascular, vasculature, ophthalmic, renal, and peripheral neurological systems (World Health Organization, Citation2022). Type 2 diabetes has increased in all countries, regardless of income, over the past 30 years (Flood et al., Citation2021). To effectively treat both types of diabetes, various imaginative methods and remedies were used. Type 1 diabetes is characterised by pancreatic insulin deficiency. People with diabetes need affordable insulin to survive. Chronic diabetes and obesity must be reduced by 2025.
Diabetes affects 4.2 million people worldwide, mostly in lower-middle-income countries (LMICs) (Javanbakht et al., Citation2011). Diabetes kills 1.5 million people annually (World Health Organization, Citation2022). Diabetes has exponentially increased worldwide in recent decades. A study found that low- and middle-income people aged 39–70 are more likely to develop diabetes (Flood et al., Citation2021; World Health Organization, Citation2022). 10.5% of persons globally have diabetes, with forecasts of 12.2% by 2045 (Akhtar et al., Citation2019; Gillani et al., Citation2018; Javanbakht et al., Citation2011). In 2021, the International Diabetic Foundation (IDF) macro survey anticipated 537 million people with diabetes. It is expected to reach 643 million by 2030 and 783 million by 2045 (Sun et al., Citation2022).
Previous study reported that diabetes increases the prevalence of preventive diseases and healthcare costs and productivity losses (Li et al., Citation2013). Healthcare spending rose 316% to USD 966 billion during the past 15 years. Macrovascular disease and complications from type 2 diabetes are the main costs of diabetes. Diabetes’ rising costs are a global concern, especially in developing nations (Bahari et al., Citation2023). Diabetes prevalence increases alongside healthcare expenses, straining the economy. Literature shows that type 2 diabetes-related healthcare costs have decreased economic activity and productivity (Chatterjee et al., Citation2011; Dahal et al., Citation2022; Seuring et al., Citation2015).
Due to financial constraints, low-income people delay diabetes diagnosis until adulthood, which causes serious health issues. Egypt and Mexico have 16.8% and 12.6% diabetes rates, compared to 8.2% and 9.0% in Germany and the United States of America (US). (Sepanlou et al., Citation2017). A recent diabetes study suggests that diabetes is becoming a global issue. Diabetes’ rising costs are a global issue, especially in Low-income countries. The US, Malaysia, Mexico, Sri Lanka, and the Kingdom of Saudia Arabia (KSA) spend much of their healthcare budgets on diabetes services. Diabetes healthcare spending varies by country. KSA spends 21% of its healthcare budget on diabetes, while Sri Lanka, Mexico, Malaysia, and the US pay 16%, 15%, 16%, and 15% (Halim & Halim, Citation2019; Zhang et al., Citation2010).
Diabetes and its complications strain healthcare. The Cost of Illness (COI) study corroborated the rising economic burden and revealed various economic inequities. Research expenditures ranged from 2005 to 2020. Cost-of-illness trials involve treatment costs. The reference attributes secondary illness expenses to wasting earnings (Alzaid et al., Citation2021; Amos et al., Citation1997; Ettaro et al., Citation2004; Simon et al., Citation2019).
Due to its prevalence and severity, diabetes management costs and benefits are of interest. Glycemic control reduces diabetic complications, saves money, and improves health. The American Diabetes Association established guidelines for medical professionals and patients to reduce diabetes prevalence, complications, and quality of life (Murray & Lopez, Citation1994; Rice, Citation1994; Zhang et al., Citation2010).
Cost of illness overview
Cost-of-illness (COI) studies examine chronic illness's financial impact. Numerous studies show illness-related resource loss (Ettaro et al., Citation2004; Larg & Moss, Citation2011; Tharkar et al., Citation2010). COI estimations, prevalence, incidence, morbidity, and mortality show an illness's social impact. Some researchers consider COI estimations a complete indicator of a disease's burden since they can include multiple endpoints into a single result (Tarricone, Citation2006). The highest direct costs were 46% and 32%, less than medications and lab testing (Moucheraud et al., Citation2019). Diabetes costs USD 332, 60.4% of which is pharmaceutical (Butt et al., Citation2022). All reviewed studies failed to calculate indirect cost figures. Diabetes therapy in Bangladesh costs USD 864.7, 60.7% of which was a drug (Shetty et al., Citation2021).
Three cost elements can be estimated in a COI study
Direct Cost: The direct costs refer to those costs incurred as a result of medical management of the disease, drugs, admissions, complementary tests, and patient transportation.
Indirect costs: Indirect costs refer to those costs incurred not as a result of medical management of the disease but rather of other incurred losses such as lost wages, lost productivity, and costs resulting from the need for home care and childcare that would otherwise not be incurred.
Intangible expenses: Intangible costs are those associated with the function lost, increased pain and reduced life quality.
Recent studies show that per capita, type 2 diabetes costs USD242 in low-income nations and USD10,801 in high-income countries. The highest economic impact was direct medical costs, 56% in low-income nations and 74% in high-income countries. Indirect productivity losses remained high (Sathyanath et al., Citation2022). Another low- and middle-income nation review found type 2 diabetes costs USD238 in Bangladesh and USD3,189 in Iran per capita (Barua et al., Citation2021). Medical costs were the major economic burden from 32% in Bangladesh to 97% in Iran. Indirect productivity losses remained substantial. In another study, diabetes treatment costs USD112 in Bangladesh and USD2,544 in Mexico per person (Bermudez-Tamayo et al., Citation2017). Medical expenses were the highest, from 29% in Nepal to 97% in Mexico. Indirect productivity losses remained substantial. Since these studies incorporate data published before more advanced medicines and procedures for diabetes control, more updated and relevant data should be supplied to consider new literature and estimate the influence of anticipated improvements on diabetes management healthcare expenses (Gutierrez et al., Citation2018; Gyawali et al., Citation2015; Khaledi et al., Citation2019).
This study systematically compares illness costs in Low- and Middle-Income Countries (LMICs) and High-Income Countries (HICs), considering recent diabetes research not covered in previous reviews. It investigates the global and regional economic impact of diabetes, emphasising a non-profit motive. The comprehensive analysis encompasses the societal, healthcare, and individual dimensions of diabetes costs, including its distinctive influence on labour market outcomes.
Problem statement
The surge in Type 2 diabetes, irrespective of income level, has led to a substantial economic burden, particularly in lower-middle-income countries (LMICs). Existing studies emphasise the rising healthcare costs associated with diabetes but lack a nuanced exploration of global trends, regional disparities, and the comprehensive distribution of direct and indirect costs, including their impact on the labour market. Furthermore, the evolution of diabetes management costs, considering newer interventions, remains inadequately addressed. Methodological variations and data gaps hinder precision and comparability in current research. This article aims to systematically analyse illness costs, bridging these gaps, and providing up-to-date insights into the economic impact of diabetes globally and regionally, with implications for effective policy development and resource allocation.
Methodology
The Cochrane Database of Systematic Reviews (CDSR) (ISSN 1469-493X) was used to search for the relevant review articles previously published (Kleinstäuber et al., Citation1996). In the initial review process, the gap was identified from those selected articles, and afterwards, two authors (MDB and TM) were assigned the task of extracting literature from various databases. These databases include documents from PubMed, Embase, CINAHL, Scopus, Medline Plus, and CENTRAL databases.
Search plan
The search for this review article was done electronically using a Boolean operator such as ‘Diabetes Mellitus’ (Mesh) AND (‘Cost of Illness’ (Mesh) OR ‘Cost Control’ (Mesh) OR ‘Cost Analysis’ (Mesh) OR ‘Healthcare cost’ (Mesh) ‘type 2 diabetes). These key terms were searched using the filter from January 2011 to January 2023 because the articles before this have been reviewed (Afroz et al., Citation2018; Ettaro et al., Citation2004; Ng et al., Citation2014). The references were downloaded in RIS format where available and then moved to Mendeley. The English language restriction was also applied. Furthermore, this systematic review corresponds with the PRISMA (Preferred Reporting Items for Systematic Reviews and Meta-Analyses) report for systematic reviews (Moher et al., Citation2010).
Inclusion criteria
Studies were included with the English language, original search, and if the results section included a monetary assessment of the direct and indirect expenses of diabetes or if the impact of diabetes on healthcare expenditure was estimated and other utilisation of resources for diabetes. No study was eliminated from research with an insignificant sample size since we did not want to be prejudiced against studies from low-income countries.
Exclusion criteria
Types of diabetes are distinct from other types of diabetes classifications like Latent onset diabetes of the adult (LADA), maturity-onset diabetes of young (MODY), or any other specified type mentioned in the literature other than type 1 and type 2 diabetes mellitus were not counted in the study. Those that focused solely on the costs of diabetes problems or management options and studies that estimated costs for specific categories of people with diabetes were omitted. Those studies focus on the cost of illness for any diabetes-relevant comorbid conditions.
Selection process
Using the databases mentioned above, the reviewers assessed the topics and abstracts of the relevant studies. After evaluating the searched articles, they were excluded if they did not qualify for the inclusion criteria. The selected articles were reviewed again by reading the whole articles for eligibility, and relevant information was extracted from the included articles. The exclusion was done. Furthermore, selected research articles were restudied and rearranged using their references in the reviewed articles.
Data extraction
A data extraction sheet was created and tested as part of the research approach to gather relevant data. MDB and TM extracted data. They carefully examined each eligible paper and retrieved details. The extracted data included the studies’ geographic location, population, study sites, costing methods, and cost categories. Hospitalisation, outpatient visits, complication management, medications, monitoring equipment, and diagnostic procedures/laboratory analyses were included. The author checked the cost to make sure it matched the data. OSC and ZUDB supervise the study. MDB, TM, MNK, AS, AH, and MA helped write the manuscript. OSC and AS verified all data.
A study was excluded from the analysis if it did not offer enough methodological information. This strategy ensured data reliability and correctness for analysis and clarification. Reviewers extracted data and assessed study outcomes and features. Custom extraction forms followed the Centre for Reviews and Dissemination's systematic review guidelines (Konttila et al., Citation2019). Using a table, 42 items that met the inclusion requirements were selected. Based on key terms such as diabetes mellitus, cost of disease, cost control, cost analysis, healthcare cost, and type 2 diabetes, the study results were divided into themes. The study's major goals were to calculate type 2 diabetes mellitus (T2DM) direct expenses, estimate per capita costs, and assess T2DM's effects on employment, income, earnings, and absenteeism.
The research publications were tabulated with author, year, and journal information for critical analysis. The tables also included the study's design, objective, sample size, data collection and analysis techniques, major findings, and critical analysis. The study reported adherence, diabetes knowledge, and quality of life results. The COI findings were structured for cross-country comparisons. If available, the study's diabetes prevalence data was used to calculate expenses for research studies that offered general population statistics rather than per capita expenditure data. When an estimated aggregate cost is unavailable, summarising direct and indirect costs approximates the overall cost.
Per capita, COI study results enable cross-country comparisons. For population-level data, study expenses were calculated based on diabetes prevalence, not per capita. If a complete cost estimate was not provided, the sum of direct and indirect charges was used to determine the cost. The costs were converted into purchasing power parity (PPP) adjusted estimates to improve comparability, sometimes known as international dollars (USD). We used the article's exchange rate to convert approximations back into the local currency because some studies used US dollars or other prominent currencies instead of the country's local currency. We used OANDA's midpoint exchange rate for the reporting period since the relevant study did not offer an exchange rate. The CCEMG-EEPPI Centre calculated 2020 PPP-adjusted figures using the Campbell and Cochrane Economics Methods Group's cost converter. Purchasing Power Parity (PPP) standardises expenses across study currencies. The World Bank's consumer price index (CPI) adjusted local currencies for inflation, allowing 2020 pricing comparisons. A conversion tool converted local currency into USD (Ha et al., Citation2020).
Results
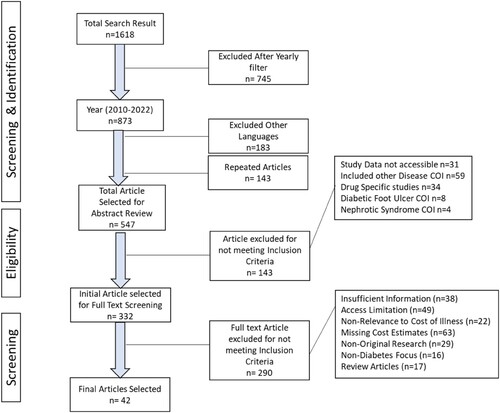
By using the search strategy, a total of 1618 references were found. 873 articles remained after utilising the yearly search from 2010 to 2023. Furthermore, 690 articles published in other languages instead of English were excluded. We deleted the repeated number of items from this list; the result was 547. Following that, their titles and abstracts were reviewed for inclusion criteria. 215 were removed because they did not match the inclusion criteria. After the screening, 332 articles were selected for full-text review. Forty-two papers met the inclusion criteria and were accepted for this evaluation after a full-text review by the principal and secondary reviewers. The primary grounds for exclusion were distinct from type 2 diabetes, which did not meet the criteria for the cost of illness for systematic reviews, papers that did not give adequate details of the analysis, and cost of illness, all trials with partial results or currently in the process were excluded from this review. The study selection procedure is depicted in as a PRISMA (Preferred Reporting Items for Systematic Reviews and Meta-Analysis) diagram.
Figure 1. PRISMA diagram of systematic review on diabetes cost of illness.
Preview of the procedure
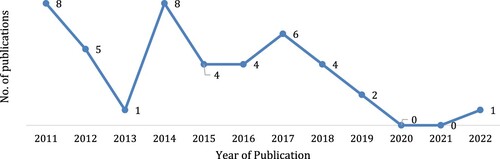
Yearly review of publications
The provided findings for this study (COI on diabetes) were highlighted after reviewing the papers. There has been a decrease in publications over the last ten years, with some year-to-year variability. It is noted that there is no single publication in the years 2020 and 2021. The primary focus of researchers in these two years was on the COVID-19 pandemic because of the outbreak of the pandemic. Most of the publications were done in 2011 and 2014; there were eight publications each year. A sudden decline can be seen in 2013; there was only one publication, and there was no apparent reason for this decline. A gradual increase in publications was observed in the years 2015–2017.(Afroz et al., Citation2019; Akari et al., Citation2013; Andersson et al., Citation2020; Anja & Laura, Citation2017; Anja & Laura, Citation2017; Bommer et al., Citation2017; Bommer et al., Citation2018; Boyanov et al., Citation2011; Bruno et al., Citation2012; Chatterjee et al., Citation2011; Chow et al., Citation2018; Elgart et al., Citation2014; Erzse et al., Citation2019; Hex et al., Citation2012; Hussain et al., Citation2014; Ibrahim, Citation2014; Javanbakht et al., Citation2011; Karachaliou et al., Citation2014; Kattel et al., Citation2019; Khan et al., Citation2020; Köster et al., Citation2011; Köster et al., Citation2011; Lesniowska & Skrzekowska-Baran, Citation2011; Leśniowska et al., Citation2014; Marcellusi et al., Citation2016; Mokdad et al., Citation2015; Palmer et al., Citation2012; Quaye et al., Citation2011; Riewpaiboon et al., Citation2011; Sortsoe et al., Citation2016; Suleiman & Festus, Citation2015; Todorova et al., Citation2012; Ulrich et al., Citation2016; Ying et al., Citation2011; Zhuo et al., Citation2014). Further details can be seen in .
Figure 2. Yearly review of publication data.
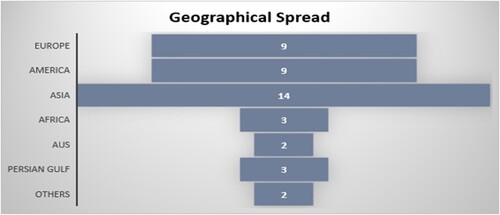
Geographical distribution of data
There were 33% of the study sample (n = 14) from the Asian region (mainly South Asia and the Pacific) that were reviewed in this study, as shown in . The articles from the European and American areas have the same ratio of 21% (Europe n = 9, American n = 9). In comparison, articles (n = 3) from the Persian Gulf and Africa also have the same ratio of 7% in each region. The current systematic review represents the population of 22 countries, including LMICs and HICs. Furthermore, one article with a population of 35 lower-middle-income countries (LMICs) (Bommer et al., Citation2017) and another with no defined area (Khan et al., Citation2020), both of which were included in the ‘others' category in .
Figure 3. Geographical representation of Reviewed Data. *AUS: Australia. Other: No Specific region.
Lower-middle-income countries vs. High-income countries
Most reviewed articles were from LMICs (n = 26), 61%, while 39% (n = 16) were from the HICs. Most articles used bottom-up methodology for analysing the cost of illness (COI). Among these articles, the aggregate cost of illness varied from LMICs to HICs. The highest aggregate cost is mentioned in a study conducted in Germany (Köster et al., Citation2011), which is 19.68 billion USD. In LMICs from the American region, the highest aggregated COI is of Brazil (Bahia et al., Citation2019), which is 352.95 USD (56); in the Asian Region, the highest COI is of India, which is 339 USD (Akari et al., Citation2013). The lowest aggregated COI is of Iran, which is 0.32 USD (Javanbakht et al., Citation2011).
Sample and data collection of the studies
In all these articles, 40.4% of data (n = 17) were directly gathered from patients, 30% (n = 13) of data was collected from the records, and 28% of data was incorporated from mixed resources (patients along with hospital records and secondary data). Furthermore, in 45% of articles (n = 19), the sample size of the studies was type 2 diabetes, and 21% (n = 9) consisted of the general population (simple random sampling rather than purposive sampling for data collection). In addition, 16.66% (n = 7) of articles consisted of a mixed population; type 1 and type 2 diabetes, while in 16.66% (n = 7), authors did not mention any specific type of diabetes. They did not specify the population of their study. Most studies collected data at healthcare centres, outpatient departments (OPDs), private clinics, and hospitals. In 23% of studies (n = 10), data was directly taken from the patients using the survey method.
Cost of Illness (COI) difference
The articles showed that COI varies by location and country. A systematic review of papers shows the COI range. Most costing strategies for diabetes in high-income countries (HICs) use the sum of all approximate medical expenses of diabetes patients without a control group. (Bahari et al., Citation2023; Bommer et al., Citation2017; Ismail et al., Citation2017; Jacobs et al., Citation2017; Patty & Nita, Citation2022; Ulrich et al., Citation2016). The attributable-fraction strategy (Andersson et al., Citation2020; Hex et al., Citation2012; Palmer et al., Citation2012) and the disease-attributable costing approach were also used (Leśniowska et al., Citation2014; Moucheraud et al., Citation2019). The attributable-fraction strategy was mainly used in the USA. The incremental cost method was used most often in research about HICs (Cannon et al., Citation2018). The most common method for LMICs was the survey method (Butt et al., Citation2022; García et al., Citation2015; Moucheraud et al., Citation2019; Shetty et al., Citation2021; Simon et al., Citation2019; Win Tin et al., Citation2015).
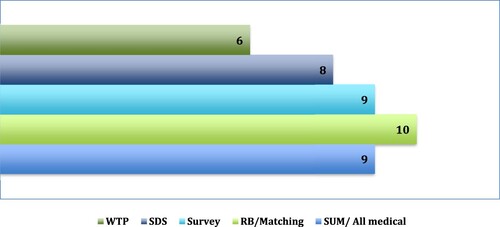
On the other hand, almost all indirect cost evaluations use the same method, which is called the ‘human capital approach.' This plan considers any lost wages that a diabetic person or their caregiver may have had to pay because of complications caused by diabetes. Only six studies used the willingness-to-pay (WTP) method to estimate the indirect costs (Seuring et al., Citation2015), as shown in . This method tried to figure out how much people would be willing to pay to lower the disease risk in the case of diabetes. The WTP method was typically used to estimate indirect costs. One of the studies included WTP estimates and the direct and indirect costs evaluated using the human capital approach. Still, this study did not incorporate the WTP approximation in the overall cost approximation. The other two studies, on the other hand, only looked at the WTP.
Figure 4. Different methods are used for the estimation of diabetes cost of illness. *SUM: Sum of all Medical costs, RB: Regression Bias, SDS: Sum diagnosis-specific, WTP: Willingness to pay.
Perception of the studies
The studies on the cost estimates of diabetes were characterised by various perspectives, making it challenging to compare them directly. Most of the research focused on two main perspectives: society and healthcare systems. The standpoint of society, adopted by (n = 12) studies, considered the direct and indirect monetary costs incurred by society, including those arising from the healthcare system and productivity losses (Adiga & Adiga, Citation2018; Bommer et al., Citation2017). On the other hand, studies (n = 18) focused on the healthcare system's perspective, which was particularly common in high-income countries (HICs), where the cost of diabetes was assessed regarding its impact on private or public health insurance.
In lower middle-income countries (LMICs), however, a few studies (n = 6) adopted the patient's point of view in evaluating the productivity losses that directly affected the diabetes patient. The differing perspectives adopted by the studies highlight the complexity of estimating the cost of diabetes and the need for a comprehensive approach that considers all relevant factors.
Cost modules
According to the findings of these studies in which patients provided their data, the average cost of an outpatient visit ranged from 5.97 million USD (in Nigeria) to 56.94 million USD 7.41 million (in Iran). Costs of annual outpatient visits were reported in these studies conducted in LMICs (24 million USD in Bangladesh and 85.05 million USD in Iran). In comparison, the annual outpatient visit cost in Nigeria was 26.88 million USD ().
Table 1. Cost components of patients reporting data average reporting data (USD).
The group of low- and middle-income countries had, on average, relatively low annual medicine costs (approximately 299.7 USD average per annum). Although inpatient charges differed, this was not mentioned in the research conducted in Bangladesh and Nigeria. Iran and China, two additional countries, said it, with their respective prices being 551 USD (Iran) and 215 (China) USD (). Although there is not a single record identified from HICs that corresponds to these studies, there is not a single study from HICs that includes patients as participants. The average cost of an outpatient visit was USD28 in high-income countries, compared to just USD 24.33 in low- and middle-income countries (). The average annual medication cost was USD 139 in low- and middle-income nations and USD 218 in high-income countries. The average yearly cost of hospital care was USD 345.70 in low- and middle-income countries and USD 6,100 in high-income ones (). Due to a lack of data from low- and middle-income countries, it could not draw reliable conclusions about the relationship between income and quality of life.
Table 2. Average Reporting Data (USD) Outpatient Cost Components from records.
Prevalence bases cost estimation of diabetes
One of two primary epidemiological methods can estimate COI, neither of which can be directly compared to the other. The incidence method is used to assess the costs associated with diabetes. This method follows patients over time, typically with their diagnosis in a shared base year and continuing until death or the end of a specific period (such as ten years). In addition, this system can keep track of the shifting characteristics of expenses associated with diabetes as the condition worsens. On the other hand, the prevalence technique calculates the costs of diabetes for a representative sample of persons who have diabetes at a specific time (often one year) and over a spectrum of disease severity. This method is used to analyse the costs of diabetes. It is an effective method for determining the total monetary cost of diabetes at any time. Because of the differences in study lengths and data sources, it is impossible to directly compare the estimation from prevalence-based studies and those from incidence-based research. As a result, we independently present the cost estimates, starting with the predominance technique.
shows the projected range of direct costs based on the estimation method and the annual household income. When it comes to estimating direct costs, it is evident that there is a considerable lot of discordance not just between the various estimation procedures but also within those strategies themselves. Direct costs were predicted to range from USD 470 in Mexico in 2011 to USD 12000 in the United States in 2013. These estimates were dependent on both the year and the nation. Research carried out in LMICs revealed that direct costs were significantly lower than reported in studies that were carried out in higher-income countries (Le et al. Citation2017; Mapa-Tassou et al., Citation2019).
Table 3. Prevalence-based study direct expenses by estimation technique and financial status in USD.
Per the patient's annual cost
Inpatient treatment, pharmaceuticals, and laboratory tests are the components that make up the yearly diabetes care cost components. The annual cost per patient is broken down in the following data, compiled from each publication. illustrates information per article, with the data arranged in increasing order of a per-capita gross domestic product within each group. The data are grouped according to the data source. Only the data supplied in the articles and the statistics from the relevant countries were used as a data source for this graph because not all included articles provide any information about all the cost components. The average annual cost was used from different articles which belong to the same country.
Figure 5. Annual cost/patient in high-income countries.
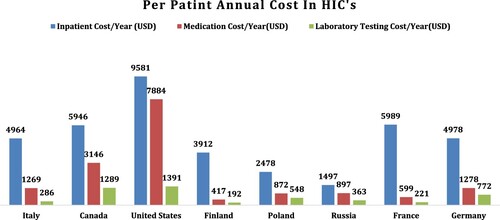
In HICs, the cost of inpatient care was the most often cited feature of healthcare in these articles (n = 9), accounting for 21% of the total sample. The USA had the highest inpatient costs at 9581 USD annually per patient, while Russia had the lowest at 1497 USD annually. The cost of medicine is the second highest cost component per patient (n = 12, 28%), and it exhibited the same results as the previous cost component, with the United States having the highest cost at 7884 USD yearly per patient and Finland having the lowest cost at 192 USD annually per patient. In contrast, laboratory costs were the least expensive compared to the other two cost components. Less than half of the studies reported outpatient expenditures (annual or per visit). Only seven articles included all four cost components.
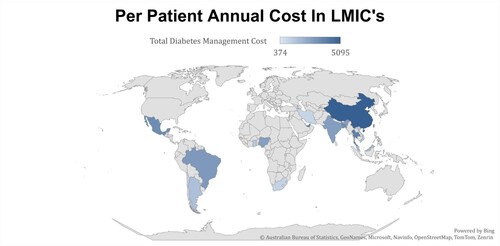
In LMICs, the cost of inpatient care was also the most often cited feature of healthcare in the reviewed articles (n = 18), which is 42% of the total sample. Persian Gulf and Taiwan had the highest inpatient costs at 2000 USD annually per year, while Ghana had the lowest at 300 USD annually per patient, as shown in . The cost of medicine is the second highest cost component per patient (n = 20, 47%), and it revealed different results compared to HICs’ cost component (de Lagasnerie et al., Citation2018; Dedov et al., Citation2018). In LMICs, Taiwan had the highest cost at 300 USD yearly per patient; many countries have 200 USD, such as Mexico, Chile, Africa, Iran, and Malaysia, while various countries had an average of 100 USD, such as Thailand, China, Vietnam, Argentina, and Brazil. The lowest medicine cost was 50 USD annually per patient in Nigeria, Bangladesh, and Ghana. Compared to HICs, laboratory costs were the lowest compared to the other two cost components in LMICs; compared to the HICs, its average is 30 USD annually per patient. Similarly, to HICs, a few studies reported all the Cost components, while others reported 2 or 3 cost components. The costing and evaluation of the overall components can be seen in Appendix A, Attached.
Figure 6. Annual cost/patient in lower-middle-income Countries.
Annual per patient medication cost
According to the evaluated studies, the price of insulin and other diabetes drugs varies greatly by nation and healthcare quality. In lower-middle-income countries (LMICs), oral diabetes medicine is more common than insulin, which is more expensive. Low- and middle-income countries lack drug price information. Many articles indicated that type 2 diabetes insulin costs between USD20 to over USD1,200 per patient per year. Metformin prices ranged from USD 72 to over USD 100 per patient. Type 2 diabetes care costs the most ().
Table 4. Per patient medication cost per annum.
CVD medication costs range from USD 27 to USD 544 per year. India (low-middle income) had the narrowest range, and Canada (high-income) had the biggest.
Diabetes medication can be expensive for individuals and healthcare systems in countries with high living costs and limited access to affordable healthcare. Low-cost treatment is essential to treat diabetes and prevent complications. To improve policy and healthcare, LMIC drug cost research is needed.
Discussion
The present systematic reviews achieved their goals by disclosing research from various countries. The cost estimates vary widely within and between these nations. A systematic examination of scholarly literature found 42 papers on diabetes and its worldwide costs of illness (COI). Asia paid 50% of sickness publication costs, while Europe and the US spent 25% apiece. About 61% of the study sample, 26 people, had data from low- and middle-income nations. The publications focused on type 2 diabetes. The gaps in the literature suggest future research on the financial burden of type 2 diabetes management and the economic impact of illness in Africa, the Persian Gulf, and Central Asia, which have received little attention. Type 1 diabetes management costs may be a concern.
According to the findings, diabetes management in low- and middle-income countries may be costly. Lack of health insurance for a large number of people worldwide has forced households affected by diabetes to pay for treatment, which can be stressful. This study emphasises the need to acknowledge cost-cutting initiatives, such as treatment cost reduction and increasing spending to reduce high-cost outcomes. At least 10% of 800 million households’ annual expenditures goes on healthcare (Afroz et al., Citation2018). Due to high healthcare costs, 12.5% of these households must live on USD1.90 or less (Chen et al., Citation2016). Conflicts of interest (COI) research in low- and middle-income countries (LMICs) is a significant advance since the last study. Studies show that diabetes-related economic stress affects people with diabetes immediately. The high out-of-pocket treatment costs that patients must pay typically necessitate spending a large amount of their annual income on diabetes care. (Alzaid et al., Citation2021; Arffman et al., Citation2020; Bommer et al., Citation2017; Cannon et al., Citation2018; Sathyanath et al., Citation2022).
The study could not explore affordability challenges or the correlation between reported care expenditures and household income. However, research has established significant connections between these factors (Andersson et al., Citation2020; Bahari et al., Citation2023; Bommer et al., Citation2018; Flood et al., Citation2021). This underscores the imperative for further investigation into accessibility obstacles faced by patients and healthcare providers in managing chronic illnesses like diabetes. While clinical supplies’ costs, excluding medication, are under-documented, prevailing literature suggests they may form a substantial portion of overall expenditures. Studies show a wide range of annual inpatient expenditures, from under USD 20 to exceeding USD 1200, and medication costs varying from less than USD 15 to over USD 1000 per year (Papanicolas et al., Citation2018). Outpatient consultation expenses ranged from USD 20 to USD 500, with significant variations both among and within countries. These differences may stem from diverse healthcare service utilisation levels or other sectors, cautioning against direct study comparisons due to methodological and expense variability (Alzubaidi et al., Citation2022).
This review utilised diverse research methods to compare diabetes treatment costs, revealing potential disparities in judgments from insurance companies and patients. Patient-reported data is susceptible to biases. Including both type 1 and type 2 diabetes studies underscores the need for further research to distinguish their distinct treatment methods. Consideration of treatment accessibility requires evaluating governmental and system funders’ capacities. The report highlights the high costs of hospitalisation and pharmaceuticals, especially in insulin for type 1 diabetes. Expensive lab tests, averaging $20 and costing $8–500 annually, contribute to overall expenditure. Despite adjusting for per capita GDP, US studies show higher diabetes costs than similar-income nations, possibly due to rising healthcare prices. (Association, Citation2013; Taha et al., Citation2022).
The findings of our study should be approached with caution due to the restricted sample size of participants, and additional variables probably continue to hold significance. Multiple lines of evidence indicate that using alternative costing techniques significantly impacts cost projections for treating diabetes (Borges et al., Citation2014; Katam et al., Citation2016). Furthermore, the choice of perspective, the diverse range of data sources and populations under consideration, and the comprehensive assessment of cost components are all potentially critical factors in elucidating the heterogeneity observed within a given nation. The incorporation of diabetic complications and determining which issues to incorporate, along with the degree to which expenses for these ailments are ascribed to diabetes, can significantly influence the results. Moreover, the degree to which diabetes is responsible for these expenses can dramatically influence the results. Several studies have been found to lack the inclusion of complications, whereas some studies have not furnished details on how they have integrated issues into their analysis (Akari et al., Citation2013; Akobundu et al., Citation2006; Bommer et al., Citation2017).
The precision of cost estimations may be compromised by data quality, as many investigations in low- and middle-income countries (LMICs) rely on self-reported data from economic household surveys. Limited scope and reliance on memory reduce applicability and susceptibility to bias. Participants in this study predominantly received diagnoses through healthcare facilities, excluding a significant portion of LMIC residents without access to conventional healthcare. This exclusion might lead to an overestimation of typical diabetes-related costs.
Conclusion
In conclusion, this systematic review has significantly advanced our understanding of the global economic impact of type 2 diabetes. By achieving its goals of identifying new economic data post-2010 and expanding the investigation globally, the study has shed light on the substantial variations in diabetes costs within and between nations. The financial burden of type 2 diabetes on low-income communities, often overlooked in labour market research, emerged as a critical concern.
The findings underscore the urgent need for focused research on the endogeneity of diabetes cost-of-illness studies and highlight the importance of addressing information gaps through comprehensive field research. The economic stress faced by people with diabetes in low- and middle-income countries, coupled with the lack of health insurance, emphasises the imperative for cost-cutting initiatives and increased spending to alleviate the economic challenges associated with diabetes management.
The study's identification of gaps in the literature, particularly in regions like Africa, the Persian Gulf, and Central Asia, calls for future research to better understand the financial implications of managing type 2 diabetes in these underserved areas. The disparities in healthcare spending patterns among different regions and income levels further emphasise the need for standardised reporting methods and a global perspective in addressing diabetes-related economic challenges.
While acknowledging limitations such as data quality issues and potential biases, this review provides valuable insights for policymakers, healthcare practitioners, and researchers. The multifaceted economic challenges associated with diabetes management, encompassing treatment costs, accessibility issues, and the impact on household income, underscore the complexity of addressing this global health concern.
In essence, this systematic review contributes to the existing body of knowledge on the economic aspects of type 2 diabetes, providing a foundation for future research endeavours. As the prevalence of diabetes continues to rise globally, understanding its economic impact becomes increasingly crucial for designing effective and equitable healthcare policies and interventions.
Limitations of the study
Data Reporting Variability: Inconsistency in data reporting across publications poses a challenge, with missing information on data collection year, sample selection, and participant recruitment processes in some articles.
Currency Information Difficulty: Obtaining currency information in certain publications adds a layer of complexity.
Implications for Policy and Practice:
Standardized Data Collection and Reporting: Diabetes cost-of-illness studies should adopt standardised methods guided by health economics literature recommendations.
Viable Practices: Explicit specification of currency units, data gathering time, and duration, along with accurate terminology for costing approaches and meaningful cost classification.
Data Accuracy Assurance: Researchers should ensure accuracy by reporting mean and median expenditures for relevant time intervals, addressing patient utilisation variations for specific treatment components.
Contribution to Knowledge: Despite limitations, this research enhances understanding of diabetes management costs, offering empirical data to fill crucial gaps for future predictions.
Declarations
Ethical approval
The study was approved by the Ethical Committee of Universiti Sains Malaysia (USM/JEPeM/22090589). The Bio-Ethics Committee (BEC) of Bahauddin Zakariya University, Multan, also permitted (ACAD/EXT/01/2022).
Consent to participate
All participants signed their informed consent before starting a participant interview.
Availability of data
The data sets used and analysed during the current study are available from the corresponding author at a reasonable request.
Code availability
The collected data were analysed using statistical tools in SPSS version 22.0 data analysing software.
Authors’ contribution
Conceptualization: Siew Chin Ong, Muhammad Daoud Butt, Data curation: Muhammad Nasir Kalam, Muhammad Abdullah, Azra Rafiq, Tooba Malik Formal analysis: Ahsan Sajjad, Muhammad Nasir Kalam Investigation: Muhammad Abdullah, Ahsan Sajjad, Fatima Yaseen, and Tooba Malik Methodology: Muhammad Daoud Butt, Azra Rafiq, Siew Chin Ong, and Zaheer-Ud-Din Babar Project administration: Muhammad Daoud Butt, Muhammad Nasir Kalam Resources: Muhammad Daoud Butt, Muhammad Nasir Kalam Supervision: Siew Chin Ong, Zaheer-Ud-Din Babar Validation: Muhammad Abdullah, Azra Rafiq, Ahsan Sajjad, Tooba Malik, and Fatima Yaseen Visualization: Muhammad Daoud Butt Writing—original draft: Muhammad Daoud Butt, Tooba Malik, Fatima Yaseen, and Ahsan Sajjad Writing – Review & editing: Muhammad Daoud Butt, Siew Chin Ong, Fatima Yaseen, and Zaheer-Ud-Din Babar. All authors have read and agreed to the published version of the manuscript.
Disclosure statement
No potential conflict of interest was reported by the author(s).
References
- Adiga, U., & Adiga, S. (2018). A cost of illness study of Type 2 diabetes mellitus in Mangalore, Karnataka, India. Asian Journal of Pharmaceutical and Clinical Research, 11(11), 139–145. https://doi.org/10.22159/ajpcr.2018.v11i11.27558
- Afroz, A., et al. (2019). Type 2 diabetes mellitus in Bangladesh: A prevalence based cost-of-illness study. BMC Health Services Research, 19(1), 1–12. https://doi.org/10.1186/s12913-019-4440-3
- Afroz, A., Alramadan, M. J., Hossain, M. N., Romero, L., Alam, K., Magliano, D. J., & Billah, B., et al. (2018). Cost-of-illness of type 2 diabetes mellitus in low and lower-middle income countries: A systematic review. BMC Health Services Research, 18(1), 1–10. https://doi.org/10.1186/s12913-018-3772-8
- Akari, S., Mateti, U. V., & Kunduru, B. R. (2013). Health-care cost of diabetes in South India: A cost of illness study. Journal of Research in Pharmacy Practice, 2(3), 114. https://doi.org/10.4103/2279-042X.122382
- Akhtar, S., et al. (2019). Diabetes in Pakistan: A systematic review and meta-analysis. Pakistan Journal of Medical Sciences, 35(4), 1173. https://doi.org/10.12669/pjms.35.4.194
- Akobundu, E., et al. (2006). Cost-of-illness studies: A review of current methods. Pharmacoeconomics, 24(9), 869–890. https://doi.org/10.2165/00019053-200624090-00005
- Alzaid, A., et al. (2021). Burden of disease and costs associated with type 2 diabetes in emerging and established markets: Systematic review analyses. Expert Review of Pharmacoeconomics & Outcomes Research, 21(4), 785–798. https://doi.org/10.1080/14737167.2020.1782748
- Alzubaidi, H., et al. (2022). The relationship between diabetes distress, medication taking, glycaemic control and self-management. International Journal of Clinical Pharmacy, 44(1), 127–137. https://doi.org/10.1007/s11096-021-01322-2
- Amon, S. K., & Aikins, M. K. S. (2017). Economic burden of type 2 diabetes mellitus complications among patients in the eastern region of Ghana: A descriptive cross-sectional cost-of-illness study. Diabetes Manag, 7(5), 367–376.
- Amos, A. F., McCarty, D. J., & Zimmet, P. (1997). The rising global burden of diabetes and its complications: Estimates and projections to the year 2010. Diabetic Medicine, 14(S5), S7–S85. https://doi.org/10.1002/(SICI)1096-9136(199712)14:5+<S7::AID-DIA522>3.0.CO;2-R
- Andersson, E., et al. (2020). Costs of diabetes complications: Hospital-based care and absence from work for 392,200 people with type 2 diabetes and matched control participants in Sweden. Diabetologia, 63(12), 2582–2594. https://doi.org/10.1007/s00125-020-05277-3
- Anja, B., & Laura, R. (2017). The cost of diabetes in Canada over 10 years: Applying attributable health care costs to a diabetes incidence prediction model. Health Promotion and Chronic Disease Prevention in Canada: Research, Policy and Practice, 37(2), 49.
- Arffman, M., et al. (2020). FinDM database on diabetes in Finland.
- Association, A. D. (2013). Economic costs of diabetes in the US in 2012. Diabetes Care, 36(4), 1033–1046. https://doi.org/10.2337/dc12-2625
- Bahari, N. I., et al. (2023). Issues and challenges in the primary prevention of Type 2 diabetes mellitus: A systematic review. Journal of Prevention, 44(1), 105–125. https://doi.org/10.1007/s10935-022-00707-x
- Bahia, L. R., et al. (2019). Economic burden of diabetes in Brazil in 2014. Diabetology & Metabolic Syndrome, 11(1), 1–9. https://doi.org/10.1186/s13098-019-0448-4
- Bao, X., et al. (2017). Hospitalization costs and complications in hospitalized patients with type 2 diabetes mellitus in Beijing, China: 中国北京市 2 型糖尿病住院患者费用与并发症的关系分析. Journal of Diabetes, 9(4), 405–411. https://doi.org/10.1111/1753-0407.12428
- Barquera, S., et al. (2013). Diabetes in Mexico: Cost and management of diabetes and its complications and challenges for health policy. Globalization and Health, 9(1), 1–9. https://doi.org/10.1186/1744-8603-9-3
- Barua, L., et al. (2021). Health-related quality of life and its predictors among the type 2 diabetes population of Bangladesh: A nation-wide cross-sectional study. Journal of Diabetes Investigation, 12(2), 277–285. https://doi.org/10.1111/jdi.13331
- Bermudez-Tamayo, C., et al. (2017). Direct and indirect costs of diabetes mellitus in Mali: A case-control study. PLoS One, 12(5), e0176128. https://doi.org/10.1371/journal.pone.0176128
- Bloom, D. E., et al. (2014). The macroeconomic impact of non-communicable diseases in China and India: Estimates, projections, and comparisons. The Journal of the Economics of Ageing, 4, 100–111. https://doi.org/10.1016/j.jeoa.2014.08.003
- Bommer, C., et al. (2017). The global economic burden of diabetes in adults aged 20–79 years: A cost-of-illness study. The Lancet Diabetes & Endocrinology, 5(6), 423–430. https://doi.org/10.1016/S2213-8587(17)30097-9
- Bommer, C., et al. (2018). Global economic burden of diabetes in adults: Projections from 2015 to 2030. Diabetes Care, 41(5), 963–970. https://doi.org/10.2337/dc17-1962
- Borges, N. B., Ferraz, M. B., & Chacra, A. R. (2014). The cost of type 2 diabetes in Brazil: Evaluation of a diabetes care center in the city of São Paulo, Brazil. Diabetology & Metabolic Syndrome, 6(1), 1–10. https://doi.org/10.1186/1758-5996-6-122
- Boyanov, M., et al. (2011). PDB29 modeling the impact of enhanced treatment of Type 2 diabetes mellitus in Bulgaria. Value in Health, 14(7), A476–A477. https://doi.org/10.1016/j.jval.2011.08.1332
- Bruno, G., et al. (2012). Direct costs in diabetic and non diabetic people: The population-based Turin study, Italy. Nutrition, Metabolism and Cardiovascular Diseases, 22(8), 684–690. https://doi.org/10.1016/j.numecd.2011.04.007
- Butt, M. D., et al. (2022). Cost of illness analysis of type 2 diabetes mellitus: The findings from a lower-middle income country. International Journal of Environmental Research and Public Health, 19(19), 12611. https://doi.org/10.3390/ijerph191912611
- Cannon, A., et al. (2018). Burden of illness in type 2 diabetes mellitus. Journal of Managed Care & Specialty Pharmacy, 24(9-a Suppl), S5–S13. https://doi.org/10.18553/jmcp.2018.24.9-a.s5
- Chatterjee, S., et al. (2011). Cost of diabetes and its complications in Thailand: A complete picture of economic burden. Health & Social Care in the Community, 19(3), 289–298. https://doi.org/10.1111/j.1365-2524.2010.00981.x
- Chen, Y.-C., et al. (2016). Impact of pay-for-performance on mortality in diabetes patients in Taiwan: A population-based study. Medicine, 95(27), e4197. https://doi.org/10.1097/MD.0000000000004197
- Chow, C. K., et al. (2018). Availability and affordability of essential medicines for diabetes across high-income, middle-income, and low-income countries: A prospective epidemiological study. The Lancet Diabetes & Endocrinology, 6(10), 798–808. https://doi.org/10.1016/S2213-8587(18)30233-X
- Dahal, P. K., et al. (2022). Economic evaluation of health behavior interventions to prevent and manage Type 2 diabetes mellitus in Asia: A systematic review of randomized controlled trials. International Journal of Environmental Research and Public Health, 19(17), 10799. https://doi.org/10.3390/ijerph191710799
- Davari, M., Boroumand, Z., Amini, M., Aslani, A., & Hosseini, M., et al. (2016). The direct medical costs of outpatient cares of type 2 diabetes in Iran: A retrospective study. International Journal of Preventive Medicine, 7, 72. https://doi.org/10.4103/2008-7802.181758
- Dedov, I. I., et al. (2018). Cost-of-Illness analysis of type 2 diabetes mellitus in the Russian federation: Results from Russian multicenter observational pharmacoepidemiologic study of diabetes care for patients with type 2 diabetes mellitus (FORSIGHT-Т2DM). Diabetes mellitus, 20(6), 403–419. https://doi.org/10.14341/DM9278
- de Lagasnerie, G., et al. (2018). The economic burden of diabetes to French national health insurance: A new cost-of-illness method based on a combined medicalized and incremental approach. The European Journal of Health Economics, 19(2), 189–201. https://doi.org/10.1007/s10198-017-0873-y
- Elgart, J. F., et al. (2014). Direct and indirect costs associated to type 2 diabetes and its complications measured in a social security institution of Argentina. International Journal of Public Health, 59(5), 851–857. https://doi.org/10.1007/s00038-014-0604-4
- Erzse, A., et al. (2019). The direct medical cost of type 2 diabetes mellitus in South Africa: A cost of illness study. Global Health Action, 12(1), 1636611. https://doi.org/10.1080/16549716.2019.1636611
- Ettaro, L., et al. (2004). Cost-of-illness studies in diabetes mellitus. Pharmacoeconomics, 22(3), 149–164. https://doi.org/10.2165/00019053-200422030-00002
- Fadare, J., Olamoyegun, M., & Gbadegesin, B. (2015). Medication adherence and direct treatment cost among diabetes patients attending a tertiary healthcare facility in Ogbomosho, Nigeria. Malawi Medical Journal, 27(2), 65–70. https://doi.org/10.4314/mmj.v27i2.7
- Flood, D., et al. (2021). The state of diabetes treatment coverage in 55 low-income and middle-income countries: A cross-sectional study of nationally representative, individual-level data in 680 102 adults. The Lancet Healthy Longevity, 2(6), e340–e351. https://doi.org/10.1016/S2666-7568(21)00089-1
- García, A. L., et al. (2015). The cost of polypharmacy in patients with type 2 diabetes mellitus. Revista Médica de Chile, 143(5), 606–611. https://doi.org/10.4067/S0034-98872015000500008
- Gillani, A. H., et al. (2018). Direct and indirect cost of diabetes care among patients with type 2 diabetes in private clinics: A multicenter study in Punjab, Pakistan. Expert Review of Pharmacoeconomics & Outcomes Research, 18(6), 647–653. https://doi.org/10.1080/14737167.2018.1503953
- Gutierrez, J. P., Garcia-Saiso, S., & Aracena, B. M. (2018). Mexico’s household health expenditure on diabetes and hypertension: What is the additional financial burden? PLoS One, 13(7), e0201333. https://doi.org/10.1371/journal.pone.0201333
- Gyawali, B., et al. (2015). Prevalence of type 2 diabetes in Nepal: A systematic review and meta-analysis from 2000 to 2014. Global Health Action, 8(1), 29088. https://doi.org/10.3402/gha.v8.29088
- Ha, J., Stocker, M. M., & Yilmazkuday, H. (2020). Inflation and exchange rate pass-through. Journal of International Money and Finance, 105, 102187. https://doi.org/10.1016/j.jimonfin.2020.102187
- Halim, M., & Halim, A. (2019). The effects of inflammation, aging and oxidative stress on the pathogenesis of diabetes mellitus (type 2 diabetes). Diabetes & Metabolic Syndrome: Clinical Research & Reviews, 13(2), 1165–1172. https://doi.org/10.1016/j.dsx.2019.01.040
- Hex, N., et al. (2012). Estimating the current and future costs of Type 1 and Type 2 diabetes in the UK, including direct health costs and indirect societal and productivity costs. Diabetic Medicine, 29(7), 855–862. https://doi.org/10.1111/j.1464-5491.2012.03698.x
- Huang, Y., et al. (2016). Economic burden in Chinese patients with diabetes mellitus using electronic insurance claims data. PloS One, 11(8), e0159297.
- Hussain, M., et al. (2014). Direct cost of treatment of diabetes mellitus type 2 in Pakistan. International Journal of Pharmacy and Pharmaceutical Sciences, 6(11), 261–264.
- Ibrahim, W. N. (2014). Comparison of type II diabetes mellitus outpatient care cost by level of care. BMC Public Health, 14(1), 1–1. https://doi.org/10.1186/1471-2458-14-S1-P1
- Ismail, A., et al. (2017). Economic burden of managing type 2 diabetes mellitus: Analysis from a teaching hospital in Malaysia. Indian Journal of Public Health, 61(4), 243–247. https://doi.org/10.4103/ijph.IJPH_24_16
- Jacobs, E., et al. (2017). Healthcare costs of Type 2 diabetes in Germany. Diabetic Medicine, 34(6), 855–861. https://doi.org/10.1111/dme.13336
- Javanbakht, M., et al. (2011). Cost-of-illness analysis of type 2 diabetes mellitus in Iran. PLoS One, 6(10), e26864. https://doi.org/10.1371/journal.pone.0026864
- Karachaliou, F., Athanasakis, K., Tsentidis, C., Kitra, M., Kyriopoulos, J., & Karavanaki, K., et al. (2014). Direct costs of diabetes care in pediatric patients with type 1 diabetes in Greece. Journal of Diabetes Mellitus, 40(03), 209–215. https://doi.org/10.4236/jdm.2014.43030
- Katam, K. K., et al. (2016). High direct costs of medical care in patients with type 1 diabetes attending a referral clinic in a government-funded hospital in northern India. The National Medical Journal of India, 29(2), 64.
- Kattel, V., et al. (2019). Cost of illness study of regular Out patient department diabetic in a Low income country: A cross sectional study. Journal of Diabetes and Endocrinology Association of Nepal, 3(1), 16–25. https://doi.org/10.3126/jdean.v3i1.24060
- Khaledi, M., et al. (2019). The prevalence of comorbid depression in patients with type 2 diabetes: An updated systematic review and meta-analysis on huge number of observational studies. Acta Diabetologica, 56(6), 631–650. https://doi.org/10.1007/s00592-019-01295-9
- Khan, M. A. B., et al. (2020). Epidemiology of type 2 diabetes–global burden of disease and forecasted trends. Journal of Epidemiology and Global Health, 10(1), 107. https://doi.org/10.2991/jegh.k.191028.001
- Kleinstäuber, M., et al. (1996). Cochrane database of systematic reviews.
- Konttila, J., et al. (2019). Healthcare professionals’ competence in digitalisation: A systematic review. Journal of Clinical Nursing, 28(5–6), 745–761. https://doi.org/10.1111/jocn.14710
- Köster, I., et al. (2011). Direct costs of diabetes mellitus in Germany–CoDiM 2000–2007. Experimental and Clinical Endocrinology & Diabetes, 119(06), 377–385. https://doi.org/10.1055/s-0030-1269847
- Larg, A., & Moss, J. R. (2011). Cost-of-illness studies: A guide to critical evaluation. Pharmacoeconomics, 29(8), 653–671. https://doi.org/10.2165/11588380-000000000-00000
- Le, N. T. D., Dinh Pham, L., & Quang Vo, T. (2017). Type 2 diabetes in Vietnam: A cross-sectional, prevalence-based cost-of-illness study. Diabetes, Metabolic Syndrome and Obesity: Targets and Therapy, 10, 363–374. https://doi.org/10.2147/DMSO.S145152
- Leśniowska, J., et al. (2014). Costs of diabetes and its complications in Poland. The European Journal of Health Economics, 15(6), 653–660. https://doi.org/10.1007/s10198-013-0513-0
- Lesniowska, J., & Skrzekowska-Baran, I. (2011). PDB32 cost of diabetes and its complications in Poland: Preliminary results. Value in Health, 14(7), A477. https://doi.org/10.1016/j.jval.2011.08.1335
- Li, M.-Z., Su, L., Liang, B.-Y., Tan, J.-J., Chen, Q., Long, J.X., Xie, J.J., Wu, G.-L., Yan, Y., Guo, X.-J., & Gu, L. (2013). Trends in prevalence, awareness, treatment, and control of diabetes mellitus in mainland China from 1979 to 2012. International Journal of Endocrinology, 2013, 753150, 14pages. https://doi.org/10.1155/2013/753150
- Mapa-Tassou, C., et al. (2019). Economic impact of diabetes in Africa. Current Diabetes Reports, 19(2), 1–8. https://doi.org/10.1007/s11892-019-1124-7
- Marcellusi, A., et al. (2016). The direct and indirect cost of diabetes in Italy: A prevalence probabilistic approach. The European Journal of Health Economics, 17(2), 139–147. https://doi.org/10.1007/s10198-014-0660-y
- Moher, D., et al. (2010). Preferred reporting items for systematic reviews and meta-analyses: The PRISMA statement. International Journal of Surgery, 8(5), 336–341. https://doi.org/10.1016/j.ijsu.2010.02.007
- Mokdad, A. H., et al. (2015). Cost of diabetes in the kingdom of Saudi arabia, 2014. Journal of Diabetes & Metabolism, 6(575), 2.
- Moucheraud, C., et al. (2019). The costs of diabetes treatment in low-and middle-income countries: A systematic review. BMJ Global Health, 4(1), e001258. https://doi.org/10.1136/bmjgh-2018-001258
- Murray, C. J., Lopez, A. D., & W.H. Organization. (1994). Global comparative assessments in the health sector:disease burden, expenditures and intervention packages.
- Ng, C. S., et al. (2014). Cost-of-illness studies of diabetes mellitus: A systematic review. Diabetes Research and Clinical Practice, 105(2), 151–163. https://doi.org/10.1016/j.diabres.2014.03.020
- Palmer, J., et al. (2012). PDB18 direct medical costs of diabetes mellitus in China: Annual cost of illness and long-term projections using a validated diabetes model. Value in Health, 15(7), A662. https://doi.org/10.1016/j.jval.2012.08.349
- Papanicolas, I., Woskie, L. R., & Jha, A. K. (2018). Health care spending in the United States and other high-income countries. Jama, 319(10), 1024–1039. https://doi.org/10.1001/jama.2018.1150
- Patty, Y. F. P. P., & Nita, Y. (2022). IAI SPECIAL EDITION: Cost of illness analysis of diabetes mellitus with complications in one hospital in Surabaya. Pharmacy Education, 22(2), 254–258. https://doi.org/10.46542/pe.2022.222.254258
- Quaye, E., Akweongo, P., & Aikins, M. (2011). PDB33 cost of diabetes management to Cocoa clinics in Ghana. Value in Health, 14(7), A477. https://doi.org/10.1016/j.jval.2011.08.1336
- Rice, D. P. (1994). Cost-of-illness studies: Fact or fiction? The Lancet, 344(8936), 1519–1520. https://doi.org/10.1016/S0140-6736(94)90342-5
- Riewpaiboon, A., Chatterjee, S., & Piyauthakit, P. (2011). Cost analysis for efficient management: Diabetes treatment at a public district hospital in Thailand. International Journal of Pharmacy Practice, 19(5), 342–349. https://doi.org/10.1111/j.2042-7174.2011.00131.x
- Sathyanath, S., Kundapur, R., Deepthi, R., Poojary, S. N., Rai, S., Modi, B., & Saxena, D. (2022). An economic evaluation of diabetes mellitus in India: A systematic review. Diabetes & Metabolic Syndrome: Clinical Research & Reviews, 16(11), 02641. https://doi.org/10.1016/j.dsx.2022.102641
- Sepanlou, S. G., et al. (2017). Disability-Adjusted Life-Years (DALYs) for 315 diseases and injuries and Healthy Life Expectancy (HALE) in Iran and its neighboring countries, 1990–2015: Findings from global burden of disease study 2015. Archives of Iranian Medicine, 20(7), 403–418.
- Seuring, T., Archangelidi, O., & Suhrcke, M. (2015). The economic costs of type 2 diabetes: A global systematic review. Pharmacoeconomics, 33(8), 811–831. https://doi.org/10.1007/s40273-015-0268-9
- Shetty, A., et al. (2021). Health-related quality of life among people with type 2 diabetes mellitus–A multicentre study in Bangladesh. Diabetes & Metabolic Syndrome: Clinical Research & Reviews, 15(5), 102255. https://doi.org/10.1016/j.dsx.2021.102255
- Simon, P., et al. (2019). Quality of life in diabetics with different complications: A cross-sectional study with patients visiting a hospital on an outpatient basis. Hamdan Medical Journal, 12(4), 195. https://doi.org/10.4103/HMJ.HMJ_15_19
- Sortsoe, C., et al. (2016). Societal costs of diabetes mellitus in Denmark. Diabetic Medicine, 33(7), 877–885. https://doi.org/10.1111/dme.12965
- Suleiman, I. A., & Festus, J. A. (2015). Cost of illness among diabetes mellitus patients in Niger Delta, Nigeria. Journal of Pharmaceutical Health Services Research, 6(1), 53–60.
- Sun, H., et al. (2022). IDF diabetes atlas: Global, regional and country-level diabetes prevalence estimates for 2021 and projections for 2045. Diabetes Research and Clinical Practice, 183, 109119. https://doi.org/10.1016/j.diabres.2021.109119
- Taha, M. B., et al. (2022). Cost-related medication nonadherence in adults with diabetes in the UnitedStates: The national health interview survey 2013–2018. Diabetes Care, 45(3), 594–603. https://doi.org/10.2337/dc21-1757
- Tarricone, R. (2006). Cost-of-illness analysis: What room in health economics? Health Policy, 77(1), 51–63. https://doi.org/10.1016/j.healthpol.2005.07.016
- Tharkar, S., et al. (2010). The socioeconomics of diabetes from a developing country: A population based cost of illness study. Diabetes Research and Clinical Practice, 89(3), 334–340. https://doi.org/10.1016/j.diabres.2010.05.009
- Todorova, L., et al. (2012). PDB21 direct medical costs of diabetes-related complications in India. Value in Health, 15(7), A662.
- Toscano, C. M., et al. (2018). Annual direct medical costs of diabetic foot disease in Brazil: A cost of illness study. International Journal of Environmental Research and Public Health, 15(1), 89. https://doi.org/10.3390/ijerph15010089
- Ulrich, S., et al. (2016). Cost burden of type 2 diabetes in Germany: Results from the population-based KORA studies. BMJ Open, 6(11), e012527. https://doi.org/10.1136/bmjopen-2016-012527
- Win Tin, S. T., et al. (2015). Counting the cost of diabetes in the Solomon Islands and Nauru. PLoS One, 10(12), e0145603. https://doi.org/10.1371/journal.pone.0145603
- World Health Organization. (2022). Diabetes Available from: https://www.who.int/news-room/fact-sheets/detail/diabetes.
- Ying, A. K., et al. (2011). Predictors of direct costs of diabetes care in pediatric patients with type 1 diabetes. Pediatric Diabetes, 12(3pt1), 177–182. https://doi.org/10.1111/j.1399-5448.2010.00680.x
- Zhang, P., et al. (2010). Global healthcare expenditure on diabetes for 2010 and 2030. Diabetes Research and Clinical Practice, 87(3), 293–301. https://doi.org/10.1016/j.diabres.2010.01.026
- Zhuo, X., et al. (2014). The lifetime cost of diabetes and its implications for diabetes prevention. Diabetes Care, 37(9), 2557–2564. https://doi.org/10.2337/dc13-2484
Appendix
Appendix Table 1: Country coding for Data Evaluation.
Appendix Table 2: Cost of Illness of Diabetes