
ABSTRACT
In 2019 a ground-penetrating radar (GPR) investigation was conducted at Kiriath-Yearim near Jerusalem, one of the largest Bronze and Iron Ages mounds in the highlands of the southern Levant. The main objective was to test an archaeological hypothesis regarding the existence of an Iron Age summit compound which was supported by monumental stone retaining walls.
We used a wheeled GPR with simultaneous central frequencies of 200, 400, and 800 MHz. Despite attenuation in the topsoil, scattering by distributed rock fragments, and asphalt pavement, we were able to penetrate almost a meter and detect anomalies.
Some of the GPR anomalies are consistent with the above-mentioned theory, meaning that their locations agree with data retrieved in nearby control trenches and with the plan of the site.
The excavation findings, jointly with the GPR interpretation, indeed imply the existence of a rectangular monumental summit compound that dates to the 8th century BCE.
1. Introduction
The site of Deir el-'Azar (), securely identified with the biblical town of Kiriath-Yearim, is located on a dominating hill 13 km west of Jerusalem, commanding a vast panorama over the coastal plain to the west and the Judean highlands to the east and south-east. At its summit stands the convent of the Ark of the Covenant, built at the beginning of the twentieth century over ruins of a Byzantine monastery. The convent commemorates the biblical tradition that the Ark of the Covenant had been kept at this place before it was transferred by King David to Jerusalem. The site was continuously inhabited from the Early Bronze Age to the Byzantine period, with peaks of activity in the Iron Age IIB-C (8th-7th centuries BCE) and the early Roman period (1st century CE). The size of the site can be estimated at 4–5 hectares, which makes it one of the largest Bronze and Iron Ages mounds in the highlands of the southern Levant.
Figure 1. Location map. The upper figure shows the site of Deir el-'Azar over a satellite map (Google). The lower picture is an aerial view, looking south.
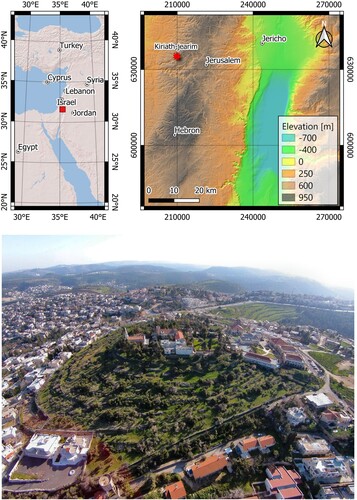
The most striking feature of the site is its topography. The summit of the hill is exceptionally flat for the highlands and, seen from afar, seems to be man-shaped by design (A).
Figure 2. A. View of the site looking south, showing the flat nature of the summit. B. The massive terrace in the west, looking northeast (the cement wall was built in the 1980s). C. The massive terraces in the east, looking northwest. D. The massive retaining wal.
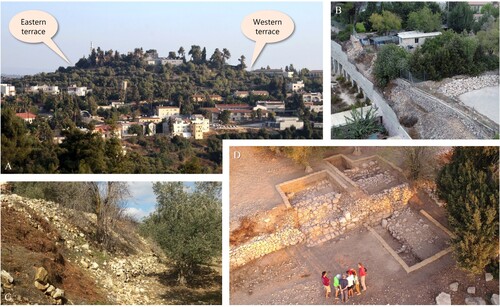
Before fieldwork began, the excavators noted two long, massive terraces which outline the summit of the hill: a 5.5 m high terrace in the east (A, C) and an even higher terrace ca. 150 m to the west, parallel to the one in the east (A, B). Each runs in a straight line, uncharacteristic of terraces in round-shaped hills, and are oriented exactly north–south. These terraces may explain the flat nature of the hill: They seem to outline an elevated platform of rectangular shape, erected at the summit of the mound. Establishing such a monumental platform must have required the building of massive stone retaining walls and the undertaking of a substantial filling operation. Finkelstein and Römer (Citation2019) hypothesized that the old retaining walls which created the platform are cached within the massive terraces described above – otherwise, the latter would not have survived erosion over many centuries. Seismic and geodetic surveys indicate the presence of major fills, several meters deep in some places, laid between the inner face of these supposed retaining walls and the natural bedrock slope of the hill (Darvasi and Agnon forthcoming).
Verifying the existence of an old retaining wall, and hence the raised platform, was one of the main goals of the excavations, and indeed, massive support walls were unearthed both within the eastern terrace (D) and in the north. Based on archaeological considerations and OSL dating, they were dated to the Iron Age IIB in the first half of the 8th century BCE (Finkelstein et al. Citation2021). The summit platform was interpreted as a royal compound, which may have included a temple built by the Northern Kingdom (Israel); it aimed at dominating Jerusalem in a period when Israel subjugated Judah (Finkelstein and Romer Citation2020).
A crucial question was the existence and precise location of a southern support wall for the summit platform (because of the moderate slope, no prominent terrace can be traced here). Locating a southern support wall was the goal of the GPR study undertaken at the site (Sector C below). Another goal was to identify the northeastern corner of the summit platform (Sector B).
2. Methods
Ground Penetrating Radar (GPR) is a non-destructive electromagnetic geophysical technique that uses radio waves to map the subsurface. In practice, a GPR device transmits electromagnetic radio pulses into the subsurface, receives them back, and measures the elapsed time between the transmission and reflections of subsurface discontinuities (two-way travel time – TWT). Discontinuities in the dielectric properties of the ground give rise to the reflection of the radio waves. Archaeological bodies buried at shallow depths may generate a detectable contrast in the dielectric properties (Smith and Jol Citation1992; Daniels Citation1996).
Each GPR scan is composed of numerous traces and provides a 2D profile of the subsurface. When scans are collected close to each other, data can be resampled to generate reflectance maps, aka time-slices (Goodman, Nishimura, and Rogers Citation1995).
The GPR method can image buried archaeological features such as walls without damaging them due to its non-invasive and non-destructive properties. Being inexpensive and featuring high-resolution imaging of relatively large-scale areas, it is a valuable tool. Therefore, the method has become an essential tool in archaeology (Conyers and Goodman Citation1997; Goodman and Piro Citation2013; Garrison Citation2016; Cozzolino et al. Citation2019; Cozzolino et al. Citation2020) and has also proven useful in conducting archaeological fieldwork (e.g. Forte and Pipan Citation2008; Creekmore Citation2010; Solla et al. Citation2011; Grützner et al. Citation2012; Büyüksaraç et al. Citation2014; Zhao et al. Citation2018; Cozzolino et al. Citation2020).
GPR has been frequently used in Israeli archaeology. Eppelbaum, Khesin, and Itkis Citation2010 stated that detailed geophysical investigations accompanied by integrated geophysical data is a powerful tool for rapid and reliable detection and imaging of archaeological remains in arid and semi-arid environments. Jol et al., Citation2000 detected a floor from the days of the Second Jewish (Bar Kokhaba) Revolt in the Cave of the Letters in the Judean desert using GPR and electrical resistivity and tomography (ERT). Jol et al. Citation2002 traced over 100 potential graves at Qumran (the site associated with the Dead Sea Scrolls) using a 100 MHz GPR antenna. Pincus et al. Citation2013 and recently Eileen et al. Citation2020 investigated the Roman site of Legio (near Meggido), where much of the stonework has been robbed; the GPR study located spots where walls remained intact as well as areas where they had been removed.
3. Surface and geological setting
The survey area is covered by soil or asphalt ( and , respectively). Sectors A and B are covered by soil while the parking area – Sector C – is asphalt, probably reaching several centimeters of thickness. ( and ). The soil thickness may vary from tens of centimeters to a few meters, overlying the lower Cretaceous, Soreq Formation of the Judea Group, with rocks comprising mainly interbedded dolomite and marl (Sneh and Avni Citation2011). The archaeological features are made of the local dolomite.
Figure 3. GPR scan traces (red lines) over the three sectors at Kiriath-Yearim (blue polygons).
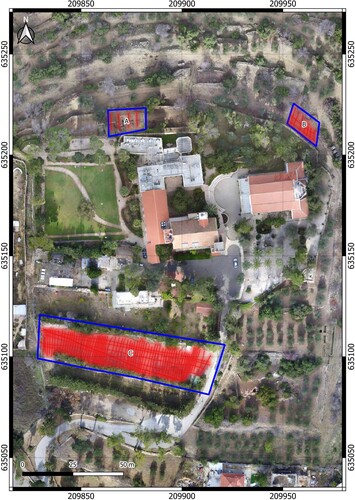
Figure 4. GPR processing scheme.
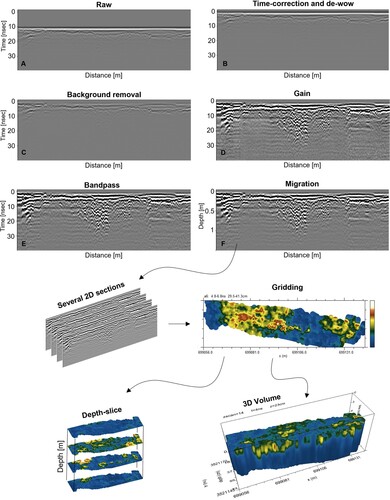
Figure 5. GPR survey in Sector A. The left-side photo was taken at the end of the excavation season. The right-side picture shows the scans after backfilling.
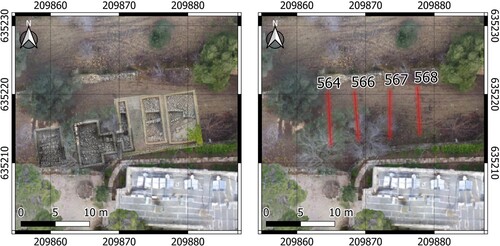
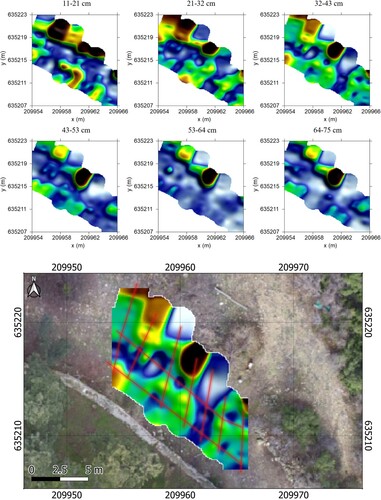
Figure 6. Representative depth slice results for Sector B (), where yellow-reddish color indicates anomalies. The lower picture shows the GPR scans in red over a depth slice at a depth of 32-43 cm.
4. Data acquisition
Approximately 1.4 km of GPR scans were obtained within the three sectors studied at Kiriath-Yearim (). All GPR scans were acquired at intervals of 5 cm and 512 samples per scan using a Cobra CBD with simultaneous central frequencies of 200, 400, and 800 MHz. A time window of 50 ns was used to ensure depth penetration following expected feature depths. The wheeled GPR, which carries a Javad Triumph LS receiver for positioning, was pushed at an average walking speed of about 0.5 m/sec.
5. Data processing
The data collected was processed using GPR-SLICE v7.MT software following the basic GPR processing steps ():
“time-zero corrections”: shifting time to account for delay time (estimate the correct vertical position of the first pulse) (B).
“de-wow filter”: removing low-frequency noise derived by low-frequency energy near transmitter (B).
“background filter”: removing direct waves, ringing noise, and any erroneous horizontal banding (C).
“gain function”: enhancing signals located at greater depths to compensate for signal loss (D).
“frequency filtering” (bandpass): removing high and low non-relevant frequencies (this filter is done by examining the frequency spectrum) (E).
At sections where hyperbolas were found on TWT plotted versus distance, the data were migrated using the hyperbola fit tool to estimate wave velocity and correct signal distortion (F).
For sections in the 3D database, after filtering was completed, the data were gridded using the inverse distance algorithm with a setting of 2 (). Finally, the data were smoothed with a 5 × 5 low-pass filter, and time-slice maps were produced for selected depth-slices ().
6. Results
Sector A was surveyed for 2D analysis with only four lines acquired after the area had been backfilled when the excavation season finished (). The time-domain (ns) was converted into the depth-domain (cm) using a dielectric permittivity of 16, appropriate for clay materials. Due to GPS inaccuracies, the lengths of the GPR profiles were scaled according to a high-resolution orthophoto (drone) rather than directly from the GPS measurements.
We collected nine GPR lines within Sector B to interpolate depth slices (we refer to a horizontal slice through a 3D volume of GPR data) (). The observation that the interpolated anomalies are centered on the survey lines indicates undersampling in this sector.
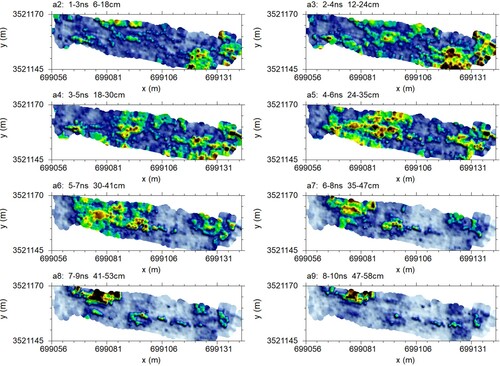
In Sector C (), we collected the densest grid of about 1.5 meters intervals in a south–north direction and control lines ∼5 meters apart in an east–west direction (). With this dense grid, we interpolated depth slices and a 3D volume over the entire parking area ().
Figure 7. Representative depth slice results for Sector C (), where yellow-reddish color indicates anomalies. The depth slice representing 12 cm shows distinct high-amplitude anomalies, which may be produced from buried wall structures.
7. Discussion
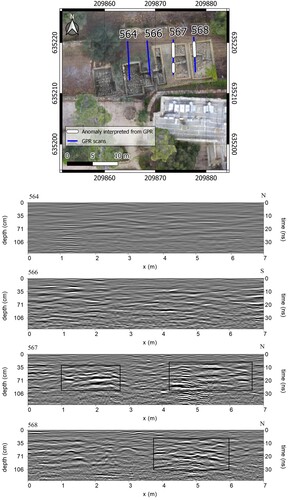
Sector A was surveyed for calibration purposes to examine our equipment and validate the ability to recognize buried wall features. It was scanned after excavation and backfilling. This may have caused artificial anomalies that can obscure the buried wall anomaly. Still, there are several wide anomalies of 1-2.5 [m] at a depth of ∼70 [cm], which typically indicate buried walls and are compatible with the excavation results ().
Figure 8. GPR scans at Sector A with the interpreted anomalies. In the lower part are the GPR scans (a permittivity of 16 has been used) with interpretation.
Sector B, studied to identify the northeastern corner of the summit compound, has several indications of non-continuous layers. However, there is no signal for a wall pattern. The primary anomaly is located on the north side at starting depth of ∼20 cm (). This anomaly is probably due to a modern terrace, although it can also be part of a buried wall.
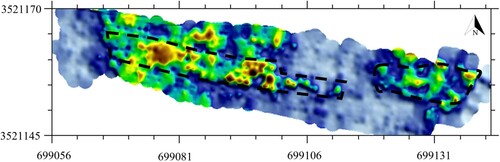
Sector C was the main target of our study, aimed at locating the southern retaining wall of the summit compound. Most of the anomalies here are very shallow and may indicate late fills related to agricultural and construction/damage activities. However, according to the depth slice at a depth of 30–41 cm (), a sort of linear anomaly, about 5 meters in width, may indicate parts of a massive buried wall. It is reasonable that an ancient wall is not fully preserved; its upper part may have collapsed, eroded, or robbed in antiquity so that the stone blocks were left scattered, and thus parts of the ancient wall would end up on the sides of the main feature. This hypothesis may explain the non-perfect linear feature ().
Figure 9. Depth-slice 30-41 cm in Sector C, which may indicate a massive buried stone wall. The black dashed polygon delimits the suspected area.
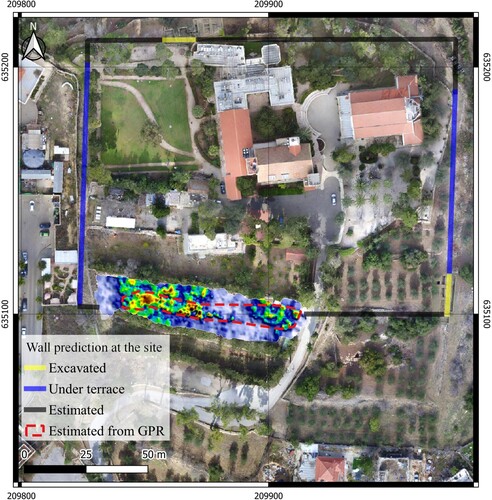
Combining the evidence of the archaeological excavations with the results of the GPR data interpretation, a rectangular summit compound 150 × 110 m in size is reconstructed (). The linear GPR anomaly is ∼5 m wide, as expected. And indeed, it lies between the two southern ends of the eastern (excavated) and western (inferred) retaining walls.
Figure 10. The outcome of the GPR scans (depth slice at a depth of ∼30-41 cm) combined with the evidence of the excavations.
8. Conclusion
In this case study, we scanned with GPR three areas in the biblical mound of Kiriath-Yearim. 2D sections were generated in Sector A to check the data quality over an area backfilled after excavation, with successful results. For the other two sectors, B and C, we collected denser GPR scans and generated depth. Within Sector B, we could not distinguish a pattern of a massive wall. In Sector C, a 5 m wide, almost linear east–west anomaly at a depth of about 40 cm may imply the buried southern retaining wall of the summit compound. The archaeological evidence and the GPR interpretation seem to corroborate the reconstruction of a monumental rectangle summit compound supported by massive retaining walls built in the first half of the 8th century BCE. This case study is a significant example of how GPR may help archaeologists where excavation is impossible.
Acknowledgments
The Shmunis Family Excavations at Kiriath-jearim is a joint project of Tel Aviv University and the Collège de France, funded by Sana and Vlad Shmunis (USA). Israel Finkelstein of Tel Aviv University and Thomas Römer and Christophe Nicolle of the Collège de France direct the project.
We thank HUJI's Neev Center for Geoinfomatics for its equipment and computational facilities. We are especially grateful to Dr. John K. Hall, co-founder of the Center.
Disclosure statement
No potential conflict of interest was reported by the author(s).
Correction Statement
This article has been corrected with minor changes. These changes do not impact the academic content of the article.
Additional information
Notes on contributors
Darvasi Yaniv
Darvasi Yaniva is a Ph.D candidate at the Neev Center for Geoinfomatics at The Hebrew University of Jerusalem. Specializing in near-surface geophysical methods. Experienced with shallow seismic and ground penetrating radar (GPR). Well-versed in GIS platforms and programming languages.
Agnon Amotz
Agnon Amotz has been teaching geology and geophysics at the Hebrew University for over three decades, since he completed doctoral studies at the University of California, Berkely. Agnon. He had been a visiting professor at Stanford University, GFZ-Potsdam, and Institut de Physique du Globe (Paris). His research topics span the geology and geodynamics of circum Arabia, from the Red Sea and Levant to the Zagros - Persian Gulf, and from these active plate boundaries to the fossil transform and spreading axis in Troodos. He has been an instructor at the Institute of Earth Sciences (IES) of the Hebrew University of Jerusalem (HUJ). After founding and directing the first geophysical lab at HUJ (the Paleomagnetic Lab), Agnon initiated and cofounded the Neev Center for Geoinfomatics. Neev Center was founded to promote teaching and research of geology & geophysics at IES. Agnon is an author of numerous scientific peer-reviewed articles, has edited three article-collections, and has been an academic advisor for about thirty graduate theses and post-doc fellowships. He has been selected a Helmholtz International Fellow, in addition to local Israeli prizes.
Finkelstein Israel
Finkelstein Israel is Professor Emeritus of Archaeology at Tel Aviv University and Director of the School of Archaeology at the University of Haifa. He is a member of the Israel Academy of Sciences and Humanities and a foreign member of the French Académie des Inscriptions et Belles Lettres and the American Academy of Arts and Sciences. Finkelstein taught at the University of Chicago and the Sorbonne and spent research years at Harvard and the Hebrew University. Finkelstein conducted many field projects, among them the excavation of the celebrated site of Megiddo. He is the author of 16 books and ca. 400 articles. In 2005 Finkelstein won the Dan David Prize in the Past Dimension. In 2009 he was named Chevalier de l'Ordre des Arts et des Lettres by the French Minister of Culture. In 2010 Finkelstein received a doctorate Doctorate honoris causa from the University of Lausanne and in 2017 he received the MacAllister Field Archaeology Award of the American Schools of Oriental Research. In 2009-2014 Finkelstein co-directed the European Research Council-funded project titled “Reconstructing Ancient Israel: The Exact and Life Sciences Perspective”. In the years 2008-2014 he edited Tel Aviv, the journal of the Institute of Archaeology of Tel Aviv University, published by Taylor and Francis in the UK.
References
- Büyüksaraç, A., CÇ Yalçıner, Y. L. Ekinci, A. Demirci, and M. A. Yücel. 2014. “Geophysical Investigations at Agadere Cemetery, Gallipoli Peninsular, NW Turkey.” Australian Journal of Forensic Sciences 46 (1): 111–123.
- Conyers, L. B., and D. Goodman. 1997. Ground-penetrating Radar: An Introduction for Archaeologists. London: AltaMira Press.
- Cozzolino, M., V. Gentile, C. Giordano, and P. Mauriello. 2020. “Imaging Buried Archaeological Features Through Ground Penetrating Radar: The Case of the Ancient Saepinum (Campobasso, Italy).” Geosciences 10 (6): 225.
- Cozzolino, M., F. Longo, N. Pizzano, M. L. Rizzo, O. Voza, and V. Amato. 2019. “A Multidisciplinary Approach to the Study of the Temple of Athena in Poseidonia-Paestum (Southern Italy).” New Geomorphological, Geophysical and Archaeological Data: Geosciences v. 9 (8): 324.
- Creekmore, A. 2010. “The Structure of Upper Mesopotamian Cities: Insight from Fluxgate Gradiometer Survey at Kazane Höyük, Southeastern Turkey.” Archaeological Prospection 17 (2): 73–88.
- Daniels, D. J. 1996. “Surface-penetrating Radar.” Electronics & Communication Engineering Journal 8 (4): 165–182.
- Eileen, G., E. J. Ernenwein, M. J. Adams, and Y. Tepper. 2020. “New Results from GPR at Legio: A Roman Legionary Base in the Jezreel Valley, Israel.” In 18th International Conference on Ground Penetrating Radar, 14–19. Colorado: Society of Exploration Geophysicists.
- Eppelbaum, L. V., B. E. Khesin, and S. E. Itkis. 2010. “Archaeological Geophysics in Arid Environments: Examples from Israel.” Journal of Arid Environments 74 (7): 849–860.
- Finkelstein, I., and T. Romer. 2020. “The Historical and Archaeological Background Behind the Old Israel Ark Narrative.” Biblica 101: 161–185.
- Finkelstein, I., and T. Römer. 2019. “Kiriath-jearim and the List of Bacchides Forts in 1 Maccabees 9:50‒52.” New Studies in the Archaeology of Jerusalem and Its Vicinity 13: 7*–17*.
- Finkelstein, I., T. Römer, C. Nicolle, Z. C. Dunseth, A. Kleiman, J. Mas, N. Porat, and N. Walzer. 2021. “Excavations at Kiriath-Jearim, 2019: Preliminary Report.” Tel Aviv 48 (no. 1): 47–72.
- Forte, E., and M. Pipan. 2008. “Integrated Seismic Tomography and Ground-Penetrating Radar (GPR) for the High-Resolution Study of Burial Mounds (Tumuli).” Journal of Archaeological Science 35 (9): 2614–2623.
- Garrison, E. 2016. Theory and Practice in Geoarchaeology: A Brief Discussion with Examples BT - Techniques in Archaeological Geology, edited by E. Garrison, 297–309. Cham: Springer International Publishing.
- Goodman, D., Y. Nishimura, and J. D. Rogers. 1995. “GPR Time Slices in Archaeological Prospection.” Archaeological Prospection 2 (2): 85–89.
- Goodman, D., and S. Piro. 2013. GPR. remote sensing in archaeology: Springer.
- Grützner, C., J. Bemmann, J. Berking, M. Frechen, R. Klinger, N. Klitzsch, S. Linzen, S. Mackens, M. Oczipka, and H. Piezonka. 2012. Improving Archaeological Site Analysis: A Rampart in the Middle Orkhon Valley Investigated with Combined Geoscience Techniques: Journal of Geophysics and Engineering, v 9 (4): S70–S80.
- Jol, H. M., M. Broshi, H. Eshel, R. A. Freund, J. F. ShroderJr, P. Reeder, and R. Dubay. 2002. “GPR Investigations at Qumran, Israel: Site of the Dead Sea Scrolls Discovery.” In ninth International Conference on Ground Penetrating Radar 2002 Apr 12 (Vol. 4758, pp. 125-129). International Society for Optics and Photonics.
- Jol, H. M., Shroder Jr, J. F., Reeder, P. and Freund, R. A. 2000, April. “Return to the Cave of Letters, Israel: a GPR Archaeological Expedition.” Eighth International Conference on Ground Penetrating Radar 4084: 882–886.
- Pincus, J. A., T. S. de Smet, Y. Tepper, and M. J. Adams. 2013. “Ground-penetrating Radar and Electromagnetic Archaeogeophysical Investigations at the Roman Legionary Camp at Legio, Israel.” Archaeological Prospection 20 (3): 175–188.
- Smith, D. G., and H. M. Jol. 1992. “Ground-penetrating Radar Investigation of a Lake Bonneville Deita, Provo Level, Brigham City, Utah.” Geology 20 (12): 1083–1086.
- Sneh, A., and Y. Avni. 2011. “The Geological Map of Israel, 1: 50,000.” Sheet 11-II, Jerusalem. Isr. Geol. Surv., Jerusalem. (Partly revised, 2016).
- Solla, M., H. Lorenzo, F. I. Rial, and A. Novo. 2011. “GPR Evaluation of the Roman Masonry Arch Bridge of Lugo (Spain).” NDT & E International 44 (1): 8–12.
- Zhao, W., E. Forte, F. Fontana, M. Pipan, and G. Tian. 2018. “GPR Imaging and Characterization of Ancient Roman Ruins in the Aquileia Archaeological Park, NE Italy.” Measurement 113 (113): 161–171.