
Abstract
With the rapid development of novel technologies, additive manufacturing of carbon fiber-reinforced composites is drawing increasing attention in various industrial applications. In this study, we develop numerical models to predict and analyze the stress distribution, crystallinity and warpage mechanisms of two commonly used structural parts, i.e., a square tube (ST) and a circular tube (CT), made of short carbon fiber-reinforced polylactic acid (SCF/PLA) with additive manufacturing using fused filament fabrication (FFF). First, a multi-physics field model considering thermoelastic relations and crystallization kinetics was developed to simulate the FFF printing process using numerical “activated elements.” Then, the most important numerical parameters were experimentally evaluated to refine the numerical model for prediction and analysis. The results show that the composite ST specimens have a significant residual stress distribution and are prone to stress concentrations at the edges and corners. Specifically, the maximum warpage value, i.e., at the corner of ST specimens (100.47 µm), is higher than that of CT specimens (88.45 µm). Overall, the difference in crystallinity for additively manufactured composite tubes with different configurations is small (average crystallinities of ST and CT specimens are 5.22% and 6.1%, respectively). However, the crystallinity tends to generally decrease along the tube height direction, from the bottom upwards to the upper area beneath the printing nozzle.
Graphical Abstract
1. Introduction
Additive manufacturing (AM, also known as 3D printing) is a cutting-edge computer-aided technology for producing thermoplastics. Fused filament fabrication (FFF) is one of the most widely-used approaches in manufacturing thermoplastics. It entails layer by layer deposition of a molten thermoplastic filament, which is fed through two counter-rotating bearings in a heated nozzle, moving in a predetermined way [Citation1, Citation2]. This enables the convenient manufacturing of fiber-reinforced thermoplastic composites, which are well-established high-performance materials with excellent mechanical properties, as compared to pure thermoplastics [Citation3–10]. For example, short carbon fiber (SCF) reinforced thermoplastics can make the material much stiffer [Citation11] and more thermally stable [Citation12].
Thus, in recent years, researchers have been increasingly investigating the FFF process of SCF reinforced thermoplastic polymers to better understand the formation mechanisms for tailoring product quality. For instance, Ning et al. [Citation13] investigated the processability, microstructure, and mechanical performance of SCF reinforced acrylonitrile butadiene styrene (ABS) composite parts fabricated using FFF. They found that the reinforcement by SCFs reduces the composites’ toughness, yield strength, and ductility while increasing their tensile and flexural properties. Love et al. [Citation5] assessed the effects of SCFs on the strength, stiffness, thermal conductivity, and distortion of FFF-fabricated composite structures. With experimental characterization of FFF-printed composites, Tekinalp et al. [Citation6] found that the addition of SCFs enhances the porosity while decreasing the spaces between the beads. Tian et al. [Citation14] found that the tensile strength of an FFF printed composite can be improved when SCFs have been added in the proportion of 27%. Abderrafai et al. [Citation15] investigated the mechanical properties of FFF-fabricated SCF-reinforced polyamide composite materials, which have five-times higher tensile modulus and one-time greater tensile strength than those of printed pure polyamide. Gupta et al. [Citation16] studied the thermal properties of SCF reinforced polycarbonate, and they found that the addition of SCFs significantly increases the materials’ degradation temperature, viscoelasticity and thermal conductivity. Hence, the SCF reinforced composites can effectively improve the mechanical properties of those pure materials, with a broader range of engineering applications.
However, most researches have been focused on the effects of processing parameters and fiber volume fractions on mechanical properties of FFF-printed SCF reinforced products. Recently, Zaharia et al. fabricated composite sandwich structures with short fibers using FFF and characterized the structures’ mechanical performance under compression and bending in three points [Citation17]. Talagani et al. [Citation18] pointed out that residual stresses are common design problems in structures manufactured using 3D printing and they introduced a numerical simulation method based on multi-scale damage mechanics and fracture mechanics to calculate the manufacturing product quality of chopped fiber reinforced polymers. Barocio et al. [Citation19] developed a work flow for end-to-end simulation of the warpage and shrinkage of short fiber reinforced semicrystalline thermoplastic polymers using FFF. However, there are still few works reported on the modelling of the FFF process for SCF reinforced polymers, especially the manufacturing mechanisms and qualities when producing composite engineering structures of different configurations, i.e., the square and circle tubes since they are typical and common in practice [Citation20–23].
In this study we develop a multi-physics field model to investigate the FFF process of two commonly used structural parts (i.e., the square and circular tubes) made of short carbon fiber-reinforced polylactic acid (SCF/PLA). By numerical analyses with experimental characterization, the distribution of the residual stress, the crystallinity, and the warpage mechanisms of these different composite structures were analyzed.
2. Experiments
The Ultimaker s3 printer, shown in , was used for the AM of composite structures, and the SCF/PLA filaments with a commercial code of NatureWorks 4043D from Porto-pasta were selected, where the PLA plastic (vol.% = 90%) is coded as CAS# 9051-89-2 and the SCFs are coded as CAS# 7440-44-0 with a volume content of 10%. The following basic parameters were used in the AM of SCF/PLA composites: 60 °C for bed temperature, 210 °C for nozzle temperature, and 9 mm/s for print speed. Note that the bed temperature of 60 °C is a commonly applied to prevent the PLA materials from debonding with the bed [Citation24], while the nozzle temperature of 210 °C is often used to ensure that the filaments can be thoroughly melted and smoothly extruded [Citation25]. After experimental trials, the print speed of 9 mm/s was chosen to guarantee a successful fabrication under the consideration of printing efficiency. Besides, the nozzle diameter is 0.5 mm and the chamber temperature is 43 °C.
Figure 1. (a) 3D printer, (b) specimens (CT and ST composite structures) with basic geometric parameters and five measurement points.
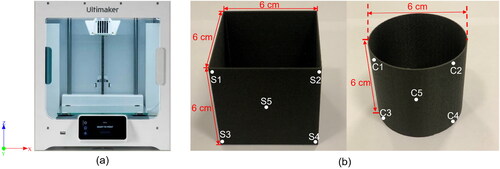
The printed SCF/PLA specimens are shown in where the dimensions of these two types of composite tubes, i.e., an ST and a CT, are exhibited. The wall thickness of all composite tubes is 0.5 mm. To evaluate the manufacturing quality and mechanisms, such as the crystallization, warpage, etc., five measurement points, S1 ∼ 5 and C1 ∼ 5, of these printed composite CT and ST specimens, respectively, were defined for experimental and numerical analyses, as shown in .
A Micro-Epsilon TIM450 miniature infrared camera was used to record and monitor the temperature distribution throughout the entire printing process. Differential scanning calorimetry (DSC) experiments were carried out for measuring the heat flow versus temperature curves, where the heating rate was defined as 10 °C/min in accordance with previous DSC experimental tests [Citation26]. To calculate the crystallinity of the 3D printed composite specimens, the measurement points are shown in . Specifically, during the DSC tests, small cubes of each specimen were cut according to the five measurement points. Then, each cube of ∼10 mg was attached on an aluminum crucible, which was further subjected to an enclosed chamber with an initial temperature of 23 °C and a constant pressure of 0.05 MPa under a full nitrogen atmosphere. The DSC measurement was implemented until the temperature reaches 230 °C, and all data was recorded by the DSC system. The warpage along the height direction of the ST and CT specimens was measured using a CHR 150 chromatic confocal sensor. In order to guarantee the accuracy and reliability of the experiments, three specimens of either ST or CT were prepared and repetitively tested.
3. Modelling
3.1. Constitutive modelling
In this study, numerical modelling was performed based on MSC-digimat-AM software. The constitutive modelling was performed by integrating the thermal thermoelastic and crystallization kinetic models. The thermal model is widely applied based on the classical governing equations for heat transfer [Citation27–30]. The temperature distribution derived from the thermal model was coupled into the thermoelastic model to calculate the strain, stress distribution, and warpage of the specimens. Meanwhile, a crystallization kinetics model, proposed by Nakamura [Citation31], was used to calculate the specimens’ crystallization, to account for the non-isothermal crystallization. The model’s effectiveness in predicting the polymers’ crystallinity has been witnessed in various applications [Citation27, Citation32–34].
3.2. Computational definition and boundary conditions
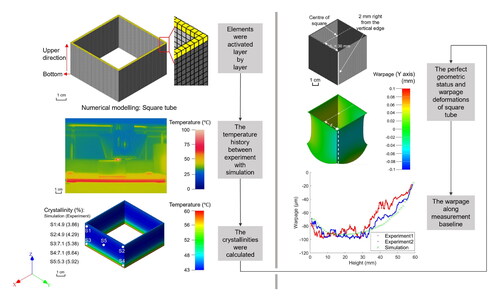
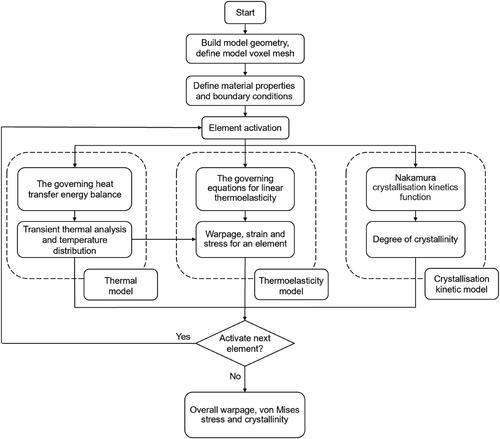
First, the simulation model was discretized with voxel elements in MSC software [Citation35]. Here, voxels are simply three-dimensional pixels. These are fine cells or cubes used to form a 3D model and they are closer to the physical reality than the traditional triangular mesh used for representation of the FFF process. They also provide greater accuracy and more convenience for finite element calculations [Citation36, Citation37]. The AM approach, i.e., the FFF process, is straightforward to simulate by activating the model elements one by one, according to the printing time history imported from actual experimental definitions. Specifically, the simulation starts from the bottom most layer and activates the voxel mesh one by one as the nozzle moves back and forth or up and down. When one layer is printed (i.e., the corresponding elements are activated), as shown in , the nozzle moves upwards along the Z axis and continues to deposit the next layer (where the corresponding elements will be activated). The meshwork and elemental activation (yellow) are shown in . The flowchart for the numerical modelling of the FFF process for composite parts is summarized in .
Figure 2. Meshwork and schematic to illustrate the calculation process using active elements.
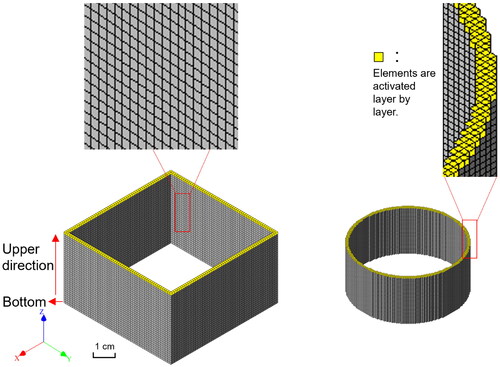
Figure 3. Flowchart for numerical modelling of the FFF process for composite parts.
In the simulation, a fixed temperature (60 °C) was applied on the bottom of the model according to the heated bed of the printer. The mesh-convergence analysis and setup of boundary conditions were performed to establish the basic numerical model. The primary material relations and parameters used for modelling of the composite parts are presented in and , respectively. Note that some parameters, e.g., the Stefan-Boltzmann constant [Citation35], Avrami index [Citation38], and crystallization rate constant [Citation38] were applied for calculating the thermal radiation and crystallinity. The DSC experiment was conducted to acquire the heat flow as a function of temperature, so the degree of crystallinity of thermoplastic polymers was determined by calculating the area under the crystallization peak as reported in [Citation39]. To fit the experimental result with respect to the crystallinity versus temperature curve, the shape, scale, and magnitude parameters of the Nakamura crystallization kinetics model were optimized and shown in . Usually, there is a cold crystallization peak during the crystallization process for PLA materials [Citation41], and this is also existed for SCF/PLA materials in this study. Hereby, this phenomenon was taken into account in calculation of crystallinity, i.e., by letting the enthalpy of melt crystallization minus the enthalpy of cold crystallization for acquiring the final enthalpy [Citation42]. As well, the cold crystallization peak was also considered in the simulation when using the Nakamura crystallization kinetics model.
Figure 4. (a) Specific volume (b) specific heat capacity (c) Young’s modulus and (d) thermal conductivity versus temperature [Citation43–46].
![Figure 4. (a) Specific volume (b) specific heat capacity (c) Young’s modulus and (d) thermal conductivity versus temperature [Citation43–46].](/cms/asset/ae7df31c-92a9-4d39-88ca-735b9bbc8412/yadm_a_2171940_f0004_c.jpg)
Table 1. Primary material parameters used in the numerical simulation.
4. Results and discussion
The heat flow versus temperature curves at five measurement points of the ST and CT composite specimens are depicted in , respectively. Note that the first of each-type tube among three specimens was used for illustrating the results as shown in , while in the subsequent measurements, the crystallization, warpage, etc. were calculated or determined based on the test results of three specimens. Obviously, there are three heat flow peaks, where the first peak is the glass transition peak of the material. When the temperature rises above the glass transition temperature, the molecular chains within the material begin to move and these molecular chains absorb heat to reach the equilibrium enthalpy, so the first heat absorption peak occurs. The second exothermic peak is the cold crystallization peak, which is caused by insufficient curing time for the ordered molecular chains, with a rapid cooling behavior of the material. The third peak with heat absorption is the melt crystallization peak, owing to the breaking and rearrangement of the molecular chains at the melting point.
Figure 5. DSC results of heat flow versus temperature curves at five measurement points of (a) ST and (b) CT composite specimens.
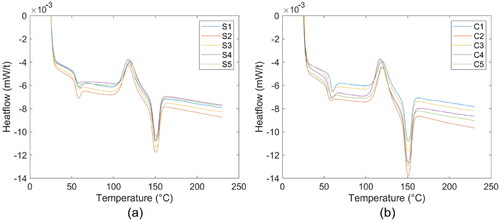
Based on the heat flow-temperature curves, the crystallinity was calculated. The difference between the ST and CT is that the crystallinity of the ST is higher than that of the CT composite parts, which is further described and explained in the following paragraphs. For numerical calculation, the heat flow versus temperature curves were then used to evaluate the three key parameters of the Nakamura crystallization kinetics model, as described in Section 3.2.
introduces the temperature distribution and crystallinity at five measurement points during the FFF process of the ST and CT specimens by experiment and simulation. It can be seen that the bottoms of the composite tubes remain at a higher steady temperature in both the experiment and simulation due to the heated bed of the 3D printer. Additionally, the heat is apparently transferred upwards, layer by layer.
Figure 6. Temperature distribution during FFF process of ST and CT specimens for experiment and simulation.
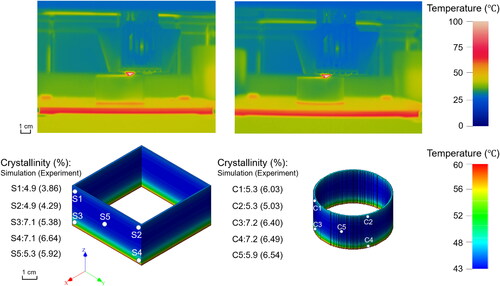
By integration of the DSC results in , as mentioned before, the crystallinity can accordingly be calculated at five measurement points. As shown in , the crystallinities at the bottoms of both the ST and CT specimens are higher than those at the middles and tops. This is due to the influence of the heated bed, in that the materials are crystallized with thorough curing at the base of the specimens. The middle area layers show more crystallinity than the upper area layers because, during the printing process, the printed filaments in middle layers have received heating for a longer time than those of the upper area layers.
At the measurement points, the crystallinity of the ST specimen (average crystallinity: simulation 5.86%, experiment 5.22%) is basically lower than that of CT specimen (average crystallinity: simulation 6.18%, experiment 6.1%). This is because the circumference of the ST specimen is greater than that of CT specimen, therefore more time was spent in printing the ST specimen, resulting in a quicker heat drop and less crystallization.
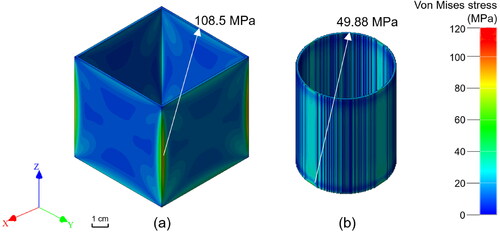
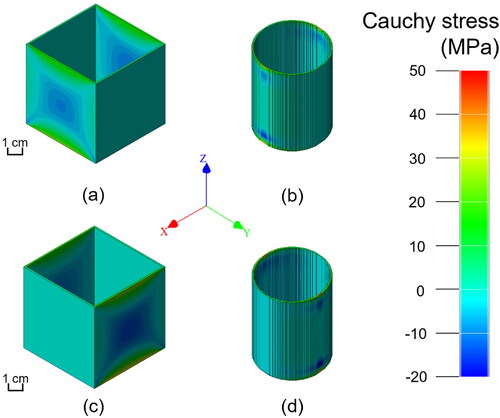
In , the stress analyses for the residual stress and manufacturing conditions of the ST and CT specimens are depicted. It can be seen that the significant stresses in the ST are mainly concentrated at four vertical edges, while the residual stresses in the CT are mainly concentrated at the edges of the two rounded corners. The maximum residual stress (49.88 MPa) in the CT specimen is much less than those (108.5 MPa) in the ST. The uneven stress distribution with “vertical stripes” in the CT specimen is due to the use of voxel elements (see ). Thus it is usually difficult to completely represent the curved arc, i.e., for circular tubes. This leads to the uneven stress distribution resulting from the specific elemental configurations. However, as previously mentioned, the voxel mesh is computationally efficient and convenient for modelling the FFF process with acceptable accuracy and for an increasing number of applications [Citation37, Citation50–52].
Figure 7. Stress distribution in (a) ST and (b) CT specimens.
shows the perfect geometric status of the composite parts and the baselines for warpage measurement (marked in white). The warpages are too small to be visually inspected in the additively manufactured specimens. Therefore, using simulations, the warpage deformations along the out-of-plane direction only are scaled 100 times for better observation, as shown in . Basically, we can see that, along the measurement baseline, the warpages are significant in the central area. shows the warpage deformations from the bottom to the upper area of the ST and CT specimens, acquired through both experiments and simulation. For , the warpages of the ST specimens were calculated by d-d0 based on . Likewise, the warpages of the CT specimens were calculated by r-r0 based on . Basically, the numerical model can well predict the trend of warpage deformation versus height, while discrepancies can be still captured. The prediction deviations are mainly resulted from the use of some material parameters. For instance, the coefficient of thermal expansion, etc. as shown in and , were adopted from literatures. Hence, if available, it is recommended to experimentally characterize all the material parameters for the numerical calculations so as to improve the predictive accuracy.
Figure 8. The perfect geometric status of (a) ST and (b) CT specimens, and the 100 times magnified out-of-plane warpage deformations of additively manufactured (c) ST and (d) CT specimens, and a schematic to exhibit the warpage measurement baselines along the height direction (Z axis).
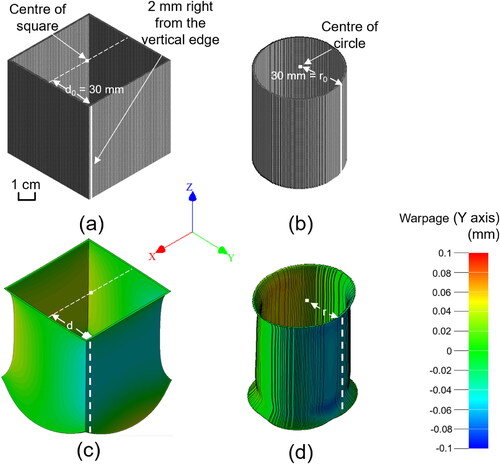
Figure 9. The warpage along the measurement baseline (Z axis) from bottom to upper direction of (a) ST and (b) CT specimens by simulation and experiments.
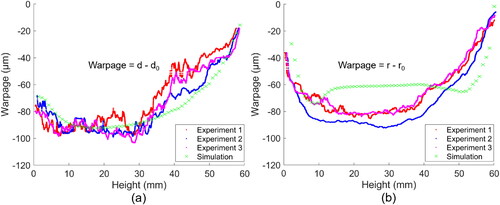
The results clearly show that the out-of-plane deformations at the bottom area (on the bed) are generally greater than those at the upper area (underneath the nozzle). This is because the further applied layers additionally compress the previously printed ones due to their higher shrinkage rates, while previously printed layers inhibit the free shrinkage of subsequently printed layers [Citation53]. Similar results can also be found in a previous study [Citation54] where the warpages of the upper layers are smaller than those of the previously deposited layers underneath. In addition, an initial peak of warpage can be captured in both the ST and CT specimens. This is the result of less deformation of the bottom layers since they have had thorough heating/curing and bonding contributed from the heating bed. Generally, the warpage of the ST specimen is more severe than that of the CT specimen.
Basically, the out-of-plane warpage is mostly severe at the central area, which is consistent with experimental results as reported in [Citation28]. Specifically, as shown in , according to the distribution of Cauchy stress XX and YY of ST and CT specimens, it is found that the top and bottom of the ST and CT specimens are generally tensioned with comparatively less warpage deformations, while the central area is primarily under compression with heavier warpage deformation [Citation28]. This mechanism leads to the hourglass-like deformation configurations, i.e., in the CT specimen, as shown in . This is consistent with the results reported by Dunbar et al. [Citation28] though their specimens were fabricated using selective laser melting (SLM), indicating that FFF and SLM technologies, both with a layer-by-layer approach, may lead to similar material behaviors during AM of engineering thermoplastic tubes.
Figure 10. Cauchy stress XX of (a) ST and (b) CT specimens and Cauchy stress YY of (c) ST and (d) CT specimens.
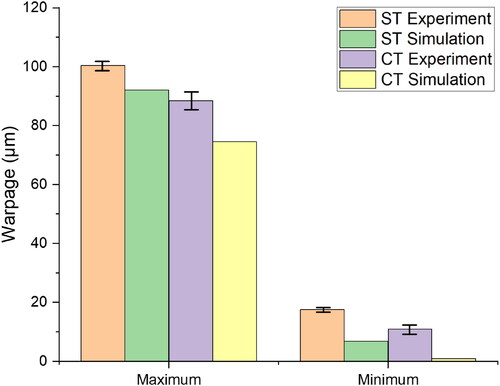
shows the maximum and minimum warpages of ST and CT specimens by experiments and simulation, extracted from the results in . Nevertheless, the warpage is generally insignificant, mainly owing to the comparatively high stiffness of SCF/PLA materials. The comparative study indicates that the maximum warpage value of ST is 100.47 µm (±2.63 µm), which is greater than that of the CT specimens at 88.45 µm (±4.27 µm). Similarly, the minimum warpage value of the ST lies in the range of 17.38 ∼ 17.82 µm which is also higher than that of the CT (9.06 µm∼12.8 µm). In addition, the simulation results agree well with the experimental ones, proving the accuracy of the numerical models. Obviously, the warpage values of the ST specimens are greater than those of the CT specimens, indicating that the CT structural part possesses better forming appearance than the ST structure when using FFF technology.
Figure 11. A comparative study for the maximum and minimum warpages of ST and CT specimens acquired by both experiments and simulation.
5. Conclusions
In this study, the residual stress and warpage of additively manufactured SCF/PLA composite parts with ST and CT geometries were investigated via both experimental and numerical approaches. Key remarks are given as follows:
To predict and analyze the FFF process and manufacturing performance of SCF/PLA composite parts, i.e., ST and CT structures, a multi-physics field model considering thermoelastic relations and crystallization kinetics was developed based on the numerical “activated elements.” Besides, the paramount numerical parameters were experimentally characterized to refine and establish the numerical model for prediction and analysis.
The experimental and numerical results revealed that the ST specimens have lower crystallinity (5.22%) and higher maximum stress (108.5 MPa) than the CT ones. This is mostly because of the existence of edges and corners in the CT. The experimental results show that the maximum and minimum warpages of the ST specimens (i.e., 97.84–103.1 µm and 17.38–17.82 µm) are higher than those of the CT specimens (i.e., 84.18–92.71 µm and 9.06–12.8 µm). By comparison, the numerical results agree well with the experiments in terms of FFF process, crystallinity, and warpages. Based on simulation, the residual stresses in the ST specimens are more significant and appear along the edges when compared to those in the CT specimens which have basically uniform distributions. Overall, the CT parts have a better printing appearance than the ST structures when using the FFF.
There is less crystalline material at the upper layer than at the lower layer, so it is recommended to increase the chamber temperature to improve the printing appearance with less warpage. In addition, within the numerical scheme, it will be convenient to further optimize the FFF process for manufacturing high-performance SCF/PLA composite parts in the future.
Disclosure statement
No potential conflict of interest was reported by the author(s).
Data availability statement
The data that support the findings of this study are available from the corresponding authors, Yuan Chen and Lin Ye, upon reasonable request.
Additional information
Funding
References
- Liao Y, Liu C, Coppola B, et al. Effect of porosity and crystallinity on 3D printed PLA properties. Polymers. 2019;11(9):1487.
- Gallinger S, Mücke S, Kraft M. A multiaxial FDM process adapted for the manufacture of scoliosis braces. Biomed. Eng. 2021;66(s1):S273–S277.
- Capela C, Oliveira S, Ferreira J. Fatigue behavior of short carbon fiber reinforced epoxy composites. Compos, Part B: Eng. 2019;164:191–197.
- Kokkinis D, Schaffner M, Studart AR. Multimaterial magnetically assisted 3D printing of composite materials. Nat Commun. 2015;6(1):1–10.
- Love LJ, Kunc V, Rios O, et al. The importance of carbon fiber to polymer additive manufacturing. J Mater Res. 2014;29(17):1893–1898.
- Tekinalp HL, Kunc V, Velez-Garcia GM, et al. Highly oriented carbon fiber–polymer composites via additive manufacturing. Compos Sci Technol. 2014;105:144–150.
- Chen Y, Ye L, Kinloch A, et al. 3D printed carbon-fibre reinforced composite lattice structures with good thermal-dimensional stability. Compos Sci Technol. 2022;227:109599.
- Van de Werken N, Tekinalp H, Khanbolouki P, et al. Additively manufactured carbon fiber-reinforced composites: state of the art and perspective. Addit Manuf. 2020;31:100962.
- Chen Y, Ye L, Dong H. Lightweight 3D carbon fibre reinforced composite lattice structures of high thermal-dimensional stability. Compos Struct. 2022;304:116471.
- Nawafleh N, Celik E. Additive manufacturing of short fiber reinforced thermoset composites with unprecedented mechanical performance. Addit Manuf. 2020;33:101109.
- Chen Y, Ye L, Han X. Experimental and numerical investigation of zero Poisson’s ratio structures achieved by topological design and 3D printing of SCF/PA. Compos Struct. 2022;293:115717.
- Bettini P, Alitta G, Sala G, et al. Fused deposition technique for continuous fiber reinforced thermoplastic. J Mater Eng Perform. 2017;26(2):843–848.
- Ning F, Cong W, Qiu J, et al. Additive manufacturing of carbon fiber reinforced thermoplastic composites using fused deposition modeling. Compos, Part B: Eng. 2015;80:369–378.
- Tian X, Liu T, Yang C, et al. Interface and performance of 3D printed continuous carbon fiber reinforced PLA composites. Compos, Part A: Appl Sci Manuf. 2016;88:198–205.
- Abderrafai Y, Mahdavi MH, Sosa-Rey F, et al. Additive manufacturing of short carbon fiber-reinforced polyamide composites by fused filament fabrication: formulation, manufacturing and characterization. Mater Des. 2022;214:110358.
- Gupta A, Hasanov S, Fidan I. Thermal characterization of short carbon fiber reinforced high temperature polymer material produced using the fused filament fabrication process. J Manuf Processes. 2022;80:515–528.
- Zaharia SM, Pop MA, Chicos L-A, et al. Compression and bending properties of short carbon fiber reinforced polymers sandwich structures produced via fused filament fabrication process. Polymers. 2022;14(14):2923.
- Talagani M, DorMohammadi S, Dutton R, et al. Numerical simulation of big area additive manufacturing (3D printing) of a full size car. SAMPE J. 2015;51(4):27–36.
- Barocio E, Brenken B, Favaloro A, et al. Extrusion deposition additive manufacturing with fiber-reinforced thermoplastic polymers. Structure and properties of additive manufactured polymer components. Elsevier; 2020; p. 191–219.
- Shepard TG, Wentz J, Bender T, et al. Impact of print parameters on pressure drop in turbulent flow through 3D printed pipes. Fluids Engineering Division Summer Meeting. American Society of Mechanical Engineers; 2020.
- Derazkola HA, Khodabakhshi F, Gerlich A. Fabrication of a nanostructured high strength steel tube by friction-forging tubular additive manufacturing (FFTAM) technology. J Manuf Processes. 2020;58:724–735.
- Arnold B, Altenhof W. Experimental observations on the crush characteristics of AA6061 T4 and T6 structural square tubes with and without circular discontinuities. Int J Crashworthiness. 2004;9(1):73–87.
- Xing J, Xu P, Yao S, et al. Study on the layout strategy of diaphragms to enhance the energy absorption of thin-walled square tubes. Structures. Elsevier; 2021;29:294–304.
- Kumar R, Chohan JS, Kumar R, et al. Hybrid fused filament fabrication for manufacturing of Al microfilm reinforced PLA structures. J Braz Soc Mech Sci Eng. 2020;42(9):1–13.
- Ansari AA, Kamil M. Effect of print speed and extrusion temperature on properties of 3D printed PLA using fused deposition modeling process. Mater Today: Proc. 2021;45:5462–5468.
- Harris AM, Lee EC. Improving mechanical performance of injection molded PLA by controlling crystallinity. J Appl Polym Sci. 2008;107(4):2246–2255.
- Samy AA, Golbang A, Harkin-Jones E, et al. Prediction of part distortion in fused deposition modelling (FDM) of semi-crystalline polymers via COMSOL: effect of printing conditions. CIRP J Manuf Sci Technol. 2021;33:443–453.
- Dunbar AJ, Denlinger ER, Gouge MF, et al. Experimental validation of finite element modeling for laser powder bed fusion deformation. Addit Manuf. 2016;12:108–120.
- Armillotta A, Bellotti M, Cavallaro M. Warpage of FDM parts: experimental tests and analytic model. Rob Comput-Integr Manuf. 2018;50:140–152.
- Giri TR, Mailen RW. Thermomechanical behavior of polymeric periodic structures. Addit Manuf. 2022;49:102512.
- Nakamura K, Katayama K, Amano T. Some aspects of nonisothermal crystallization of polymers. II. Consideration of the isokinetic condition. J Appl Polym Sci. 1973;17(4):1031–1041.
- Seo J, Zhang X, Schaake RP, et al. Dual Nakamura model for primary and secondary crystallization applied to nonisothermal crystallization of poly (ether ketone). Polym Eng Sci. 2021;61(10):2416–2426.
- Zhao M, Wudy K, Drummer D. Crystallization kinetics of polyamide 12 during selective laser sintering. Polymers. 2018;10(2):168.
- Amado A, Wegener K, Schmid M, et al. Characterization and modeling of non-isothermal crystallization of polyamide 12 and co-Polypropylene during the SLS process. In 5th International Polymers & Moulds Innovations Conference, Ghent. 2012.
- Jelle BP, Kalnaes SE, Gao T. Low-emissivity materials for building applications: a state-of-the-art review and future research perspectives. Energy Build. 2015;96:329–356.
- Lv C, Lin W, Zhao B. Voxel structure-based mesh reconstruction from a 3D point cloud. IEEE Trans Multimedia. 2021;24:1815–1829.
- Bacciaglia A, Ceruti A, Liverani A. A systematic review of voxelization method in additive manufacturing. Mech Ind. 2019;20(6):630.
- Chen P-Y, Lian H-Y, Shih Y-F, et al. Preparation, characterization and crystallization kinetics of kenaf fiber/multi-walled carbon nanotube/polylactic acid (PLA) green composites. Mater Chem Phys. 2017;196:249–255.
- Gray AP. Polymer crystallinity determinations by DSC. Thermochim Acta. 1970;1(6):563–579.
- Digimat-AM Manual. Hexagon; 2022.
- Puchalski M, Kwolek S, Szparaga G, et al. Investigation of the influence of PLA molecular structure on the crystalline forms (α’and α) and mechanical properties of wet spinning fibres. Polymers. 2017;9(1):18.
- Gong X, Pan L, Tang CY, et al. Investigating the crystallization behavior of poly (lactic acid) using CdSe/ZnS quantum dots as heterogeneous nucleating agents. Compos, Part B: Eng. 2016;91:103–110.
- Montes-Zavala I, Castrejón-González E, Sánchez-Balderas G, et al. Effect of H bonds on thermal behavior and cohesion in polylactic acid nanocomposites and nitrogen-doped carbon nanotubes. J Mater Sci. 2020;55(8):3354–3368.
- Zhang J, Wang S, Qiao Y, et al. Effect of morphology designing on the structure and properties of PLA/PEG/ABS blends. Colloid Polym Sci. 2016;294(11):1779–1787.
- Righetti MC, Cinelli P, Mallegni N, et al. Thermal, mechanical, and rheological properties of biocomposites made of poly (lactic acid) and potato pulp powder. Int J Mol Sci. 2019;20(3):675.
- Mortazavi B, Hassouna F, Laachachi A, et al. Experimental and multiscale modeling of thermal conductivity and elastic properties of PLA/expanded graphite polymer nanocomposites. Thermochim Acta. 2013;552:106–113.
- Li Z, Liu Y, Lu H, et al. Tunable hyperbolic out-of-plane deformation of 3D-printed auxetic PLA shape memory arrays. Smart Mater Struct. 2022;31(7):075025.
- Mohammadizadeh M, Lu H, Fidan I, et al. Mechanical and thermal analyses of Metal-PLA components fabricated by metal material extrusion. Inventions. 2020;5(3):44.
- Wijnen B, Sanders P, Pearce JM. Improved model and experimental validation of deformation in fused filament fabrication of polylactic acid. Prog Addit Manuf. 2018;3(4):193–203.
- Singh UP, Swaminathan S, Phanikumar G. Thermo-mechanical approach to study the residual stress evolution in part-scale component during laser additive manufacturing of alloy 718. Mater Des. 2022;222:111048.
- Tedia S, Williams CB. Manufacturability analysis tool for additive manufacturing using voxel-based geometric modeling. 2016 International Solid freeform fabrication symposium. University of Texas at Austin; 2016.
- Favaloro AJ, Brenken B, Barocio E, et al. Simulation of polymeric composites additive manufacturing using Abaqus. Science in the Age of Experience; Chicago, IL; 2017; p. 103–114.
- Schmutzler C, Stiehl TH, Zaeh MF. Empirical process model for shrinkage-induced warpage in 3D printing. Rapid Prototyping J. 2019;25(4):721–727.
- Wang T-M, Xi J-T, Jin Y. A model research for prototype warp deformation in the FDM process. Int J Adv Manuf Technol. 2007;33(11):1087–1096.