
ABSTRACT
An underground structure called a siphon allows irrigation of water canals and channels to pass underneath water drains. Three groups of loads that may have an impact on the siphon’s Geotechnical stability are: (1) loads brought about by traffic and truck duties on bridges; (2) loads brought about by drain water on the siphon’s body; and (3) loads brought about by irrigation channels and the dynamic movement of sandals and bots. To address the problem, surveying was done to see if the body of the submerged Syphon had any deformations. A ground penetrating radar study of the research area will be used to pinpoint the exact location of the damaged parts and the areas of deformation in the body of the submerged Syphon. On the southwesterly side (the exit), three GPR profiles were made, and on the northeastern side (the mouth), five. To display the covered drainage body’s infrastructure, the measured GPR data were processed differently. Deformities and distortion areas in the body of the submerged siphon were discovered at various places and depths on the two sides of the siphon after the processed data were analyzed.
1. Introduction
A shallow, high-resolution geophysical technique called ground penetrating radar (GPR) uses high-frequency, pulsed electromagnetic waves. It is used for non-intrusive subsurface geologic and engineering investigations. GPR is considered a fast and cost-effective electromagnetic (EM) method, which can provide valuable information about shallow subsurface (Davis and Annan Citation1989). Using electromagnetic radiation in the microwave band (UHF/VHF frequencies) of the radio spectrum, this non-destructive utilisation detects signals that are reflected from subterranean structures. Numerous media, such as rock, soil, ice, fresh water, pavements, and constructions, can be used using GPR. Under the correct circumstances, GPR practitioners can identify subterranean objects, alterations in material characteristics, cavities, and fissures (Daniels Citation2004; Srivastav et al. Citation2020; Mansour et al. Citation2023).
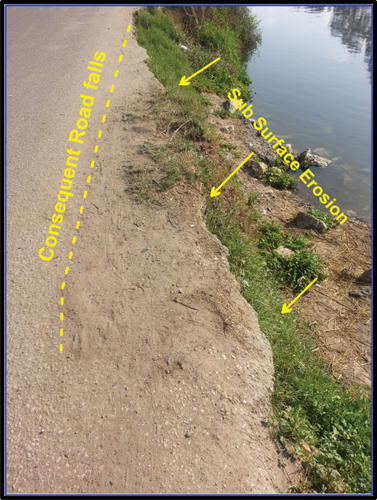
The study region is close to Ashur Bridge, a historic Syphon of Edku that has sunk into the Mahmoudia Channel, in Damanhur City (). Using a Geo-radar survey, the study measures the covered drainage body anatomically. To show the stress on the submerged Syphon’s body, the GPR profiles will be horizontal (). In the northern and on the side of the covered drainage, there are some distortions and devastated areas (). As depicted in , the asphaltic road partially falls over the body of the submerged Syphon in the southwest due to erosion of the mud layers that support the road beneath the asphaltic layer.
Figure 1. A map showing the research area’s location.
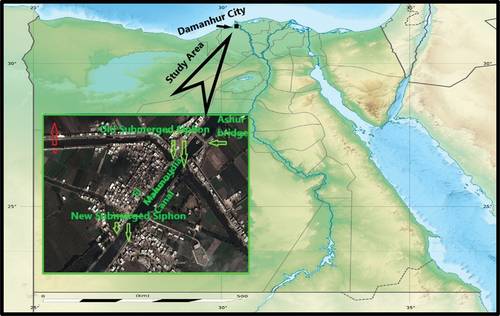
Figure 2. Eye bird view of the study region with the chosen GPR profiles.
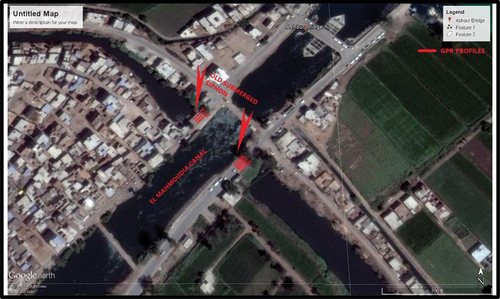
Figure 3. The northeastern shoulder of the submerged Syphon’s body. There are some distortions and devastated areas.
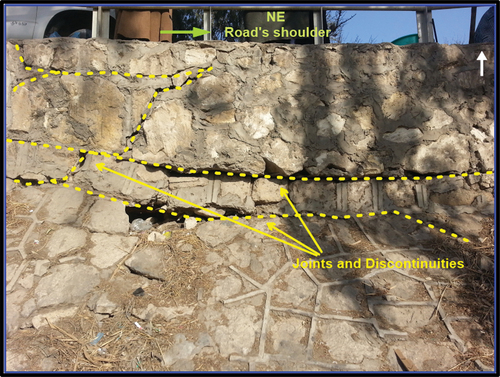
Figure 4. The asphaltic road partially falls on the southwestern shoulder of the submerged Syphon’s body.
1.1. GPR method concept
A ground-penetrating radar device is made up of a transmitter, a receiver, and a tool for data collection (). A radar transmitter uses an antenna to broadcast a radio signal into the surrounding area. The strength and direction of the reflected radio signal, which is captured by a receiver, determines the size and distance of the reflecting item (Daniels Citation1996).
Figure 5. GPR diagram from the website of Environmental Protection Agency, website.
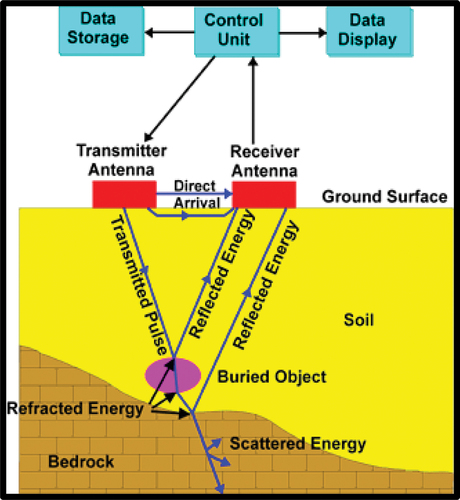
Compared to simply making horizontal plan maps, GPR has the advantage of producing comprehensive vertical soil profiles. Remember that GPR records, rather than direct images, the three-dimensional waves that bounce off objects on the ground in two dimensions (Davis and Annan Citation1989). Due to their alignment with the GPR’s electrical field, linear features will not provide high reflectance values. The only way that linear features can be recognised by GPR, however, is if they are parallel to the antenna’s path (Sharma Prem, Citation1997).
1.2. GPR data acquisition
The techniques for collecting GPR data are comparatively like those for seismic reflection. However, GPR is much more sensitive to changes in electromagnetic than caustic characteristics and therefore has a significantly higher resolution. GPR reflections are the result of electromagnetic waves encountering substances that have unique electrical properties, such as barriers composed of changes in the dielectric constant. Davis and Annan (Citation1989) found that there is an approximately inverse relationship between reflection and the variation in the dielectric constants at the boundary.
The 200 MHz antenna was tested using various device settings before the measurement. The unique environment of the site demonstrated its compatibility with monostatic technology. Radar recording was used to feed the device with the best depth of the target position. Additionally, we lessen electromagnetic emissions by eliminating all their sources and any outside influences. The entrance and departure of the submerged Syphon were measured on both sides, as shown in .
Figure 6. The GPR profiles directions over the submerged Syphon and the locations of the distortion places.
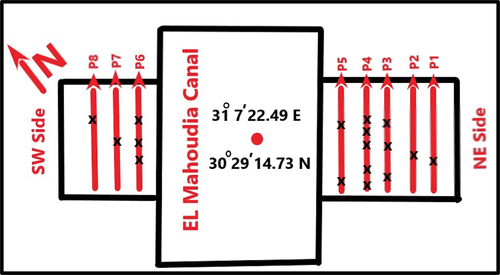
On the two sides of the submerged Syphon (Sahara), eight profiles were created. As depicted in , three profiles were created in the southwest (the exit) and five profiles were created in the northeastern (the entrance) of the Sahara. Each profile is 21 metres long and there are 2 metres between each profile. The study region was completely covered by the GPR profiles.
1.3. GPR data processing
The GPR raw data, which includes all the original data, must be mined for the necessary information. The volume of information cannot be increased with signal processing, but the quality or value of the information can be greatly improved for users with the correct signal processing. But if we don’t understand the importance of each step, there could be negative side effects. The interpretation of GPR data is erroneous because of these artefacts. This article’s goal is to explain the basic physics and arithmetic that pertain to the processing of GPR signals (Sato Citation2001).
The GPR profiles are processed using the software program (Reflex W, 2D/3D), which was built especially for the full processing and interpretation of 2 and 3-dimensional electromagnetic and seismic reflections. The most common GPR data formats are compatible with the program. The standard filter algorithms cover a wide range of techniques. The raw GPR data that was gathered was used. By analysing the data, the survey’s objectives, which included visualising the geotechnical elements inside and outside the siphon’s body, were met.
1.4. GPR data interpretation
The software program (Reflex W, 2D/3D), which is specifically created for the thorough processing and interpretation of 2 and 3-dimensional electromagnetic and seismic reflections, is used to process the GPR profiles. The application is compatible with the most popular GPR data formats. There are numerous specific methods included in the common filter algorithms. The GPR raw data that were collected underwent application. The survey’s goals, which included visualising the Geotechnical components inside and outside the siphon’s body, were achieved through the processing of the data.
If the subsurface were uniform, the GPR equipment would not record any reflections. As a result, the heterogeneity of the earth allows us to examine radar reflection data (Daniels Citation1989, Citation1996; Hempen and Hatheway Citation1992). The resulting picture (known as a “radar-gram”) has a startling resemblance to seismic reflection profiles. The shallow subsurface can be imaged vertically in cross-section using the non-destructive geophysical technique known as GPR. GPR acquisition is based on the propagation, reflection, and scattering of high-frequency electromagnetic waves inside the subsurface, by Gutierrez et al. (Citation2009) and Mustasaar et al. (Citation2012).
Ground Penetrating Radar (GPR) survey data can be processed and displayed in a variety of ways. The data can be qualitatively analysed on-site because it is displayed in real-time if the quality is sufficient. This method is both efficient and quick. Following processing, the raw data from the study region can be characterised and examined as follows.
1.5. Analysis of the northeastern side profiles
1.5.1. Analysis of profiles P1 and P2
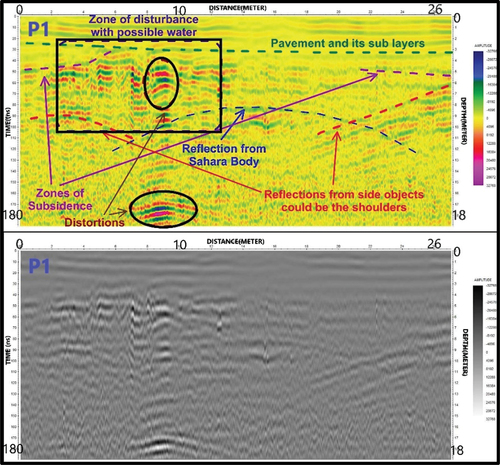
The GPR profile P1 () represents an anatomical case of the submerged Syphon body and its hard loads. The asphalt layers, the Sahara body, and its sides are clear and visible. Visual inspection of the variations in the reflections, it clear that there are some distortions on the left side of the submerged Syphon (distance of 9 m and depth of about 4 m) and it is being mixed with water. The slope reflections on the two sides refer to the Sahara shoulder.
Figure 7. The GPR profile (P1) shows some distortions on the left side of the submerged Syphon (distance of 9 m and depth of about 4 m).
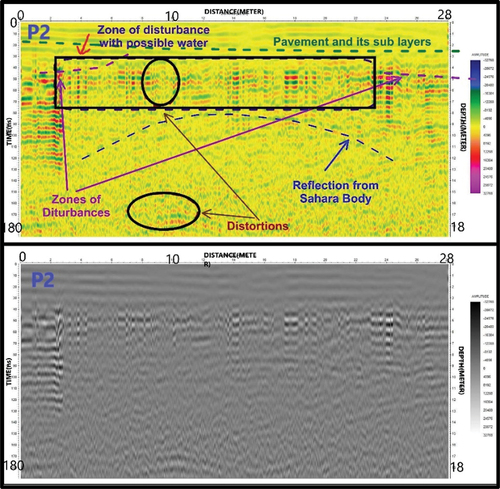
The GPR profile P2 () shows almost all the features that have been observed in profile P1, with a note that the probability of water availability is more apparent.
Figure 8. The GPR profile (P2) shows almost all the features (distortions) that have been observed in profile P1.
1.6. Analysis of profiles P3 and 4
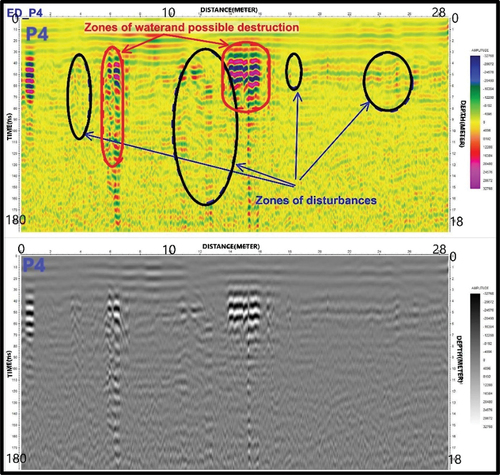
As shown in , although the GPR profile P3 presents a perspective that is somewhat different from the previous profiles (at distances of 4, 12, and 16 m and a depth of around 4 m), it was still feasible to restrict some of the areas that had previously been detected and were bounded by circles. In spots 4, 6, 12, 16, and 18 from the profile’s beginning and at a depth of roughly 4 m, the GPR profile 4 () Demonstrates the confirmed existence of water saturated in the marked red zones.
Figure 9. The GPR profile (P3) shows distortions which are bounded by circles.
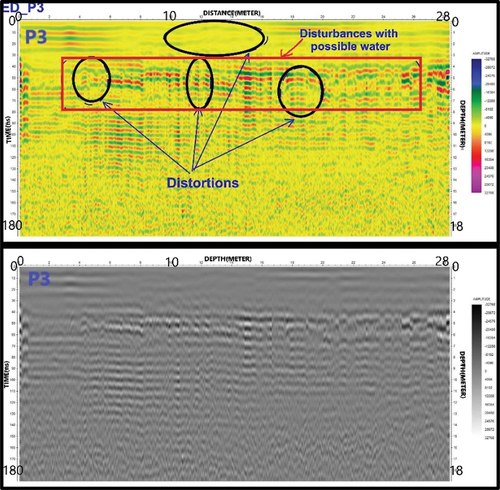
Figure 10. The GPR profile (P4) shows the existence of water-saturated and disturbances features.
1.7. Analysis of profiles P5
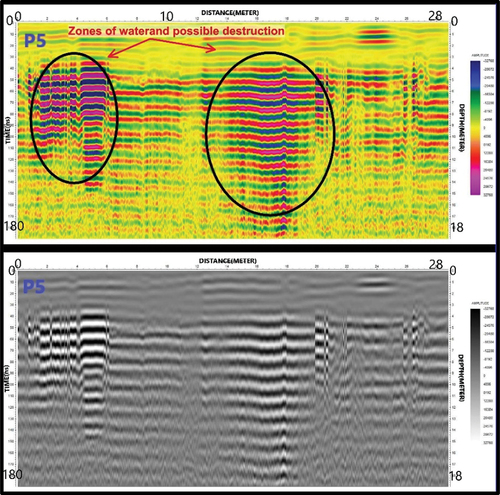
The GPR profile 5 shows a significant difference from the previous profiles, where the presence of water is very abundant and increases the chances of Sahara bodies falling in the places referred to in the profile (). The locations of the distortions are at 4 and 18 m and the depth is at about 3 m.
Figure 11. The GPR profile (P5). It shows zones of water-saturated possible destruction.
1.8. Analysis of the southwestern side profiles P6, P7, and P8
The same observations that were recorded in the interpretation of the previous profiles on the northeastern side of the submerged Syphon can be observed in profiles P6, P7, and P8. The fractures and distortions appear with the possibility of the presence of water in those places, which will increase the chance of landing and collapse of the submerged Syphon body in the direction of Mahmoudia channel ().
Figure 12. GPR profiles (P6, P7, and P8) are displayed. They show the places of possible cracks and damage.
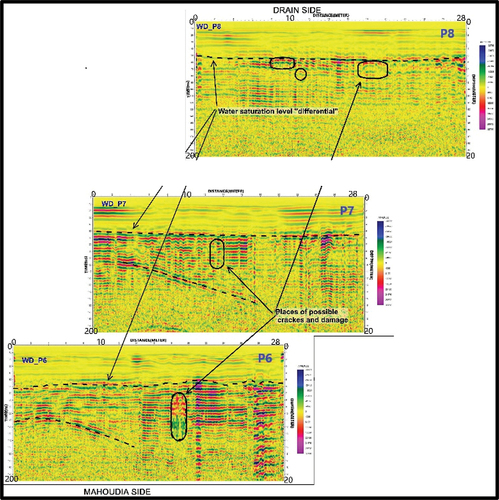
In profile P6, the fractures and the distortions appear at a depth of 5 m and distances from 8 to 18 m from the profile starting. In profile P7, there is a clear distortion place located at a depth of 5 m and 14 m. The third profile P8 shows fractures and distortions that appear at a depth of about 6 m and 19 m.
2. Conclusion
The study location is situated in Damanhur City not far from Ashur Bridge, a former submerged Syphon of Edku on the Mahmoudia River. A Geo-radar survey was used to take anatomical measurements of the body of the submerged Syphon. Using ground penetrating radar to survey the research region will make it easier to locate damaged components and locate where the covering drainage’s body has deformed. Subsurface interface radar (SIR system-10A) was employed in the current investigation. On each of the two sides of the covered drainage (Sahara), eight profiles were completed. Three profiles were created in the southwest of the submerged Syphon, while five were created in the northeast.
The software program (Reflex W, 2D/3D), which is specifically created for the thorough processing and interpretation of 2 and 3-dimensional electromagnetic and seismic reflections, is used to process the GPR profiles.
The interpretation and analysis of the GPR profiles (P1-P5) reveal that the northeastern entry of the buried Syphon is rather excellent. On the other hand, despite a dislocation of the shoulders and fissures in the asphalt opposite the channel, the situation deteriorates in the direction of the exit close by. The main body of the Sahara is also unaffected by frequent cracks and anomalies. Additional symptoms of deterioration and the presence of water near the channel warn us that it could collapse. The first three profiles show an object that might be connected to the Saharan body on the southeasterly edge of the first third of the Sahara.
The examination of the GPR profiles (P6-P8) on the southwest side of the submerged Syphon revealed that, despite being worse than the entrance, the covered drainage’s exit is generally good. Although there is more water in Profile P6 near the channel, the likelihood of collapse diminishes towards the buried Syphon and increases towards the channel.
The southwest’s asphaltic road partially collapses over the body of the submerged Syphon because of mud layers beneath the asphaltic layer eroding.
Disclosure statement
No potential conflict of interest was reported by the author(s).
References
- Daniels DJ. 1996. Surface-penetrating radar, in, IEEF radar, sonar, navigation and avionics series 6, E. D. R. Morangis, France: Institution of Engineering and Technology.
- Daniels DJ. 2004. Ground penetrating radar. 2nd ed. Knoval (Institution of Engineering and Technology); pp. 1–4.
- Daniels J. 1989. Ground penetrating radar in a symposium on the application of geophysics to engineering and environmental problems, March 13-16.
- Davis JL, Annan AP. 1989. Ground-penetrating radar for high-resolution mapping of soil and rock stratigraphy 1. Geophys Prospect. 37(5):531–551. doi: 10.1111/j.1365-2478.1989.tb02221.x
- Gutierrez JPG, Lucha P, Bonachea J, Jorda L, Jorda R. 2009. Investigation of a large collapse sinkhole affecting a multi-story building using geophysics and the trenching technique (Zaragoza city NE Spain). Environ Geol. 58:1107–1122. doi: 10.1007/s00254-008-1590-8.
- Hempen GL, Hatheway AW. 1992. Geophysical methods for hazardous waste site characterization, special pub. No. 3. Assn Eng Geol. Sudbury (MA): Association of Engineering Geologists.
- Mansour K, ABD EL Zaher M, Hafiz M, Ebrahim S, Gomaa M, Salem M. 2023. Detection for severe caves and sinkholes in nonclastic rock type using GPR technique. NRIAG J Astron Geophys. 12(1):121–131. https://www.tandfonline.com/loi/tjag20.
- Mustasaar M, Plado J, Jõeleht A. 2012. Determination of electromagnetic wave velocity in horizontally layered sedimentary target: a ground penetrating radar study from Silurian limestones, Estonia. Acta Geophys. 60:357–370. doi: 10.2478/s11600-011-0068-3.
- Sato M. 2001. Jung-Ho Kim, RADPRO/GPR V.3.0 user’s guide.
- Sharma PV. 1997. Environmental and engineering geophysics. Cambridge: Cambridge University Press; p. 1–475.
- Srivastav A, Nguyen P, McConnell M, Loparo KN, Mandal S. 2020. A highly digital multiantenna ground-penetrating radar System. IEEE Trans Instrum Meas. 69:7422–7436. S2CID 216338273. doi: 10.1109/TIM.2020.2984415.