
 ?Mathematical formulae have been encoded as MathML and are displayed in this HTML version using MathJax in order to improve their display. Uncheck the box to turn MathJax off. This feature requires Javascript. Click on a formula to zoom.
ABSTRACT
Ecological vulnerability refers to the degree of ecosystem disturbance, system damage, and the ability of system restoration. Although case-specific evaluations of ecological vulnerability are progressing rapidly, they have been carried out mainly in areas with intensive human activities or in harsh natural environments. Using the Web of ScienceTM core collection, this review paper summarized studies on ecological vulnerability published from 2000 to 2022 and analyzed in depth major case studies. It was found that traditional ecological vulnerability research has been addressed largely in terms of assessment models, data processing models, and analysis of influencing factors, however there was a lack of research on the process of vulnerability transformation. Because the vulnerability transformation in a hierarchical vulnerability index system is regulated by multiple factors in a heterogeneous region, it is urgent to understand how the ecological vulnerability in a region evolves from one level to another over time. Therefore this paper put forward the new perspective of research, i.e., applying quantitative analysis to identification of regulating factors and exploring the mechanisms of ecological vulnerability transformation. This new perspective could assist in monitoring the complex spatiotemporal changes in ecological vulnerability and taking necessary measures to prevent from decline of ecological stability.
Graphical abstract
Introduction
Ecological vulnerability is an estimate of the inability of an ecosystem to withstand stress (Williams and Kapustka Citation2000; Cao et al. Citation2022). As a specific attribute of an ecosystem, it reveals the potential of an ecosystem to regulate its response to stressors (Weißhuhn, Müller, and Wiggering Citation2018). Because ecosystem is affected by internal materials, overall structure, and external interferences, there are differences in regional ecological vulnerability characteristics (Turner et al. Citation2003; Wang, Liu, and Yang Citation2008). Ecological vulnerability assessment (EVA) is a necessary means to assess the differences of fragile state and spatial distribution pattern of regional habitats, which is of practical significance for maintaining the sustainable development of ecosystems (Li et al. Citation2009; Skondras et al. Citation2011). As an important part of Delineation of Ecological Protection Red Line in China, ecological vulnerability zoning is closely related to the stability of an ecological security pattern (Bai et al. Citation2016). Therefore, in-depth research on ecological vulnerability can better promote regional ecological delineation and optimize ecological security pattern (Nguyen et al. Citation2016). For countries with greater environmental pressure like China, ecological vulnerability research is often urgent and is the focus of research on environmental quality assessment.
The research on ecological vulnerability has been focused on developing EVA systems and data processing models (Li et al. Citation2006, Citation2009; Wang, Liu, and Yang Citation2008a; Wang et al. Citation2008; Ippolito et al. Citation2010; Zhao et al. Citation2018). Meanwhile, some vulnerability research frameworks highlight the beneficial roles of human activities in the coupling of humans and natural systems by introducing adaptive capacity as an evaluation criterion (Smit and Wandel Citation2006; Lindner et al. Citation2010; Pandey and Bardsley Citation2015; Weißhuhn, Müller, and Wiggering Citation2018; Chen et al. Citation2019). The establishment of a different index system and improvement of a data processing model can better reflect a regional ecological environment (Yue, Shen, and Yuan Citation2019b; Li and Cao Citation2019). However, most of the EVA studies did not identify the factors that regulated the spatial and temporal changes of ecological vulnerability. The regulating factors and mechanisms of spatiotemporal changes in ecological vulnerability need to be addressed with greater attention in the future.
Studying its regulating factors can elucidate the evolutionary causes of ecological vulnerability and provide a reasonable basis for ecological restoration projects (Choudhary, Boori, and Kupriyanov Citation2018). Past research has been focused on ecological vulnerability index (EVI) and status assessment in harsh natural environments or areas with intensive human activities (Li et al. Citation2009; Yu, Yang, and Shi Citation2012; Neshat, Pradhan, and Dadras Citation2014; Tran, O’Neill, and Smith Citation2012; Wu et al. Citation2017; Xue et al. Citation2019). There is little quantitative research on the factors that regulate the changes of ecological vulnerability in various evaluation units of a study area. Since each evaluation unit can be affected by various regulating factors, how to determine the most important regulating factor and quantitatively study the impacts of regulating factor variation on ecological vulnerability is in urgent need.
Due to the differences in the type of regulating factors and the geographical size of their impacts under certain conditions, the number of EVI levels that have changed and the area ratios of the changes can be significantly different. As illustrated in , the dynamic process of EVI-level transformation determines the evolution direction of ecological vulnerability in a region. Therefore, identifying the regulating factors and exploring the transformation mechanisms are the key means to intervene the evolution of ecological vulnerability in different regions (Hou et al. Citation2018). However, most of the studies so far remain on evaluating the state of ecological vulnerability and optimizing data processing models () (Wang et al. Citation2008; Xue et al. Citation2019; Zhao et al. Citation2018), while few studies have dug into the mechanism of ecological vulnerability transformation ().
Figure 1. Framework of regional ecological vulnerability research from conventional case studies to exploration into mechanism of vulnerability level transformation.

In an effort to promote exploration into the mechanisms of EVI-level transformation, this paper reviewed the application of the EVA systems and the corresponding data processing models, discussed the important roles of regulating factors in the EVI levels, and explored the approaches for quantitative analysis of regional EVI transformation. The new research perspective could be used to monitor the complex spatiotemporal evolution of ecological vulnerability. At the same time, necessary control measures could be combined to maintain regional ecological stability.
Research design and methodology
This paper reviewed the case studies involving different models and influencing factors, based on the results of literature search in the main databases (SCI Expanded, SSCI, CPCI, and BKCI). First, relevant articles were searched with the terms related to ecological vulnerability in the field of “title, abstract and key words.” Finally, we selected the typical case studies to classify the adopted models and the influencing factors.
The literature included in the review was limited to peer-refereed publications in English and Chinese, excluding books, reports, and conference proceedings. Earlier articles (Williams and Kapustka Citation2000; Villa and Mcleod Citation2002) facilitated the discussion of concepts, though most of them are recent conceptual explanations (Williams et al. Citation2000; Tran et al. Citation2002; Villa and Mcleod Citation2002; Turner et al. Citation2003; De Lange et al. Citation2010; Weißhuhn, Müller, and Wiggering Citation2018).
The primary search term was “ecological vulnerability evaluation.” This term has a very broad meaning, and the relevant literature may involve evaluation of pollutant concentration (Laura et al. Citation2015), construction of evaluation systems (Rao and Yang Citation2020; Jiang, Shi, Li and Guo Citation2021b), use of evaluation methods (Li, Shi and Wu Citation2021; Li and Cao Citation2019), evolution of ecological vulnerability (Liu et al. 2019; Liu, Huang, Su and Joung Citation2021), driving forces (Cai et al. Citation2017; Hou et al. Citation2018), etc. Therefore, additional search terms, such as “ecological vulnerability,” “environmental evaluation,” and “vulnerability evaluation” (Ippolito et al. Citation2019) were added to expand the scope of ecological vulnerability evaluation.
The identified papers were manually assessed to exclude irrelevant literature, and papers with significant differences from the detailed indicators were excluded. Since 2000, the research on the theme of “ecological vulnerability” has entered a substantial stage of rise, from the discussion of concept and framework to the case study of typical regions, outstanding results have been achieved. Therefore, the publication year is limited to 2000–2022, and the literature cited in this paper involves 126 academic papers, including 85 case studies. They were confirmed in the primary search and subsequent manual screening. The categorization of the relevant articles () focuses on explanation and analysis of “ecological vulnerability evaluation” so as to support the construction of the article analysis framework () and implementation of the literature review and discussion process ().
Figure 2. Upgrading ecological vulnerability assessment from traditional case studies to emphasizing mechanism of vulnerability changes.

Figure 3. The logical reasoning process in writing this paper.

Table 1. Categorization of the cited references.
These large numbers of ecological vulnerability papers reflect the characteristics of regional ecological vulnerability and the changes of regional ecological vulnerability. However, there is a lack of quantitative research on the transformation mechanism and driving force of ecological vulnerability evolution within the regions involved. Therefore, this study provides a new perspective, involving the study of applying quantitative analysis to identification of regulating factors and exploring the mechanisms of ecological vulnerability transformation, in order to achieve the purpose of evolutionary process monitoring.
Ecological vulnerability evaluation systems
Ecological vulnerability characterization involves topography, climate change, vegetation degradation, land suitability, desertification, salination, biodiversity degradation, and human activities. The evaluation of ecologically vulnerability areas requires comprehensive consideration of the actual ecological development of a study area. Selection of an EVA system is hence based on the contributions of different regulating factors to the study area. If different EVA systems are used to study the same area, the results can be different. Moreover, due to the complex temporal and spatial changes in an ecological region, the application options of the EVI system are not uniform (). Li et al. (Citation2009) characterized the ecological vulnerability of Danjiangkou from four aspects: land resources, hydrothermal climate, topography, and human activities. Hou, Li, and Zhang (Citation2015) constructed an EVA system for soil erosion in the Loess Plateau based on climate, topography, and social economy. Zou and Yoshino (Citation2017) established an EVA system for the Daxinganling area based on four major factors including terrain, forest inventory, social economy, and climate. Although the above studies were similar in scope, the researchers did not adopt a uniform EVI system when evaluating ecological vulnerability in different regions, which made the ecological vulnerability classification less comparable across study areas.
Table 2. Major ecological vulnerability evaluation systems.
To establish an EVI system, the principles of scientific soundness, objectivity, operability, and representativeness should be taken into account (Fan, Fang, and Zhang Citation2019). The determinants of ecological vulnerability at different scales interact with each other, and were influenced by ecological environment, social and economic structure, policies, and so on (Hou, Li, and Zhang Citation2015). Past studies on vulnerability developed evaluation systems based on specific environments or single factors (Choudhary, Boori, and Kupriyanov Citation2018; Li et al. Citation2006; Tran, O’Neill, and Smith Citation2012). Various EVI system models () have been proposed, including the comprehensive index model (Wang et al. Citation2008) as well as P-S-R (pressure-state-response) (Wu, Zong, and Peng Citation2012) and its modifications such as DPSIR (driver-pressure-state-impact-response) (Newton and Weichselgartner Citation2014), DPSIRM (driving force-pressure-state-impact response-management) (Zhang et al. Citation2017a), and VSD (vulnerability scoping diagram) (Zou and Yoshino Citation2017) models. There are shortcomings of the EVA systems: 1) the comprehensive model is easy to operate, but has strong subjectivity, weak indicator selection principle, and a biased calculation process in the data processing models; 2) it is a complicated process to establish a complete set of the PSR, DPSIR, or DPSIRM model because many indicators correlate and overlap, resulting in inconvenient operation and potential underestimation of the environmental and socio-economic uncertainties and the diversity of the causal relationships (Svarstad et al. Citation2008); and 3) in the VSD model, it is unclear whether the index reflects natural or human factors that the EVA system fails to clearly identify the vulnerability causes (Li and Fan Citation2014). As a result, the selection of evaluation criteria plays a key role in regional eco-environmental assessment. The operability and representativeness of indicators must be considered when introducing natural disaster factors and comprehensive human factors.
Data processing models
As summarized in , there are subjective models, objective models, and their modifications for data processing. Since the data used in an EVI system are usually derived from field surveys, statistical data, station observations, and topographic and geomorphic data, the EVI data often have spatial and geographical attributes. Meanwhile, it is difficult for the traditional data processing models to eliminate the influence of human factors on weight allocation. It is, hence, necessary to introduce geospatial technologies to improve the data processing models.
Table 3. Major data processing models in ecological vulnerability assessment.
The wide application of remote sensing (RS) and geographic information system (GIS) technologies has opened new channels and methods for EVA data analysis (Li et al. Citation2006; Zhao et al. Citation2018; Zhang et al. Citation2022). With RS and GIS, an index system can reflect the ecological environment with topographical, geomorphic, and natural disaster factors. The GIS spatial analysis technology can be used to study the relationships between ecological vulnerability and environmental factors and simulate spatial distribution of EVI. These two technologies have technical advantages to meet many needs of EVA by providing data sources and supporting model building and display platform construction.
Li et al. (Citation2006) used GIS and RS technologies to extract topographical factors of the Lancang River Basin and constructed a spatial principal component analysis (PCA) model to quantitatively study the changes in ecological vulnerability. Rapicetta and Zanon (Citation2009) proposed a new way of studying volcanic eruptions in environmental vulnerability by simulating Etna volcanic activity and using GIS to map ecological vulnerability. Hassan, Mahmud-Ul-Islam, and Rahman (Citation2015) used GIS and RS to identify and quantify the vulnerability of environmental degradation in the northwestern part of Bangladesh and classify its vulnerability intensity. Hou et al. (Citation2016a) and Zhang et al. (Citation2017b) extracted the environmental topographic factors of Yan’an and Fuzhou, respectively, applying RS and GIS to the analytic hierarchy process (AHP) model for weight allocation and comprehensive assessment of the spatial and temporal changes in EVI. With the support of GIS and RS, an EVA system of the Yellow River Delta was established, and the results of the EVI data were analyzed by the fuzzy AHP model (Wu et al. Citation2018).
lists the data processing methods commonly used in EVA research, which summarizes the subjective and objective models and their modifications for data processing. When using these methods, the source of the data and its objective authenticity are very important. Based on the characteristics of RS and GIS technologies, we believe that these two technologies can help us improve our research work when using the methods. Among them, RS technology can increase the data sources in a study area and help researchers to analyze the data more comprehensively, thus making the identified regulating factors more objective. GIS technology can improve the precision of data analysis in a research area and better display the temporal and spatial variation characteristics of ecological vulnerability in research areas through graphic simulation.
Research on the new perspective of ecological vulnerability
Factors regulating ecological vulnerability changes
Identification of factors regulating the changes in ecological vulnerability
In recent years, the ecological and environmental problems caused by global changes have become increasingly prominent, and ecological vulnerability has received more and more attention (Fekete, Damm, and Birkmann Citation2010; Hou, Li, and Zhang Citation2015; Li et al. Citation2006; Zhao et al. Citation2018). Site-specific studies quantify the changes of ecological vulnerability state and diagnose the regulating factors of the changes, though such studies involve largely one regulating factor or one type of regulating factors (Khandlhela and May Citation2006; Villa and Mcleod Citation2002) and lack of considerations in spatial variation of regulating factors. Li et al. (Citation2006) assessed the ecological vulnerability in the upper reach of the Minjiang River based on nine indicators in climate and topography and qualitatively discussed the factors affecting the EVI classification. Ippolito et al. (Citation2010) established EVA systems for watersheds and studied environmental health and vulnerability drivers at the basin scale. Abson, Dougill, and Stringer (Citation2012) mapped the ecological vulnerability of South Africa and qualitatively analyzed the main environmental factors. Sahoo, Dhar, and Kar (Citation2016) studied ecological vulnerability of the Hirakud region in India and concluded that elevation factors were the main factors affecting the variation of ecological vulnerability.
Human activities can also be important factors influencing EVI changes. Unreasonable land use can exacerbate the vulnerability of the ecological environment. A study by Skondras et al. (Citation2011) on EVA in Sweden pointed out that the increasing influence of human activities on the background of natural changes had become the dominant vulnerability factor, which aggravated the development of ecological vulnerability. Hou et al. (Citation2016a) analyzed the ecological vulnerability of the Loess Plateau in northern China and found that the land use change and the policy of returning farmland to forests were the main causes leading to the change of vulnerability. Choudhary, Boori, and Kupriyanov (Citation2018) argued that population growth, industrialization, and government environmental protection policies were the main factors contributing to changes in ecological vulnerability in the Astrakhan region of Russia. Yu et al. (Citation2019b) determined regional ecological vulnerability based on the interaction of the natural environment and human disturbance and identified the regulating factors to be tourism interference, traffic interference, alien species invasion, and land use.
The above studies showed that the regulating factors of vulnerability changes were different in different regions, including both natural and human factors. The regulating factors were mostly determined qualitatively and subjectively with inherent biases, lacking quantitative approaches and analysis of the spatial differentiation. Moreover, the EVI effects caused by different regulating factors may overlap in some cases that the effects of individual factors could not be clearly distinguished. How to compile the indicators in order to more effectively distinguish the vulnerability changes caused by different factors and evaluate the differences was a problem that needed to be solved in the future (Li and Fan Citation2014). In general, the development of vulnerability theory fell behind the case-specific evaluations in past studies.
Models to identify regulating factors
Ecological vulnerability state is the result of a combination of regulating factors. Since these factors are independent of each other, objective, and quantitative methods are needed to screen numerous factors and identify the main factors that regulate ecological vulnerability changes. A multivariate statistical analysis method such as PCA could convert multiple experimental observation variables into a few unrelated comprehensive components (Li et al. Citation2017). The main purpose of PCA is, by a series of mathematical operation of a correlation matrix, to obtain a factor load matrix that can easily reveal the internal relations as illustrated. Each observation variable is represented by a linear combination of a set of factors as given in EquationEquation 1(1)
(1)
where M1, M2, …Mt, are normalized variables with zero mean and unit variance;F1, F2, … Fj are common factors, being common to the observation variables and explaining the correlations between the variables; Ai is a special factor, being specific to the i-th observed variable and indicating the part of the variable that cannot be explained by the common factor; Aij is the factor load on the j-th common factor of the i-th observation variable; and ui represents the remaining part of the i-th variable that cannot be explained by any of the common factors. The main process is explained as follows:
Standardize evaluation index variables
The original data X is set as an n×m dimensional observation matrix, where n is the number of samples, and m the number of evaluation indicators.
Generally, the original data is normalized, that is, a variable is subtracted from its mean and then divided by the standard deviation (σ). Y represents the matrix of yij.
Calculate the eigenvalues, eigenvectors, and contribution rates of the correlation matrix
Calculate the sample correlation coefficient matrix , then find the m-th eigenvalues
of the correlation matrix R and the corresponding eigenvectors
,
, the contribution rate of which
.
Determine the number of common factors
Calculate the principal components , where
is an n × 1 dimensional vector,
,
, and take the first P principal component with eigenvalues greater than 1 as the common factor, then the initial factor is
Solve the load matrix O of the initial factors
Rotate the load matrix of the initial factor
There are many orthogonal rotation methods for the factor load matrix. This study uses the maximum variance rotation. The principle is to maximize the variance of the factor load values in the factor load matrix through rotation. Select rotation matrix ,
Differentiate into 0 or 1 polarity in rows or columns to obtain a more significant public factor, that is, Q can make the first new factor obviously represent some indicators; the second new factor represents some other indicators. Expressed by the formula, that is, choose ∏ to maximize the variance Φ:
where: ,
,
R is the correlation matrix,
Calculate factor score F
is the comprehensive factor of
,
The factor load matrix can be used to study both the main formation factors and evolution process of ecologically vulnerable areas. As an example, Hou et al. (Citation2018) analyzed the observation variable matrix using the spatial PCA model and identified the main regulating factors that led to the ecological vulnerability. Their findings showed that the principal components I, II, and IV with a total loading of 64.5% revealed its regulating factors to be the social and economic factors (Hou et al. Citation2018).
Methods to identify mechanisms of vulnerability transformation
The current research on fragile ecological environment is mainly based on the application of theories in ecology and geography for general evaluation. Research on the formation mechanism of vulnerable ecological environment mainly focused on factor discrimination, less on the evolution mechanisms of spatial distribution (Hou et al. Citation2018). From the introduction of the ecological vulnerability concept to the current research using different models, the research has been restricted to evaluation of the ecological vulnerability state (Beroya-Eitner Citation2016), while ignoring the EVI classification and transformation of EVI levels over time. Classification of ecological vulnerability, as the premise of research on transformation mechanism, can represent the degrees of regional ecological vulnerability.
Ecological vulnerability transformation is affected by the internal and external linkages and feedback processes of the ecosystems, and changes between EVI levels are also dynamic. The diversity of the human-environment coupled system and the complexity of the internal nesting process require a comprehensive analysis of the responses to environmental stresses within each geospatial unit and the feedback of the environment to human activities (). This is the main reason why the vulnerability transformation process is difficult to measure and transformation mechanisms are difficult to find. Researchers have combined vulnerability and sustainable development in qualitative research (Bo and Lianjun Citation2008; Lee Citation2014). The transformation of EVI levels directly leads to changes in the stability of ecological environment in different regions, which is extremely important for stability and sustainable development of the ecological environment.
Figure 4. Analysis on unitization of ecological vulnerability transformation mechanism.

Construction of ecological vulnerability transformation matrix
As shown in EquationEquation 15(15)
(15) , an ecological vulnerability transformation matrix can be constructed to represent the EVI-level changes from the initial to final state in a certain period. It not only includes static ecological vulnerability area data at a certain time point in a certain area, but also contains information about the transformation of the EVI levels from the initial to the final state.
Where x represents the number of EVI levels at the beginning and end of a transformation period; i and j represent the EVI levels before and after the transformation, respectively; and fij represents the area of a change in ecological vulnerability level from i to j. Each row in the matrix represents the resultant information of each EVI level after the transformation of the i-th ecological vulnerability level. Each column in the matrix represents the source information of each ecological vulnerability level before the transition from the j-th level.
For convenience, the same EVI classification system is used before and after the transformation so that the numbers of rows and columns of the matrix are the same, that is, an N-order square matrix. The ecological vulnerability transformation matrix contains more information on the mutual transformation between the EVI levels at the beginning and end of a study period and is rich in statistical significance. Based on the results of the EVI classification at different time points, the EVI-level transformation matrix can be constructed in GIS for individual evaluation units. The mechanisms of the vulnerability transformation can then be identified for the entire region, which is of great significance for studying the evolution of regional ecological vulnerability.
Case study on transformation of ecological vulnerability
Research defects in spatial changes of ecological vulnerability
The Qinling mountain area, one of the landmarks dividing the north and south of China, was taken as an example to demonstrate the matrix operation for ecological vulnerability transformation. Hou et al. (Citation2018) evaluated ecological vulnerability of this area for years 2000 and 2006 using an EVI system that included 12 sub-influencing factors representing the natural environment and social economy. Spatial PCA was used for data processing, meaning that EVI was the sum of the weighted principal components as given in EquationEquation 15(15)
(15) (Hou et al. Citation2018). Four principal components were identified. The EVIs for 2000 and 2006 were then expressed in EquationEquation 15
(15)
(15) and EquationEquation 15
(15)
(15) , respectively. EVI was calculated for individual evaluation units for 2000 and 2006 in ArcGIS 10.3.
where EVI is the ecological vulnerability index; r is the contribution ratio; P is the principal component; and m is the number of principal components.
where X1, X2, X3 and X4 are the principal components in 2000; and Y1, Y2, Y3 and Y4 are the principal components in 2006.
By comparing the ecological vulnerability index of the study area between 2006 and 2000, using traditional methods through overlay analysis, we can clearly see the areas where the ecological vulnerability index has increased and decreased. During this period, the areas where the ecological vulnerability index increased significantly were Zhashui, Hantai, Hanyin, and Ziyang, while the areas where the ecological vulnerability index decreased significantly were Lveyang, Ningshan, and Xunyang ().
Figure 5. The spatial change of ecological vulnerability index from 2000 to 2006.

Although it can be clearly seen that the ecological vulnerability of that area has increased or decreased, the changes in local ecological vulnerability can only reflect trends and cannot trace the change process of micro-units. It cannot be prepared to reflect the changing process of ecological vulnerability levels. Therefore, it is necessary to explore a reliable method to effectively monitor the conversion process of different units.
Mechanisms of ecological vulnerability transformation
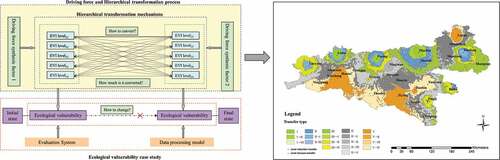
Ecological vulnerability was classified into five levels, i.e., I–V. demonstrated the area change of each EVI level from 2000 to 2006. For example, 689 and 310 square kilometers of Level I in 2000 were changed to Levels II and III, respectively, in 2006. Similarly, 3124, 2262, and 6204 square kilometers of Level V in 2000 were changed to Levels II, III, and IV, respectively, in 2006. Since the levels of ecological vulnerability from I to V indicated an increase in the degree of ecological vulnerability, the greater the level of ecological vulnerability was transferred to, the greater the area of degraded environmental vulnerability was. On the contrary, the transfer to a lower level of vulnerability meant an increase in the areas of improved environmental vulnerability. Overall, it could be seen that ecological vulnerability levels transformed from heavier to lighter vulnerability levels or from V toward I, indicating improvement in ecological stability (Hou et al. Citation2018).
Table 4. Matrix of ecological vulnerability transformation from 2000 to 2006.
The EVI-level transformation map () clearly shows the spatial variation of the transformation process. With reference to the spatiotemporal variations of the EVI levels, appropriate measures can be taken to reduce ecological vulnerability. The greatest benefit of EVI transformation matrix is that it can be presented graphically by making use of the power of GIS. This approach, hence, provides a simple, effective way to facilitate environmental management.
Figure 6. Map of ecological vulnerability transformation in Qinling Mountain from 2000 to 2006.

Conclusion
As a result of the degree of ecosystem disturbance, system damage, and the ability of system restoration, ecological vulnerability can be used as an important means to monitor environmental changes in areas with intensive human activities or harsh natural environments. This paper deduces the theoretical research basis of ecological vulnerability from the literature review, and puts forward a trend that should be paid attention to in the future research. We conclude that most of the studies on ecological vulnerability assessment still take traditional approaches, such as extracting data from statistical yearbooks and station observations, ignoring the spatial attributes of natural disaster and socio-economic indicators. When taking administrative regions as evaluation units, it is difficult to represent the spatial distribution pattern of ecological vulnerability. In contrast, mathematical methods can be combined with geospatial technologies, such as RS and GIS to extract the values of natural disaster indicators and subsequently building an index evaluation framework that can represent the characteristics of regional ecological vulnerability.
The new perspective proposed is to harness the power of the GIS and RS technologies for determining the impacts of regulating factors on ecological vulnerability, reveal the spatiotemporal features of ecological vulnerability evolution, and identify the mechanisms of vulnerability transformation. Regulating factor identification and mechanism study can provide a new perspective for promoting sustainable development of ecological environment in different regions of the world.
Highlights
This review summarizes the current status of ecological vulnerability research
It proposes quantitative identification of factors driving vulnerability changes
It proposes to explore the mechanisms of ecological vulnerability transformation
It provides a feasible method to promote sustainable development of the environment
Acknowledgments
All authors contributed equally to the preparation of this manuscript. We would like to thank Dr Xiangnan Ni at Department of Earth & Environment, Boston University for the constructive comments on this manuscript.
Disclosure statement
No potential conflict of interest was reported by the author(s).
Additional information
Funding
References
- Abbasov, R. K., and V. U. Smakhtin. 2012. “Indexing the Environmental Vulnerability of Mountain Streams in Azerbaijan.” Mountain Research and Development 32 (1): 73–15. doi:10.1659/MRD-JOURNAL-D-11-00012.1.
- Abson, D. J., A. J. Dougill, and L. C. Stringer. 2012. “Spatial Mapping of Socio-Ecological Vulnerability to Environmental Change in Southern Africa.” In Sustainability Research Institute, School of Earth and Environment. Leeds, UK: The University of Leeds, 1–33.
- Bai, Y., B. Jiang, M. Wang, H. Li, J. M. Alatalo, and S. Huang. 2016. “New Ecological Redline Policy (ERP) to Secure Ecosystem Services in China.” Land Use Policy 55: 348–351. doi:10.1016/j.landusepol.2015.09.002.
- Bai, J., J. Li, A. Bao, and C. Chang. 2021. “Spatial-Temporal Variations of Ecological Vulnerability in the Tarim River Basin, Northwest China.” Journal of Arid Land 13 (8): 814–834. doi:10.1007/s40333-021-0079-0.
- Begon, M., and C. R. Townsend. 2020. Ecology: From Individuals to Ecosystems. John Wiley & Sons.
- Beroya-Eitner, M. A. 2016. “Ecological Vulnerability Indicators.” Ecological Indicators 60: 329–334. doi:10.1016/j.ecolind.2015.07.001.
- Bo, L., and T. Lianjun. 2008. “Vulnerability and Sustainable Development Mode of Coal Cities in Northeast China.” Chinese Geographical Science 18 (2): 119–126. doi:10.1007/s11769-008-0119-0.
- Brockerhoff, E. G., L. Barbaro, B. Castagneyrol, D. I. Forrester, B. Gardiner, J. R. González-Olabarria, P. O’B. Lyver, et al. 2017. “Forest Biodiversity, Ecosystem Functioning and the Provision of Ecosystem Services.” Biodiversity and Conservation 26 (13): 3005–3035. doi:10.1007/s10531-017-1453-2.
- Cai, E., Y. Jing, Y. Liu, C. Yin, Y. Gao, and J. Wei. 2017. “Spatial-Temporal Patterns and Driving Forces of Ecological-Living-Production Land in Hubei Province, Central China.” Sustainability 10 (1). doi:10.3390/su10010066.
- Cai, L., L. Yan, J. Ni, and C. Wang. 2015. “Assessment of Ecological Vulnerability Under Oil Spill Stress.” Sustainability 7 (10): 13073–13084. doi:10.3390/su71013073.
- Cao, J. S., Y. Q. Yang, Z. Y. Deng, and Y. D. Hu. 2022. “Spatial and Temporal Evolution of Ecological Vulnerability Based on Vulnerability Scoring Diagram Model in Shennongjia, China.” Scientific Reports 12 (1): 1–16. doi:10.1038/s41598-022-09205-w.
- Carpenter, S. R., H. A. Mooney, J. Agard, D. Capistrano, R. S. DeFries, S. Díaz, T. Dietz, et al. 2009. “Science for Managing Ecosystem Services: Beyond the Millennium Ecosystem Assessment.” Proceedings of the National Academy of Sciences 106 (5): 1305–1312. doi:10.1073/pnas.0808772106.
- Chang, C. L. 2013. “Evaluation of Basin Environmental Vulnerability: The Weighted Method Compared to the Compromise Method.” International Journal of Environmental Science and Technology 10 (5): 1051–1056. doi:10.1007/s13762-013-0234-z.
- Chen, X., X. Li, A. Eladawy, T. Yu, and J. Sha. 2021. “A Multi-Dimensional Vulnerability Assessment of Pingtan Island (China) and Nile Delta (Egypt) Using Ecological Sensitivity-Resilience-Pressure (Srp) Model.” Human and Ecological Risk Assessment: An International Journal 27 (7): 1860–1882.
- Chen, S., X. Zha, Y. Bai, and L. Wang. 2019. “Evaluation of Soil Erosion Vulnerability on the Basis of Exposure, Sensitivity, and Adaptive Capacity: A Case Study in the Zhuxi Watershed, Changting, Fujian Province, Southern China.” Catena 177: 57–69. doi:10.1016/j.catena.2019.01.036.
- Choudhary, K., M. S. Boori, and A. Kupriyanov. 2018. “Spatial Modelling for Natural and Environmental Vulnerability Through Remote Sensing and GIS in Astrakhan, Russia.” The Egyptian Journal of Remote Sensing and Space Science 21 (2): 139–147. doi:10.1016/j.ejrs.2017.05.003.
- Cortinovis, C., and D. Geneletti. 2018. “Ecosystem Services in Urban Plans: What is There, and What is Still Needed for Better Decisions.” Land Use Policy 70: 298–312. doi:10.1016/j.landusepol.2017.10.017.
- Daily, G. C., and P. A. Matson. 2008. “Ecosystem Services: From Theory to Implementation.” Proceedings of the National Academy of Sciences 105 (28): 9455–9456. doi:10.1073/pnas.0804960105.
- Dawson, T. P., M. D. Rounsevell, T. Kluvánková-Oravská, V. Chobotová, and A. Stirling. 2010. “Dynamic Properties of Complex Adaptive Ecosystems: Implications for the Sustainability of Service Provision.” Biodiversity and Conservation 19 (10): 2843–2853. doi:10.1007/s10531-010-9892-z.
- De Lange, H. J., S. Sala, M. Vighi, and J. H. Faber. 2010. “Ecological Vulnerability in Risk Assessment—A Review and Perspectives.” The Science of the Total Environment 408 (18): 3871–3879. doi:10.1016/j.scitotenv.2009.11.009.
- Deng, W., X.Z. Yuan, R. Sun, and Y.W. Zhang. 2016. ”Remote Sensing-Based Ecological Vulnerability Assessment of the Northern Agro-Pastoral Interlacing Zone.” Environmental Science & Technology 39 (11): 8. (In Chinese).
- Ding, Q., X. Shan, and X. Jin. 2020. “Ecological Footprint and Vulnerability of Marine Capture Fisheries in China.” Acta Oceanologica Sinica 39 (4): 100–109. doi:10.1007/s13131-019-1468-y.
- Dossou, J. F., X. X. Li, M. Sadek, M. A. Sidi Almouctar, and E. Mostafa. 2021. “Hybrid Model for Ecological Vulnerability Assessment in Benin.” Scientific Reports 11 (1): 1–15. doi:10.1038/s41598-021-81742-2.
- Chen, F., Z. Li, S.-C. Dong, Y. Ren, J.-N. Li, et al. 2018. ”Ecological Vulnerability Assessment of Counties in the Hilly and Gully Areas of the Loess Plateau Based on Vsd Model - an Example from Lintao County, Gansu Province.” Arid Zone Resources and Environment 32 (11): 74–80. (In Chinese).
- Fan, Y., C. Fang, and Q. Zhang. 2019. “Coupling Coordinated Development Between Social Economy and Ecological Environment in Chinese Provincial Capital Cities-Assessment and Policy Implications.” Journal of Cleaner Production 229: 289–298. doi:10.1016/j.jclepro.2019.05.027.
- Fekete, A., M. Damm, and J. Birkmann. 2010. “Scales as a Challenge for Vulnerability Assessment.” Natural Hazards 55 (3): 729–747. doi:10.1007/s11069-009-9445-5.
- Fischer, A. P., and T. G. Frazier. 2018. “Social Vulnerability to Climate Change in Temperate Forest Areas: New Measures of Exposure, Sensitivity, and Adaptive Capacity.” Annals of the American Association of Geographers 108 (3): 658–678. doi:10.1080/24694452.2017.1387046.
- Fisher, B., and R. K. Turner. 2008. “Ecosystem Services: Classification for Valuation.” Biological Conservation 141 (5): 1167–1169. doi:10.1016/j.biocon.2008.02.019.
- Fu, G., B. Gade, Q. Yue, Y. Bing, H. Jing, X. Nengwen, et al. 2018. ”A Gis-Based Ecological Vulnerability Assessment of Beijing.” Journal of Ecology and Rural Environment 34 (9): 10. (In Chinese).
- Gallopín, G. C. 2006. “Linkages Between Vulnerability, Resilience, and Adaptive Capacity.” Global Environmental Change 16 (3): 293–303. doi:10.1016/j.gloenvcha.2006.02.004.
- Gao, J., C. Zou, and S. Chen. 2013. ”On the Concept, Connotation and Typology of Ecological Red Lines.” China Ecological Civilization 1: 3. (In Chinese).
- Guo, B., W. Zang, and W. Luo. 2020. “Spatial-Temporal Shifts of Ecological Vulnerability of Karst Mountain Ecosystem-Impacts of Global Change and Anthropogenic Interference.” The Science of the Total Environment 741: 140256. doi:10.1016/j.scitotenv.2020.140256.
- Hasani, M. 2018. Assessment of Social-Ecological Vulnerability to Climate Change for Identifying and Prioritizing Ecosystem-Based Adaptation Strategies: A Case Study of Baba Mountain Valleys at the Center of Bamyan Province, Afghanistan. Asian Institute of Technology, Bangkok.
- Hassan, M. S., S. Mahmud-Ul-Islam, and M. T. Rahman. 2015. “Integration of Remote Sensing and GIS to Assess Vulnerability of Environmental Degradation in North-Western Bangladesh.” Journal of Geographic Information System 7 (05): 494. doi:10.4236/jgis.2015.75040.
- He, L., J. Shen, and Y. Zhang. 2018. “Ecological Vulnerability Assessment for Ecological Conservation and Environmental Management.” Journal of Environmental Management 206: 1115–1125. doi:10.1016/j.jenvman.2017.11.059.
- Hou, K., X. Li, W. J. Jing, and J. Zhang. 2016a. “An Analysis of the Impact on Land Use and Ecological Vulnerability of the Policy of Returning Farmland to Forest in Yan’an, China.” Environmental Science and Pollution Research 23 (5): 4670–4680. doi:10.1007/s11356-015-5679-9.
- Hou, K., X. Li, J. Wang, and J. Zhang. 2016b. “Evaluating Ecological Vulnerability Using the GIS and Analytic Hierarchy Process (AHP) Method in Yan’an, China.” Polish Journal of Environmental Studies 25 (2): 599–605. doi:10.15244/pjoes/61312.
- Hou, K., X. Li, and J. Zhang. 2015. “Gis Analysis of Changes in Ecological Vulnerability Using a Spca Model in the Loess Plateau of Northern Shaanxi, China.” International Journal of Environmental Research and Public Health 12 (4): 4292–4305. doi:10.3390/ijerph120404292.
- Hou, K., W. Tao, Y. Chang, Y. Zhang, and X. Li. 2018. “A Feasible Method for the Division of Ecological Vulnerability and Its Driving Forces in Southern Shaanxi.” Journal of Cleaner Production 205: 619–628. doi:10.1016/j.jclepro.2018.09.109.
- Hou, K., W. Tao, L. Wang, and X. Li. 2020. “Study on Hierarchical Transformation Mechanisms of Regional Ecological Vulnerability and Its Applicability.” Ecological Indicators 114: 106343. doi:10.1016/j.ecolind.2020.106343.
- Huang, P. H., J. S. Tsai, and W. T. Lin. 2010. “Using Multiple-Criteria Decision-Making Techniques for Eco-Environmental Vulnerability Assessment: A Case Study on the Chi-Jia-Wan Stream Watershed, Taiwan.” Environmental Monitoring and Assessment 168 (1–4): 141–158. doi:10.1007/s10661-009-1098-z.
- Inostroza, L., M. Palme, F. de la Barrera, and J. Shaman. 2016. “A Heat Vulnerability Index: Spatial Patterns of Exposure, Sensitivity and Adaptive Capacity for Santiago de Chile.” Plos One 11 (9): e0162464. doi:10.1371/journal.pone.0162464.
- Ippolito, A., S. Sala, J. H. Faber, and M. Vighi. 2010. “Ecological Vulnerability Analysis: A River Basin Case Study.” The Science of the Total Environment 408 (18): 3880–3890. doi:10.1016/j.scitotenv.2009.10.002.
- Ippolito, A., S. Sala, J. H. Faber, and M. Vighi. 2010. “Ecological Vulnerability Analysis: A River Basin Case Study.” The Science of the Total Environment 408: 3880–3890. doi:10.1016/j.scitotenv.2009.10.002.
- Ives, A. R., and S. R. Carpenter. 2007. “Stability and Diversity of Ecosystems.” Science 317 (5834): 58–62. doi:10.1126/science.1133258.
- Jacobides, M. G., C. Cennamo, and A. Gawer. 2018. “Towards a Theory of Ecosystems.” Strategic Management Journal 39 (8): 2255–2276. doi:10.1002/smj.2904.
- Jha, S. K., A. K. Negi, J. M. Alatalo, and R. S. Negi. 2021. “Socio-Ecological Vulnerability and Resilience of Mountain Communities Residing in Capital-Constrained Environments.” Mitigation and Adaptation Strategies for Global Change 26 (8): 1–23. doi:10.1007/s11027-021-09974-1.
- Jia, J. J., J. Zhao, J. B. Wang, C. Gao, and R. Y. Chang. 2020. “Ecological Vulnerability Assessment of Shiyang River Basin Based on SRP Model.” J Arid Land Resour Environ 34 (1): 34–41.
- Jiang, Y., R. Li, Y. Shi, and L. Guo. 2021a. “Natural and Political Determinants of Ecological Vulnerability in the Qinghai–Tibet Plateau: A Case Study of Shannan, China.” ISPRS International Journal of Geo-Information 10 (5): 327. doi:10.3390/ijgi10050327.
- Jiang, Y., Y. Shi, R. Li, and L. Guo. 2021b. “A Long-Term Ecological Vulnerability Analysis of the Tibetan Region of Natural Conditions and Ecological Protection Programs.” Sustainability 13 (19): 10598. doi:10.3390/su131910598.
- Jin-Xi, Z. H. A. N. G., L. I. Hong-Ying, C. A. O. Erjia, and G. O. N. G. Jie. 2018. “Assessment of Ecological Vulnerability in Multi-Scale and Its Spatial Correlation: A Case Study of Bailongjiang Watershed in Gansu Province, China.” Yingyong Shengtai Xuebao 29 (9): 2897–2906).
- Jin, L., and Q. Xu. 2021. Research on Ecological Vulnerability Evaluation of Yunnan Province Based on SRP Model. In 2021 IEEE 4th Advanced Information Management, Communicates, Electronic and Automation Control Conference (IMCEC), Chongqing, China (Vol. 4, pp. 1022–1026). IEEE.
- Khandlhela, M., and J. May. 2006. “Poverty, Vulnerability and the Impact of Flooding in the Limpopo Province, South Africa.” Natural Hazards 39 (2): 275–287. doi:10.1007/s11069-006-0028-4.
- Kubiszewski, I., R. Costanza, S. Anderson, and P. Sutton. 2020. “The Future Value of Ecosystem Services: Global Scenarios and National Implications.” In Environmental Assessments. Edward Elgar Publishing. doi:10.4337/9781788976879.00016.
- La Notte, A., D. D’Amato, H. Mäkinen, M. L. Paracchini, C. Liquete, B. Egoh, D. Geneletti, et al. 2017. “Ecosystem Services Classification: A Systems Ecology Perspective of the Cascade Framework.” Ecological Indicators 74: 392–402. doi:10.1016/j.ecolind.2016.11.030.
- Laura, G., C. Garbisu, E. Ciprián, J. M. Becerril, M. Soto, J. Etxebarria, and L. Epelde. 2015. “Application of Ecological Risk Assessment Based on a Novel TRIAD-Tiered Approach to Contaminated Soil Surrounding a Closed Non-Sealed Landfill.” The Science of the Total Environment 514: 49–59. doi:10.1016/j.scitotenv.2015.01.103.
- Lee, Y. J. 2014. “Social Vulnerability Indicators as a Sustainable Planning Tool.” Environmental Impact Assessment Review 44: 31–42. doi:10.1016/j.eiar.2013.08.002.
- Li, X. 2020. “Dynamic Simulation of System Flow of Green Building Complex Considering Ecological Environment Vulnerability.” Fresenius Environmental Bulletin 29 (9): 7660–7667.
- Li, P., and H. Cao. 2019. “Comprehensive Assessment on the Ecological Stress of Rapid Land Urbanization per Proportion, Intensity, and Location.” Ecosystem Health and Sustainability 5 (1): 242–255. doi:10.1080/20964129.2019.1686954.
- Li, B., L. Ding, H. Xu, X. Mu, and H. Wang. 2017. “Multivariate Data Analysis Applied in Alkali-Based Pretreatment of Corn Stover.” Resources, Conservation and Recycling 122: 307–318. doi:10.1016/j.resconrec.2016.12.007.
- Li, P. X., and J. Fan. 2014. “Regional Ecological Vulnerability Assessment of the Guangxi Xijiang River Economic Belt in Southwest China with VSD Model.” Journal of Resources and Ecology 5 (2): 163–171. doi:10.5814/j.issn.1674-764X.2014.02.009.
- Li, Y. H., Q. Fan, X. Wang, J. C. Xi, S. Y. Wang, and J. Yang. 2015. ”Spatial and Temporal Variation of Ecological Vulnerability in Natural Disaster-Prone Areas Based on the Srp Model: A Case Study of Chaoyang County, Liaoning Province.” Geoscience 35 (11): 1452–1459). (In Chinese).
- Li, W., J. Fang, Z. Xing, W. Hao, and W. Zhao. 2020. “Ecological Vulnerability Evaluation of City Based on Landscape Pattern.” Bangladesh Journal of Botany 49 (3): 743–755.
- Li, X., J. Philp, R. Cremades, A. Roberts, L. He, L. Li, and Q. Yu. 2016. “Agricultural Vulnerability Over the Chinese Loess Plateau in Response to Climate Change: Exposure, Sensitivity, and Adaptive Capacity.” Ambio 45 (3): 350–360. doi:10.1007/s13280-015-0727-8.
- Li, Q., X. Shi, and Q. Wu. 2021. “Effects of Protection and Restoration on Reducing Ecological Vulnerability.” The Science of the Total Environment 761: 143180. doi:10.1016/j.scitotenv.2020.143180.
- Li, L., Z. H. Shi, W. Yin, D. Zhu, S. L. Ng, C. F. Cai, and A. L. Lei. 2009. “A Fuzzy Analytic Hierarchy Process (Fahp) Approach to Eco-Environmental Vulnerability Assessment for the Danjiangkou Reservoir Area, China.” Ecological Modelling 220 (23): 3439–3447. doi:10.1016/j.ecolmodel.2009.09.005.
- Li, X., L. Song, Z. Xie, T. Gao, T. Wang, X. Zheng …, and L. Liu. 2021. “Assessment of Ecological Vulnerability on Northern Sand Prevention Belt of China Based on the Ecological Pressure–sensibility–resilience Model.” Sustainability 13 (11): 6078. doi:10.3390/su13116078.
- Li, A., A. Wang, S. Liang, and W. Zhou. 2006. “Eco-Environmental Vulnerability Evaluation in Mountainous Region Using Remote Sensing and GIS—A Case Study in the Upper Reaches of Minjiang River, China.” Ecological Modelling 192 (1–2): 175–187. doi:10.1016/j.ecolmodel.2005.07.005.
- Lin, J., G. Hu, X. Qi, C.-Y. Xu, A. Zhang, W.-H. Chen, et al. 2018. ”Ecological Vulnerability and Its Driving Forces in the Min Delta Urban Agglomeration.” The Journal of Ecology 38 (12): 12. (In Chinese).
- Lindner, M., M. Maroschek, S. Netherer, A. Kremer, A. Barbati, J. Garcia-Gonzalo, and M. J. Lexer. 2010. “Climate Change Impacts, Adaptive Capacity, and Vulnerability of European Forest Ecosystems.” Forest Ecology and Management 259 (4): 698–709. doi:10.1016/j.foreco.2009.09.023.
- Liu, K. M., L. H. Huang, K. Y. Su, and S. J. Joung. 2021. “Vulnerability Assessment of Pelagic Sharks in the Western North Pacific by Using an Integrated Ecological Risk Assessment.” Animals 11 (8): 2161. doi:10.3390/ani11082161.
- Liu, X., Y. Wang, J. Peng, A. K. Braimoh, and H. Yin. 2013. “Assessing Vulnerability to Drought Based on Exposure, Sensitivity and Adaptive Capacity: A Case Study in Middle Inner Mongolia of China.” Chinese Geographical Science 23 (1): 13–25. doi:10.1007/s11769-012-0583-4.
- Liu, J., C. Zou, J. Gao, S. Ma, W. Wang, K. Wu, et al. 2015. ”Scoping of Ecologically Fragile Areas in China”. Biodiversity 23(6): 725–732). (In Chinese)
- Ma, X., M. de Jong, B. Sun, and X. Bao. 2020. “Nouveauté or Cliché? Assessment on Island Ecological Vulnerability to Tourism: Application to Zhoushan, China.” Ecological Indicators 113: 106247. doi:10.1016/j.ecolind.2020.106247.
- Murthy, C. S., B. Laxman, and M. S. Sai. 2015. “Geospatial Analysis of Agricultural Drought Vulnerability Using a Composite Index Based on Exposure, Sensitivity and Adaptive Capacity.” International Journal of Disaster Risk Reduction 12: 163–171. doi:10.1016/j.ijdrr.2015.01.004.
- Murthy, C. S., B. Laxman, M. S. Sai, and P. G. Diwakar. 2014. “Analyzing Agricultural Drought Vulnerability at Sub-District Level Through Exposure, Sensitivity and Adaptive Capacity Based Composite Index.” The International Archives of Photogrammetry, Remote Sensing and Spatial Information Sciences 40 (8): 65. doi:10.5194/isprsarchives-XL-8-65-2014.
- Neshat, A., B. Pradhan, and M. Dadras. 2014. “Groundwater Vulnerability Assessment Using an Improved DRASTIC Method in GIS.” Resources, Conservation and Recycling 86: 74–86. doi:10.1016/j.resconrec.2014.02.008.
- Newton, A., and J. Weichselgartner. 2014. “Hotspots of Coastal Vulnerability: A DPSIR Analysis to Find Societal Pathways and Responses.” Estuarine, Coastal and Shelf Science 140: 123–133. doi:10.1016/j.ecss.2013.10.010.
- Nguyen, A. K., Y. A. Liou, M. H. Li, and T. A. Tran. 2016. “Zoning Eco-Environmental Vulnerability for Environmental Management and Protection.” Ecological Indicators 69: 100–117. doi:10.1016/j.ecolind.2016.03.026.
- Pandey, R., and D. K. Bardsley. 2015. “Social-Ecological Vulnerability to Climate Change in the Nepali Himalaya.” Applied Geography 64: 74–86. doi:10.1016/j.apgeog.2015.09.008.
- Parrott, L. 2010. “Measuring Ecological Complexity.” Ecological Indicators 10 (6): 1069–1076. doi:10.1016/j.ecolind.2010.03.014.
- Qiao, Z., X. Yang, J. Liu, and X. Xu. 2013. Ecological Vulnerability Assessment Integrating the Spatial Analysis Technology with Algorithms: A Case of the Wood-Grass Ecotone of Northeast China. Abstract and Applied Analysis 207987.
- Quan, Z. J., Y. Li, J. S. Li, Y. Han, N. W. Xiao, and M. D. Fu. 2013. “Ecological Vulnerability of Coal Mining Area: A Case Study of Shengli Coalfield in Xilinguole of Inner Mongolia, China.” The Journal of Applied Ecology 24: 1729–1738.
- Rao, K., and Y. Zisheng. 2020. “Evaluation of Mountain Land Ecological Security Based on DPSIR Model and Entropy Weight Method.” Asian Agricultural Research 12 (2).
- Rapicetta, S., and V. Zanon. 2009. “GIS-Based Method for the Environmental Vulnerability Assessment to Volcanic Ashfall at Etna Volcano.” GeoInformatica 13 (3): 267–276. doi:10.1007/s10707-008-0061-4.
- Rau, A.-L., H. von Wehrden, and D. J. Abson. 2018. “Temporal Dynamics of Ecosystem Services.” Ecological Economics 151: 122–130. doi:10.1016/j.ecolecon.2018.05.009.
- Sahoo, S., A. Dhar, and A. Kar. 2016. “Environmental Vulnerability Assessment Using Grey Analytic Hierarchy Process Based Model.” Environmental Impact Assessment Review 56: 145–154. doi:10.1016/j.eiar.2015.10.002.
- Shang, H., Q. Han, and Y. Li. 2017. “Ecological Vulnerability Evaluation in West China: Evaluate Vulnerability and Its Synergy Degree with Government Performance.” Eurasia Journal of Mathematics, Science and Technology Education 13 (12): 7743–7754.
- Siyuan, W., L. Jingshi, and Y. Cunjian. 2008. “Eco-Environmental Vulnerability Evaluation in the Yellow River Basin, China.” Pedosphere 18 (2): 171–182. doi:10.1016/S1002-0160(08)60005-3.
- Skondras, N. A., C. A. Karavitis, I. I. Gkotsis, P. J. B. Scott, U. L. Kaly, and S. G. Alexandris. 2011. “Application and Assessment of the Environmental Vulnerability Index in Greece.” Ecological Indicators 11 (6): 1699–1706. doi:10.1016/j.ecolind.2011.04.010.
- Smit, B., and J. Wandel. 2006. “Adaptation, Adaptive Capacity and Vulnerability.” Global Environmental Change 16 (3): 282–292. doi:10.1016/j.gloenvcha.2006.03.008.
- Sun, B., X. Ma, X. Bao, and M. D. Jong. 2020. “Mapping Island Ecological Vulnerability to Urbanization: A Study of Twelve Island Counties/districts, China.” Journal of Coastal Research 95 (SI): 83–87. doi:10.2112/SI95-016.1.
- Svarstad, H., L. K. Petersen, D. Rothman, H. Siepel, and F. Wätzold. 2008. “Discursive Biases of the Environmental Research Framework DPSIR.” Land Use Policy 25 (1): 116–125. doi:10.1016/j.landusepol.2007.03.005.
- Swami, D., and D. Parthasarathy. 2021. “Dynamics of Exposure, Sensitivity, Adaptive Capacity and Agricultural Vulnerability at District Scale for Maharashtra, India.” Ecological Indicators 121: 107206. doi:10.1016/j.ecolind.2020.107206.
- Tran, L. T., C. G. Knight, R. V. O’Neill, E. R. Smith, K. H. Riitters, and J. Wickham. 2002. “Fuzzy Decision Analysis for Integrated Environmental Vulnerability Assessment of the Mid-Atlantic Region.” Environmental Management 29 (6): 845–859. doi:10.1007/s00267-001-2587-1.
- Tran, L. T., R. V. O’Neill, and E. R. Smith. 2012. “A Watershed-Based Method for Environmental Vulnerability Assessment with a Case Study of the Mid-Atlantic Region.” Environmental Impact Assessment Review 34: 58–64. doi:10.1016/j.eiar.2011.11.005.
- Turner, B. L., R. E. Kasperson, P. A. Matson, J. J. McCarthy, R. W. Corell, L. Christensen …, and C. Polsky. 2003. “A Framework for Vulnerability Analysis in Sustainability Science.” Proceedings of the National Academy of Sciences 100 (14): 8074–8079. doi:10.1073/pnas.1231335100.
- Vihervaara, P., M. Rönkä, and M. Walls. 2010. “Trends in Ecosystem Service Research: Early Steps and Current Drivers.” Ambio 39 (4): 314–324. doi:10.1007/s13280-010-0048-x.
- Villa, F., and H. Mcleod. 2002. “Environmental Vulnerability Indicators for Environmental Planning and Decision-Making: Guidelines and Applications.” Environmental Management 29 (3): 335–348. doi:10.1007/s00267-001-0030-2.
- Wallace, K. J. 2007. “Classification of Ecosystem Services: Problems and Solutions.” Biological Conservation 139 (3–4): 235–246. doi:10.1016/j.biocon.2007.07.015.
- Walther, G. R. 2010. “Community and Ecosystem Responses to Recent Climate Change.” Philosophical Transactions of the Royal Society B: Biological Sciences 365 (1549): 2019–2024. doi:10.1098/rstb.2010.0021.
- Wang, S. Y., J. S. Liu, and C. J. Yang. 2008. “Eco-Environmental Vulnerability Evaluation in the Yellow River Basin, China.” Pedosphere 18 (2): 171–182. doi:10.1016/S1002-0160(08)60005-3.
- Wang, X. D., X. H. Zhong, S. Z. Liu, J. G. Liu, Z. Y. Wang, and M. H. Li. 2008. “Regional Assessment of Environmental Vulnerability in the Tibetan Plateau: Development and Application of a New Method.” Journal of Arid Environments 72 (10): 1929–1939. doi:10.1016/j.jaridenv.2008.06.005.
- Weis, S. W. M., V. N. Agostini, L. M. Roth, B. Gilmer, S. R. Schill, J. E. Knowles, and R. Blyther. 2016. “Assessing Vulnerability: An Integrated Approach for Mapping Adaptive Capacity, Sensitivity, and Exposure.” Climatic Change 136 (3–4): 615–629. doi:10.1007/s10584-016-1642-0.
- Weißhuhn, P., F. Müller, and H. Wiggering. 2018. “Ecosystem Vulnerability Review: Proposal of an Interdisciplinary Ecosystem Assessment Approach.” Environmental Management 61 (6): 904–915. doi:10.1007/s00267-018-1023-8.
- Williams, L. R. R., and L. A. Kapustka. 2000. “Ecosystem Vulnerability: A Complex Interface with Technical Components.” Environmental Toxicology and Chemistry 19: 1055–1058.
- Wu, C., G. Liu, C. Huang, Q. Liu, and X. Guan. 2018. “Ecological Vulnerability Assessment Based on Fuzzy Analytical Method and Analytic Hierarchy Process in Yellow River Delta.” International Journal of Environmental Research and Public Health 15 (5): 855. doi:10.3390/ijerph15050855.
- Wu, H., H. Qian, J. Chen, and C. Huo. 2017. “Assessment of Agricultural Drought Vulnerability in the Guanzhong Plain, China.” Water Resources Management 31 (5): 1557–1574. doi:10.1007/s11269-017-1594-9.
- Wu, J. S., M. L. Zong, and J. Peng. 2012. “Assessment of Mining Area’s Ecological Vulnerability Based on Landscape Pattern: A Case Study of Liaoyuan, Jilin Province of Northeast China.” Chinese Journal of Ecology 31: 3213–3220.
- Xia, M., K. Jia, W. Zhao, S. Liu, X. Wei, and B. Wang. 2021. “Spatio-Temporal Changes of Ecological Vulnerability Across the Qinghai-Tibetan Plateau.” Ecological Indicators 123: 107274. doi:10.1016/j.ecolind.2020.107274.
- Xue, L., J. Wang, L. Zhang, G. Wei, and B. Zhu. 2019. “Spatiotemporal Analysis of Ecological Vulnerability and Management in the Tarim River Basin, China.” The Science of the Total Environment 649: 876–888. doi:10.1016/j.scitotenv.2018.08.321.
- Yao, K., L. Yu, G. H. Liu, and H. H. Liu. 2017. “Evaluation of Ecological Vulnerability in Sichuan Province Based on SRP Model.” Comput Tech Geophys Geochem Explor 39 (2): 291–295.
- Yu, X., Y. Li, M. Xi, F. Kong, M. Pang, and Z. Yu. 2019a. “Ecological Vulnerability Analysis of Beidagang National Park, China.” Frontiers of Earth Science 13 (2): 385–397. doi:10.1007/s11707-018-0726-8.
- Yu, Z. L., X. J. Yang, and Y. Z. Shi. 2012. “Evaluation of Urban Vulnerability to Drought in Guanzhong Area.” Resources Science 34: 581–588.
- Yue, S., Y. Shen, and J. Yuan. 2019b. “Sustainable Total Factor Productivity Growth for 55 States: An Application of the New Malmquist Index Considering Ecological Footprint and Human Development Index.” Resources, Conservation and Recycling 146: 475–483. doi:10.1016/j.resconrec.2019.03.035.
- Zabeo, A., L. Pizzol, P. Agostini, A. Critto, S. Giove, and A. Marcomini. 2011. “Regional Risk Assessment for Contaminated Sites Part 1: Vulnerability Assessment by Multicriteria Decision Analysis.” Environment International 37 (8): 1295–1306. doi:10.1016/j.envint.2011.05.005.
- Zhang, J. X., H. Y. Li, E. J. Cao, and J. Kung. 2018. ”Multi-Scale Watershed Ecological Vulnerability Assessment and Its Spatial Correlation: The Example of the Bailong River Watershed in Gansu.” The Journal of Applied Ecology 29 (9): 10, (In Chinese).
- Zhang, X., K. Liu, S. Wang, T. Wu, X. Li, J. Wang …, and Y. Ji. 2022. “Spatiotemporal Evolution of Ecological Vulnerability in the Yellow River Basin Under Ecological Restoration Initiatives.” Ecological Indicators 135: 108586. doi:10.1016/j.ecolind.2022.108586.
- Zhang, F., X. Liu, J. Zhang, R. Wu, Q. Ma, and Y. Chen. 2017a. “Ecological Vulnerability Assessment Based on Multi-Sources Data and SD Model in Yinma River Basin, China.” Ecological Modelling 349: 41–50. doi:10.1016/j.ecolmodel.2017.01.016.
- Zhang, X., Z. Wang, and J. Lin. 2015. “Gis Based Measurement and Regulatory Zoning of Urban Ecological Vulnerability.” Sustainability 7 (8): 9924–9942. doi:10.3390/su7089924.
- Zhang, T.Z., W. Wang, C.H.F. Liu, and Q.J. Zhao. 2016. ”Comprehensive Land Remediation Zoning in Typical Areas of Ecologically Fragile Areas in Northwestern China: The Case of Lanzhou City, Gansu Province.” Soil and Water Conservation Bulletin 36 (3): 8. (In Chinese).
- Zhang, H., J. Wu, Y. Gao, and Z. Chen. 2017b. “Spatial Assessment of Ecological Vulnerability in Fuzhou District in China Using Remote Sensing and GIS.” Nature Environment and Pollution Technology 16: 1303–1312.
- Zhang, X. L., W. B. Yu, H. S. Cai, and X. M. Guo. 2018. ”A Review of Research on Regional Ecological Vulnerability Assessment Methods.” The Journal of Ecology, 36 (16: 5970–5981. (In Chinese).
- Zhao, J., G. Ji, Y. Tian, Y. Chen, and Z. Wang. 2018. “Environmental Vulnerability Assessment for Mainland China Based on Entropy Method.” Ecological Indicators 91: 410–422. doi:10.1016/j.ecolind.2018.04.016.
- Zhengwei, Y. 2008. ”Driving Force System and Evaluation of Ecological Vulnerability of Hongze Lake Wetland.” Soil and Water Conservation Research 15 (6): 5. (In Chinese).
- Zou, T., Y. Chang, P. Chen, and J. Liu. 2021. “Spatial-Temporal Variations of Ecological Vulnerability in Jilin Province (China), 2000 to 2018.” Ecological Indicators 133: 108429. doi:10.1016/j.ecolind.2021.108429.
- Zou, T., and K. Yoshino. 2017. “Environmental Vulnerability Evaluation Using a Spatial Principal Components Approach in the Daxing’anling Region, China.” Ecological Indicators 78: 405–415.