
 ?Mathematical formulae have been encoded as MathML and are displayed in this HTML version using MathJax in order to improve their display. Uncheck the box to turn MathJax off. This feature requires Javascript. Click on a formula to zoom.
ABSTRACT
Extremely hot environments can trigger serious health problems. To evaluate the effects of microclimate on thermal comfort, we proposed and validated a modified thermal humidity index (MTHI) that combined air temperature and relative humidity with land surface temperature (LST). MTHI was more sensitive to microclimate changes than the general thermal humidity index that includes only T and RH, and thus the thermal comfort could be better indicated. In an urban riparian buffer study, we estimated the temporal dynamics and spatial distribution of MTHI values for 47 vegetation patches and explored how structural characteristics of patches affect the thermal comfort. The results showed that planting could significantly reduce LST and MTHI. Vegetation patches with complex vertical structures had considerably higher thermal comfort than those with simple structures. Decreasing nearest distance to river or increasing plant abundance could reduce the thermal discomfort. There were significant differences in the structure characteristics between the patches with MTHI <70 and those with MTHI >70, implying the critical thresholds of variations in thermal comfort with patch structure. Given that people always feel uncomfortable during the daytime in July, optimizing the patch structure is essential to improve the microclimate regulation services of an urban landscape.
Introduction
Extreme weather events are becoming more frequent with increasing urbanization across the world (Tomlinson et al. Citation2011). Growing evidence suggests that the intensity, frequency, and duration of heatwaves are likely to increase in the future (Meehl and Tebaldi Citation2004). High temperatures may cause serious health problems such as heatstroke, heat exhaustion, and even death (Kovats and Hajat Citation2008; Trancoso et al. Citation2020). In terms of urban ecosystem services and human well-being, human thermal comfort (HTC) in urban environments must be measured, and the approaches to alleviating the thermal effect on humans must be explored (Mahmoud Citation2011; Nasir, Ahmad, and Ahmed Citation2012; Stabler, Martin, and Brazel Citation2005).
Heat stress index based on thermal stress models is one of the most commonly methods to quantify outdoor thermal comfort (Metje, Sterling, and Baker Citation2008; Nikolopoulou and Lykoudis Citation2006). Most heat stress indices combine air temperature (T) with relative humidity (RH), such as the discomfort index (Thom Citation1959), thermal humidity index (THI) based on the discomfort index (Unger Citation1999), and tropical summer index (Sharma and Ali Citation1986). THI evaluates the level of heat stress in warm weather based on the principles of human biometeorology (Tahbaz Citation2011). Given that THI can effectively indicate the heat sensitivity of human body to T and RH, it has been applied by National Weather Service of the United States to measure HTC, and also in many studies (Balogun and Daramola Citation2019; Eludoyin and Adelekan Citation2013; Feng et al. Citation2020; Xu, Hu, and Guan Citation2017). The wet-bulb globe temperature (WBGT), obtained mainly using the natural wet-bulb temperature, black globe temperature, and dry-bulb temperature (Budd Citation2008; Yaglou and Minard Citation1957), is also immensely popular (Budd Citation2008; Moran et al. Citation2001). WBGT considers the effect of radiant heat (estimated from black globe temperature) or wind, besides T and RH. However, reaching a stable state while measuring black globe temperature requires a long time, which limits the application of WBGT in many urgent or transient situations (Moran et al. Citation2001). Asides from heat stress indices, some indices based on human energy balance are also widely used to measure HTC, including physiologically equivalent temperature (Mayer and Höppe Citation1987), standard effective temperature (Gagge, Stolwijk, and Nishi Citation1972), and universal thermal climate index (Jendritzky, de Dear, and Havenith Citation2012). These indices have their advantages in associating HTC with clothing thermal resistance characteristics and human metabolic rate when engaging in activities. However, they have the same limitations as WBGT when measuring black globe temperature. In contrast, THI is obtained mainly from two easily and quickly measured meteorological variables, T and RH; thus, THI is more widely applied than other indices under urgent or transient situations. However, THI ignores the effect of radiant heat, which could underestimate or overestimate the environmental thermal sensation (Budd Citation2008). Therefore, for HTC, it is critical to develop an index with some of the combined advantages of both THI and the other aforementioned indices by creating a variable that can be easily measured and is closely correlated with solar radiation.
Land surface temperature (LST) directly affects the thermal comfort by absorption, reflection, and scattering of solar radiation from the underlying surface. Because LST is more affected by solar radiation than T, and its reaction to solar radiation changes is faster than that of T, LST has special advantages for the development of a new THI (Moran and Epstein Citation2006; Weng Citation2003). Furthermore, LST can be easily and quickly measured (e.g., using a handheld device) or obtained for a large area (e.g., using remote sensing data) (Feng et al. Citation2020). Huang et al. (Citation2013) proposed categories of HTC based on summer urban LST and corresponding human physiological reactions. However, few thermal humidity indices exist that combine T and RH with LST. In our present study, THI was modified by integrating T and RH with LST to develop a new index, modified thermal humidity index (MTHI).
In a heterogeneous landscape with various land covers and vegetation structures, there is obvious spatial variation in thermal comfort. The variation can be explained well only if the relationships between microclimate and composition and spatial association of vegetation covers are understood. A large amount of studies concluded that increasing the planting area, density, or coverage can effectively alleviate the thermal effect on environment and humans (Wang et al. Citation2016; Shao et al. Citation2017; Zhao, Sailor, and Wentz Citation2018). Other studies found that the optimized vegetation structure can also provide a cooling environment (Colyvan, Justus, and Regan Citation2010; Dobbs, Escobedo, and Zipperer Citation2011). These studies considered the vegetation structure characteristics at distinct scales. For example, some studies have discussed the effects of characteristics of individual plants (such as vertical structure, canopy width or density, and canopy geometry) on T, RH, or incoming solar radiation under plant canopy (Amani-Beni et al. Citation2018; Dobbs, Escobedo, and Zipperer Citation2011; Kong et al. Citation2016; Metje, Sterling, and Baker Citation2008; Nichol Citation1996; Nikolopoulou and Lykoudis Citation2006; Zhang and Zhao Citation2007). Some studies focused on patches and analyzed the impacts of vegetation patch area, perimeter, and shape on T and LST within the patches (Eskelson et al. Citation2011; Klok et al. Citation2012; Zhang et al. Citation2009). Some studies focused on landscapes and discussed the impacts of the location and plant abundance or density of single vegetation patches and the spacing and fragmentation or connectivity among different patches on the microclimate within the patches (Rambo and North Citation2008; Tomlinson et al. Citation2011; Zhao, Sailor, and Wentz Citation2018). However, few studies have quantified metrics associated with the composition of adjacent areas of a central vegetation patch and the spatial association between the central patch and its surrounding patches (Zhang et al. Citation2009). Understanding the relationships between microclimate and these metrics is likely to have some new findings to explain the variation in thermal comfort.
Our study area is located in Lianshihu park, a riparian landscape in Beijing, China. Many trees, shrubs, and herbs are planted within the riparian buffer, forming an orderly greenbelt from the slope-zone to riverbank (Zhu and Deng Citation2012). Hardened roads go through the riparian buffer. The park became a popular location for recreation and cultural activities for urban citizens after it was built in 2011. However, not all times and all sites within the entire riparian buffer are suitable for leisure or activity. Do people feel thermal comfort or discomfort at some times and locations? The structural characteristics of patches such as underlying surface type, vertical vegetation structure, plant abundance, and spatial association among patches may vary greatly over the entire buffer. How do these structural characteristics affect the microclimate and thermal comfort within a patch? To address these questions, we developed six indices to quantify the composition of a vegetation patch and its adjacent patches and the spatial association between the vegetation patch and its surrounding heterogeneous patches such as road and river. We discussed how the composition and spatial association of patches affect thermal comfort based on the estimated temporal dynamics and spatial distribution of MTHI values. The study results will help in proposing economical and effective approaches to improving the thermal comfort of an urban landscape.
Materials and methods
Study area
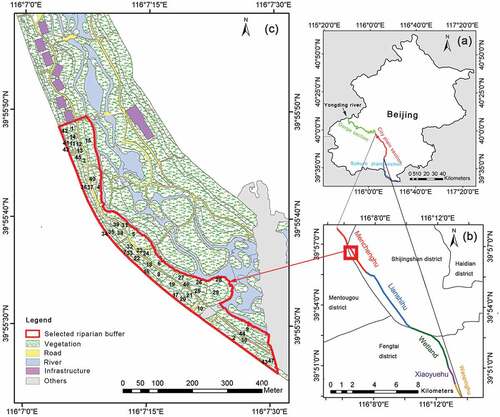
Our study area is located at the Menchenghu city plain section of the Yongding river in Mentougou district, Beijing (116°6ˊ54˝E–116°9ˊ52˝E, 39°56ˊ9˝N–39°53ˊ14˝N). This river flows through Beijing from the Shanxi province to the Bohai sea. At 170 km, it is the longest river in Beijing and is divided into the gorge section, city plain section, and suburb plain section according to differences in river terrains and flood controls () (Jiang et al. Citation2014). The Menchenghu subsection, with a length of 4.8 km, is in the northern part of Lianshihu park (including Menchenghu and Lianshihu subsections) ().
Figure 1. Location of the selected riparian buffer and its corresponding riverway in the Menchenghu city plain section of the Yongding river in Mentougou district of Beijing: (a) Beijing; (b) city plain section of the Yongding river in Beijing; and (c) selected riparian buffer and its corresponding riverway.
The Mentougou district has a seasonal temperate and semi-humid continental monsoonal climate. The mean annual precipitation is 550–660 mm, roughly 85% of which occurs in the summer (June – September). The mean annual average air temperature is 11°C, and the mean annual sunshine hours is 2470 h. In July, the average air temperature is 28°C, and the average precipitation is 120 mm (Jiang et al. Citation2014).
Since the middle of the 20th century, the Yongding river ecosystems have experienced severe degradation, with some river sections even becoming gradually dry following rapid urbanization. The ecological rehabilitation project, which aimed at restoring the river ecosystems, was officially launched by the government in 2009. The project for the riverbed, riverbank, and buffer in the city plain section was completed in September 2011 (Zhu and Deng Citation2012). Many trees, shrubs, and herbs were grown to form single- or multi-layer green belts. Additionally, infrastructure for activities such as sports grounds, leisure squares, and fishing and water playing platforms was constructed.
Identification of riparian patches and selection of study subarea
A four-band WorldView-2 image at a 0.5-m pixel resolution for 18 September 2013, was manually interpreted to create a digital land cover map of the riparian buffer based on prior knowledge. From the land cover map, 551 riparian buffer patches with homogeneous land cover were identified, including 488 vegetation patches (accounting for 84.98% of the buffer area). The information, including spatial location, land use type, and vegetation type of each patch, was tested and modified through comparison with our field survey data.
We selected a subarea in the northwestern Menchenghu subsection with a length of approximately 1.0 km and total area of 6.0 ha. The subarea has typical vegetation structural characteristics of the riparian buffer. The subarea includes 47 vegetation patches with the mean patch size of 0.13 ± 0.11 ha (). It covers five main vertical vegetation structure types such as tree+shrub (3 patches), tree+herb (8 patches), tree (17 patches), shrub (14 patches), and herb (5 patches). Only when herb coverage under trees within a patch was higher than 20%, the patch was classified as tree+herb type; otherwise, it was classified as tree type.
Modified thermal humidity index
Unger (Citation1999) modified the original discomfort index proposed by Thom (Citation1959) as THI. THI can be calculated based on the average of dry-bulb and wet-bulb temperatures by using a simple linear relationship.
The thermal category thresholds of THI (TCTTHI) proposed by Mather (Citation1974) and those of LST (TCTLST) proposed by Huang et al. (Citation2013) are given in . We found that there was a significant linear relationship (R2 = 0.97) between TCTTHI and TCTLST, given by
Table 1. Thermal category thresholds of thermal humidity index (THI), land surface temperature (LST), and modified thermal humidity index (MTHI).
We introduced a function of LST, i.e., LST′,
Then, MTHI, a new thermal humidity index, was developed. MTHI is correlated with the interaction between THI and LST′.
The parameter 0.10 restricts the range of MTHI values between 0 and 100. EquationEquation (5)(5)
(5) involves all the different combinations of T, RH, and LST (T, RH, LST, T×RH, LST×T, LST×RH, and LST×T×RH) to derive MTHI. Given that the thermal category thresholds of LST′ is closely consistent with those of THI according to EquationEquations (2)
(2)
(2) and (Equation3
(3)
(3) ), the theoretical thresholds of MTHI can be determinately obtained from the relationship of MTHI with THI and LST′ (, ).
Figure 2. Modified thermal humidity index (MTHI) ranges and the corresponding human thermal comfort levels.
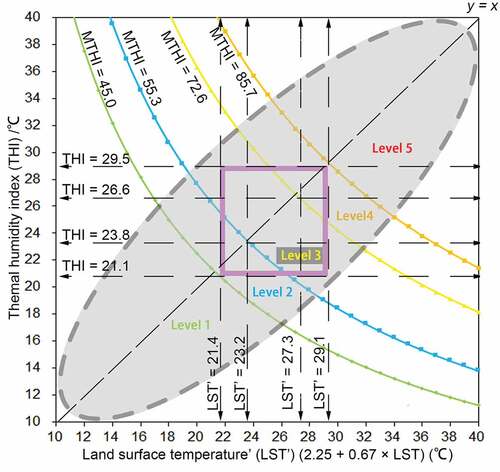
When THI is a fixed value, MTHI linearly increases with LST′; when LST′ is a fixed value, MTHI linearly increases with THI. When MTHI is a fixed value, there is a negative power law between THI and LST′, i.e., the power law (y=x−1), a universal rule in biophysics, is a basic relationship when producing MTHI.
When MTHI is not a fixed value, there is a significant positive correlation between THI and LST′, and THI and LST′ always change around the diagonal y = x (according to EquationEquations (2)(2)
(2) and (Equation3
(3)
(3) )). Thus, the HTC levels corresponding to MTHI are restricted within an elliptical zone (the gray zone in ). If they are beyond the range, the relationships among MTHI, THI, and LST′ cannot be correctly expressed; thus, the identified HTC level is not reasonable. Given that the actual microclimate values vary within a wide range, the range of the potential elliptical zone should be larger than the theoretical zone determined by TCTTHI and TCTLST′, which is the minimum one (the purple square zone in ). As the boundary of the potential elliptical zone is not explicit, we demarcated it with a dashed line ().
The defined MTHI can indicate physiological reaction of human body with microclimate change. The reaction can be classified as five types according to MTHI values, which can correspond to the five HTC levels, comfortable, slightly hot, hot, very hot, and torrid, from level 1 to level 5, respectively ( and ). In details, only if MTHI is below 45, the surroundings environment is comfortable and suitable for human activities. With the increasing MTHI values, people gradually feel uncomfortable. When MTHI reaches 55.3, people may suffer from the disorders such as heat exhaustion or heatstroke, and morbidity and severity of disorders greatly increase when MTHI reaches 85.7.
Measurement of microclimate indices
Three consecutive days were selected in the early or middle days of each month from July to September, 2014. All the selected days were sunny with breeze (wind speed ranging from 1.5 to 2.4 m/s) to ensure consistency of weather conditions. T, RH, and LST values within each vegetation patch were measured from 8:00 to 19:00 every day. Measurement sites were evenly distributed throughout the patch. T and RH values were automatically recorded once after every 10 s using a portable weather instrument, the Kestrel NK 4000 (the United States). The measuring resolution of T was 0.1 ℃ and the precisions of T and RH were at ± 1 ℃ and ±3%, respectively. LST values were manually measured by a Laser Thermometer MI-210 with a precision of ±0.5 ℃. The three indices were measured once after every hour for each vegetation patch, and each measurement lasted 3 min. We obtained 18 automatically recorded T and RH values and six manually recorded LST values per hour for each patch.
Vegetation patch structure indices
We observed two types of patches. All the 47 vegetation patches of interest (hereafter referred to as central patches) were of the first type, and the adjacent patches within a 10 m-width buffer of each central patch (hereafter referred to as adjacent patches) that included vegetation or road patches were of the other type. We generated three types of patch structure indices that might be correlated with temperature and humidity within a central vegetation patch. The first type of index quantified the vegetation composition of a central patch, including vegetation coverage (VC) and tree canopy density (TCD). The second type of index quantified the vegetation composition of adjacent patches, including adjacent vegetation coverage (AVC) and adjacent tree canopy density (ATCD). The third type of index quantified the spatial association between a central patch and its surroundings, including nearest distance to river (NDR) and percent adjacent road (PAR). NDR denoted the distance between a central patch and its surrounding non-vegetation patches, and PAR denoted the area of non-vegetation patches within the 10 m-width buffer of a central patch.
Several vegetation parameters used to calculate these indices were measured in July when the plant growth was at its peak. We randomly selected three sites in each vegetation patch to estimate VC (herbs and shrubs) and then calculate the mean VC. We randomly selected three average trees in each patch with trees to measure their canopy radius, which is the distance from the trunk to the edge of canopy; and then, we calculated the mean canopy radius. Plant spacing was measured, from which tree density was calculated via the point-centered quarter method (Dahdouh-Guebas and Koedam Citation2006); and then, the total number of trees in a patch was estimated.
where m is the total number of trees in a central patch; C is the mean canopy radius (m); a is the area of the central patch (m2).
where n is the total number of adjacent vegetation patches j within the buffer of a central patch; VCj is the vegetation (herbs and shrubs) coverage in the patch j (%); aj is the area of vegetation patch j (m2); Ab is the area of the buffer including vegetation and non-vegetation patches (m2).
where mj is the total number of trees in the adjacent vegetation patch j within the buffer of a central patch; Cj is the mean canopy radius in the vegetation patch j (m).
where k is the total number of adjacent road patches j within the buffer of a central patch; rj is the area of road patch j (m2).
The mean VC and TCD of the 47 vegetation patches were 28.2% ± 22.9% (1.32%–80.00%) and 0.32 ± 0.41 (0–1.57), respectively. The mean AVC and ATCD were 26.1% ± 12.2% (11.78%–58.99%) and 0.32 ± 0.24 (0–0.96), respectively. The mean NDR was 43.7 ± 23.5 m (2.6–108.0 m); the 21 patches were close to the river (NDR <39.0 m), and two were far away from the river (NDR >78.0 m). The mean PAR was 24.6% ± 15.0% (0%–72.28%); 16 patches were close to the road (2.2–9.4 m) and nine were far away from the road (30.1–76.6 m).
Statistical analysis
We calculated the hourly averages of T, RH, and LST values measured in July, August, and September and estimated THI and MTHI values using EquationEquations (1)(1)
(1) and (Equation5
(5)
(5) ), respectively. The differences in T, RH, LST, THI, and MTHI between the central vegetation patches and their adjacent roads were analyzed using the paired-samples t-test method.
For each vertical vegetation structure type, the hourly average of MTHI for July was calculated. The effect of complexity of vertical vegetation structure on MTHI was analyzed using the paired-samples t-test method.
To explore the ways in which the patch indices affected MTHI through directly acting on microclimate indices, we set the values of microclimate indices (T, RH, and LST) measured for the 47 vegetation patches in July as group Y and the values of patch indices (VC, TCD, AVC, ATCD, NDR, and PAR) as group X. Detrended correspondence analysis was conducted on the values of groups X and Y. According to the values on the first axis, redundancy analysis was conducted to explore the effect of group X on group Y.
Validation of modified thermal humidity index
The estimated MTHI values were validated by comparing them with the measurements and other estimations that might directly or indirectly indicate HTC ().
Figure 3. Methods to validate the estimated modified thermal humidity index (MTHI). Significance: ***p < 0.001.
We developed other models to estimate HTC values based on T, RH, LST, and wind speed (WS). To develop these models, the following three key questions need be addressed. The four microclimate indices at different times must be measured first using the same method as that used in the present study. Then, the weights of single microclimate indices or the weights of their interactions in influencing HTC needed to be estimated. Last, the estimated HTC values needed to be validated.
Survey of preference for microclimate and perception for thermal comfort
For the above second question, the estimations of these weights are more correlated with human subjective sentiments, despite being based on objective microclimate indices. Given that these weights cannot be directly measured, we conducted some questionnaire-based on-site surveys to understand human preferences for the microclimate (preference surveys), from which the weights were estimated. Four questions were asked to rate the extent to which a respondent agreed with the influence of the four microclimate indices. For example, “Influence of land surface temperature on thermal comfort.” A 5-point Likert scale method was used, offering five responses, “very much,” “quite a bit,” “somewhat,” “a little,” and “not at all,” which corresponded to scores of 5, 4, 3, 2, and 1, respectively.
For the aforementioned third question, regarding validation, because the response variable (comprehensive HTC indicator) could not be measured directly, we obtained the respondents’ perceptual judgments for the thermal comfort within the vegetation patches (perception surveys) where the respondents were during the survey. A scale of numbers (0–10) was set to rate the perception with a greater rating indicating more comfortable microclimate.
For the preference surveys, we sent out 600 questionnaires to the visitors over Lianshihu park on sunny days with a breeze in July and August. The participants were randomly selected, including 63.6% males and 36.4% females, with the ages mainly of 15–30, 30–45, and 45–60 years old accounting for 29.0%, 39.6%, and 18.4%, respectively. The answers regarding microclimate preferences were general (not specific to certain places).
For the perception surveys, 102 vegetation (including herb, shrub, and tree+herb) patches located in open fields or along road sides and relatively evenly distributed over the entire park were selected. The respondents’ answers to thermal comfort perceptions were specific to these patches, in which the values of T, RH, LST, and WS were measured at the same time.
Finally, we gathered 501 effective and complete questionnaires. The 408 responses from the preference surveys were used to derive the weights in the developed HTC models, and the 93 responses from the perception survey for the 93 vegetation patches were used to validate the developed HTC models and MTHI. The surveys for deriving weights and for validation were independent of each other.
Other models developed to estimate human thermal comfort values
Structural equation modeling (SEM) was used to estimate the weights of microclimate indices in influencing HTC (). A measurement model of SEM tested the assumption that microclimate indices influenced HTC. HTC, whose values could not be directly measured, was a latent variable in SEM. Effects of single microclimate indices and their interactions on HTC were the observed variables. The response scores for microclimate preferences from the 408 survey questionnaires were SEM inputs as the values of single observed variables. For the observed variables of interactions, the SEM inputs were the products of two or three response scores. Because the path coefficients are standardized versions of linear regression weights in the SEM method, they were used as the estimations of weights of the observed variables affecting the latent variable (HTC). The path coefficients were obtained using maximum likelihood estimation. The results showed that the observed variables that were significantly correlated with HTC and met the requirements for the SEM model fits, ordered with respect to decreasing path coefficients, were T×RH×WS (0.976), LST×T×RH×WS (0.970), T×RH (0.840), WS (0.832), LST×T (0.830), LST×RH (0.795), LST (0.737), T (0.719), and RH (0.610) ().
Using different combinations of these variables, we developed different models to estimate HTC (HTCm) for the 93 patches used for validation. After comparing the coefficients of determination (R2), standard error, and significance level of the linear regression relationships between the estimated values from these models (HTCm) and the thermal comfort perception values from the survey questionnaire (HTCs) for the 93 patches, five models with the best fitting effects were finally selected as follows ():
From these equations, we found that LST was an important microclimate index that affected HTC. Additionally, there were strong interactions between LST and T or between LST and RH. Thus, it is very important and necessary to include LST in the HTC model, and including only T and RH in the general THI equation (EquationEquation (1))(1)
(1) is insufficient.
Validation of estimated modified thermal humidity index values
We calculated the MTHI values for the 93 patches using EquationEquation (5)(5)
(5) proposed in the present study. The regression relationships between MTHI and HTCm1, HTCm2, HTCm3, HTCm4, HTCm5, and HTCs were developed based on the values for the 93 patches. The comparison between MTHI and HTCs was a kind of direct validation using the surveyed perception ratings, while the comparison between MTHI and HTCm was a kind of indirect validation using the estimations from the other models.
The results showed that the MTHI values for the 93 patches varied between 46.12 and 87.47, 66.67% patches were at level 3, one patch was at level 5, and none at level 1. Extremely strong linear relationships were observed between the MTHI values estimated by EquationEquation (5)(5)
(5) and the HTCm1, HTCm2, HTCm3, HTCm4, and HTCm5 values estimated using EquationEquations (10)
(10)
(10) , (Equation11
(11)
(11) ), (Equation12
(12)
(12) ), (Equation13
(13)
(13) ), and (Equation14
(14)
(14) ), respectively (R2 ≥0.797, p < 0.001) () and between the estimated MTHI values and the HTCs values (R2 = 0.393, p < 0.001).
Figure 4. Comparisons between the estimated modified thermal humidity index (MTHI) and estimated (HTCm1 (a), HTCm2 (b), HTCm3 (c), HTCm4 (d), and HTCm5 (e)) and perceived human thermal comfort (HTCs (f)). The relationships are also compared between MTHI and THI.
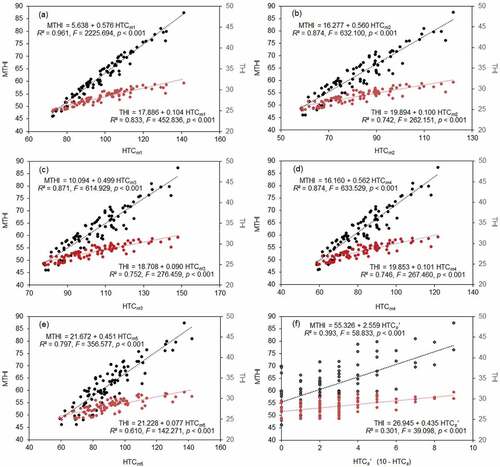
As HTCs varied between 1 and 4, the MTHIs values based on the MTHI-HTCs relation (MTHI = 55.326 + 2.559 (10 - HTCs)) () varied between 70.68 and 78.36, corresponding to HTC level 4 (theoretical MTHI of 72.6–85.7 in and ). As HTCs varied between 5 and 10, the MTHIs values varied between 55.33 and 70.68, corresponding to HTC level 3 (theoretical MTHI of 55.3–72.6 in and ). It indicated that the range of MTHIs values was highly consistent with that of MTHI at HTC level 3 (most patches were at level 3). However, we could not compare the ranges at the highest HTC level 5 and the lowest HTC levels 1 and 2 because of the lack of corresponding patches.
Moreover, we found that compared with THI, MTHI was more highly correlated with HTC (), which meant that MTHI was more effective when indicating human thermal comfort than THI.
Results
Temporal dynamics of human thermal comfort of vegetation patches
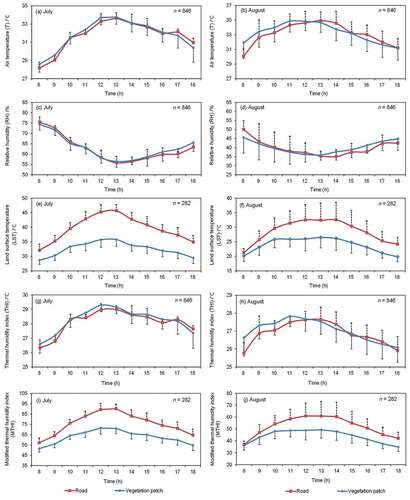
The paired-samples t-test results for the measured data showed that there were no significant differences in T and RH (and thus THI) values between the vegetation patches and their adjacent roads in both July and August (), and the LST values of vegetation patches were significantly lower than those of roads (). The paired-samples t-test results also showed that MTHI values of vegetation patches (58.51 ± 12.32) were significantly lower than those of roads (68.96 ± 16.49) (p < 0.0001) in both July and August. The MTHI values of both vegetation patches and roads peaked at 12:00–13:00 or 12:00–14:00, which were similar to T and LST and contrary to RH, whereas the daytime MTHI values of roads fluctuated considerably more than those of vegetation patches ().
Figure 5. Daytime variations in measured microclimate indices and calculated thermal humidity indices for vegetation patches and roads in the study riparian buffer in July and August. The values at each time were from the mean measured or estimated data for the 47 vegetation patches, each having 18 (for T, RH, and THI) or 6 (for LST and MTHI) repeated measurements. Standard deviation bars are also provided.
MTHI in the study subarea gradually reduced from July (67.93 ± 7.74) to August (49.37 ± 7.83) and September (46.72 ± 5.89). At 11:00–16:00 in July, at least 87% of the subarea reached HTC level 5 (torrid) or 4 (very hot), and at 12:00–14:00, 100% of the subarea reached the two highest levels (). Some people might suffer from a heatstroke or shock because of the extremely hot atmosphere in July. In August, none of the areas reached HTC level 5, and not more than 24% of the subarea reached level 4, even at 12:00–13:00 (), and in September, no area had an HTC level higher than 3 (hot) (). Thus, visitors might feel hot at most but without any unbearable feeling in August and September.
Figure 6. Area portions of different human thermal comfort (HTC) levels at the daytime for the vegetation patches in the study riparian buffer in July (a), August (b), and September (c).
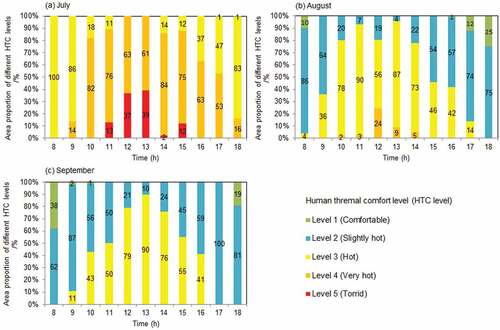
In July, no area reached HTC level 1 (comfortable) or 2 (slightly hot) even at 8:00–9:00 and 18:00–19:00 (). Thus, people felt uncomfortable throughout the subarea during the daytime. In August, at least 10% of the subarea reached HTC level 1, and at least 96% of the subarea reached HTC level 1 or 2 at 8:00–9:00 and 18:00–19:00 (). In September, HTC levels 1 or 2 were observed throughout the subarea at 8:00–9:00 and 17:00–19:00 () when visitors felt comfortable.
Spatial variation in human thermal comfort of vegetation patches
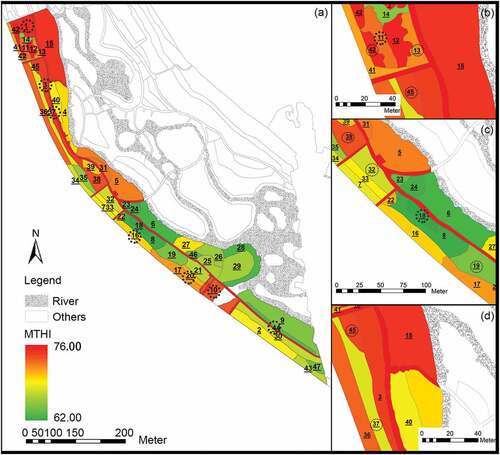
The estimated mean MTHI for the daytime (8:00–19:00) in July was 67.93 ± 7.74 for the 47 study vegetation patches. Among these patches, only four patches (15, 1, 42, and 12) had the mean MTHI ranging from 73.36 to 76.14 and HTC level 4 (very hot), and others had mean MTHI ranging from 62.22 to 72.52 and HTC level 3 (hot) (). In contrast, nearly 90% patches reached HTC level 4 or level 5 (torrid) at 10:00–17:00, and 10.6% patches reached HTC level 5 at 12:00–14:00.
Figure 7. Estimated mean daytime modified thermal humidity index (MTHI) over the study subarea.
The paired-samples t-test that was performed on the five types of vegetation patches showed that the vertical vegetation structure had significant impacts on MTHI. In July, the estimated mean daytime MTHI within the herb patches (70.56 ± 4.13) was always significantly higher than that within the other patches (p < 0.001). The mean daytime MTHI within the tree+shrub patches (65.15 ± 4.35) was significantly lower than that within the tree patches (68.28 ± 2.69, p = 0.002), tree+herb patches (67.67 ± 3.18, p = 0.001), and shrub patches (67.14 ± 2.74, p = 0.010). However, no significant difference was observed in the mean daytime MTHI among the tree+herb, tree, and shrub patches.
The redundancy analysis showed that the 82% (p = 0.002) variation in microclimate values could be explained by the six patch indices. From the length of the thick arrow in the ranking diagram, we found that NDR had the greatest effect on microclimate, followed by TCD, VC, and AVC, whereas ATCD and PAR had the least effects (). The cosine of the angle between patch indices and microclimate indices in the ranking diagram showed that the two spatial association indices (NDR and PAR) had significant effects on T and RH; for the four vegetation composition indices, TCD had the most significant effect on LST, VC and AVC had significant effects on LST and RH, and ATCD had significant effects on T and RH ().
Figure 8. Redundancy analysis between microclimate indices and patch indices.
The spatial association index NDR affected MTHI mainly by changing T and RH. Typically, the vegetation patches closer to the river had higher RH and lower T and MTHI values. If other conditions remained constant, MTHI could increase by approximately 0.7 as NDR increased by 10 m. For instance, for shrub patch 10, NDR was 50% higher than that for shrub patch 20, and MTHI was 1.24 higher than that for patch 20 () even though its ATCD and AVC were 121.94% and 12.35% higher than those of patch 20, respectively (). This indicated that MTHI was affected by NDR more than by ATCD. Similar conclusions were drawn between tree+herb patch 42 and tree+herb patch 31 or tree patch 13 (). For tree+herb patch 42, NDR was 47.17% higher than that for tree patch 45, and MTHI was 2.60 higher than that for patch 45 () even though its TCD, AVC, VC, and ATCD were 79.37%, 58.87%, 52.61%, and 17.25% higher than those of patch 45, respectively (). This indicated that MTHI was affected by NDR more than by TCD, AVC, and VC. Similar conclusions were drawn between shrub patches 10 and 11 ().
Figure 9. Comparisons of structure indices and their effects on modified thermal humidity index (MTHI) between different patches.
The vegetation composition indices of central patches VC and TCD affected MTHI mainly by altering LST or RH. MTHI was affected by TCD more than by VC. The patches with higher VC or TCD had higher RH and lower LST and MTHI. If other conditions remained constant, MTHI decreased by approximately 0.5 and 0.3 as VC and TCD increased by 10%, respectively. For instance, the AVC, ATCD, and NDR of shrub patch 38 were close to those of shrub patch 19, and MTHI was 5.11 higher than that for patch 19 () because its VC was just 17.88% of that of patch 19 (). A similar comparison was made between shrub patches 38 and 18 (). The AVC, ATCD, and NDR of tree patch 45 were close to those of tree patch 37, and MTHI was 3.56 higher than that of patch 37 (), which was mostly because of the 36.00% lower TCD than that of patch 37, although its VC was 33.48% higher than that of patch 37 (). The ATCD, NDR, and AVC of tree patch 37 were close to those of tree patch 1, and MTHI was 5.80 lower than that of patch 1 () because its VC and TCD were 217.67% and 177.78% higher than those of patch 1, respectively (). The TCD, NDR, and AVC of tree patch 16 were close to those of patch 37, and MTHI was 0.8 higher than that of patch 37 () because patch 16 had few herbs or shrubs (VC was only 1.32%), although its ATCD was 134.51% higher than that of patch 37 (), which indicated that if there were few herbs or shrubs within a central patch, MTHI would be affected by its vegetation composition more than by its adjacent plant abundance.
ATCD, one of the vegetation composition indices of adjacent patches, affected MTHI mainly by changing T and RH. If other conditions remained constant, MTHI decreased by approximately 0.5 as ATCD increased by 10%. For instance, the TCD, AVC, and NDR of tree patch 3 were similar to those of tree patch 44, and MTHI was 8.54 higher than that of patch 44 (), which was mostly because of the 69.75% lower ATCD than that of patch 44, although its VC was 51.63% higher than that of patch 44 ().
Overall, a high MTHI value (>70) might occur within any patch irrespective of its vertical vegetation structure. In the present study, the patches with MTHI >70 had the following common characteristics in vegetation composition and spatial pattern: most were at a distance of more than 37 m from the river; there were less herbs or shrubs within the patches and their adjacent patches, and VC and AVC values were lower than 24%–27%; there were less trees within the patches and their adjacent patches, and TCD and ATCD values were lower than 0.46 and 0.29, respectively. For the patches with MTHI <70, the patch indices were significantly higher or lower than those of the patches with MTHI >70. These differences implied the critical thresholds of the variations in MTHI with patch structure.
Discussion
Advantages and limitations of modified thermal humidity index
In the present study, the developed THI-based MTHI was accurate when used for evaluating HTC, which was affected by microclimate. Our study showed that MTHI was more sensitive to microclimate changes and thus thermal comfort changes than THI. MTHI of vegetation patches was significantly lower than that of their adjacent roads (); however, no significant difference was observed in their THI values (), although people clearly felt the difference in the cool vegetation patch environment and its hot adjacent road. MTHI indicated thermal comfort more quickly and accurately than THI mainly because MTHI included LST (EquationEquation (5))(5)
(5) and had a highly positive linear correlation with LST when THI was fixed. During the daytime, the ground absorbs short-wave solar radiation and is heated rapidly. The ground can transfer considerable heat to the air in the form of sensible and latent heat, causing T to increase. Moreover, some heat is returned to the air from the ground by long-wave radiation, and the radiation quantity depends on LST. The near-surface atmosphere mostly absorbs long-wave radiation from the ground and sensible and latent heat emissions and less directly absorbs short-wave solar radiation. Thus, the response of LST to solar radiation variations is faster than that of T (Li, Zhou, and Ouyang Citation2013; Voogt and Oke Citation1998; Weng Citation2009; Wilmers Citation1990); MTHI and HTC indicated by LST are also closely related to solar radiation variations. Therefore, by involving LST, MTHI can overcome the flaws of the general thermal humidity indices that ignore sunlight, which is the main component of the environmental heat load (Budd Citation2008).
Temperature and humidity do not independently affect thermal comfort; thus, their interactions must be presented in an index. For example, although moist air has a positive effect on thermal comfort, combined high humidity, and high temperature may cause heat illness or a marked discomfort because saturated water-vapor pressure may restrict sweat evaporation over the body and accumulate heat in the body (Budd Citation2008). The effect of the interaction between temperature and humidity can be reflected in THI by the positive correlation between THI and T×RH. This explains why THI was higher in early July than in early August (paired-samples t-test; t = 22.636, p < 0.001), while T was lower and RH was higher in early July than in early August. For MTHI, this positive interaction effect was enhanced by both T×RH and LST×T×RH. This explained why MTHI was much higher in early July than in early August (paired-samples t-test; t = 53.918, p < 0.001). In summary, MTHI not only retained this advantage of THI but also enhanced it. In addition, compared with THI, MTHI can exhibit more interactions by introducing not only T×RH and LST×T×RH, but also LST×T and LST×RH.
However, MTHI has its limitations. MTHI was developed based on the thermal category thresholds of both THI and LST and the relationship between THI and LST from these thresholds. The theoretical thresholds of MTHI were determinately obtained from the relationship of MTHI with T, RH, LST, and their interactions (; ). However, the actual thresholds of MTHI may be more complex and uncertain. Therefore, we illustrated a larger potential elliptical zone in than the limited one defined by the theoretical thresholds of MTHI, THI, and LST′. This elliptical zone should be variable with latitude or altitude. Our measured data showed that in general, good agreement was observed between THI and LST, between THI and MTHI, and between MTHI and T, RH, and LST; thus, THI and LST values could fall within the same MTHI category to indicate the same HTC level. However, in a few cases, LST values were low, and THI values were high, or vice versa. If there was a significant divergence between LST and THI, MTHI would fall outside the elliptical zone, indicating that the MTHI method was not suitable for this case.
There might be some wonder about whether the approach can be applied to many patches over a large area, because the broad-scale meteorological data at a large area cannot meet the estimation accuracy at fine-scale patches, while the measurements within each patch cannot be realized rapidly and timely. It is feasible to measure microclimate within each of 47 patches for an area of 6.0 ha in the present study, but for a large area with much more patches, it is impossible. Thus, from the broad-scale meteorological data that is more easily obtained, what we can derive is broad-scale MTHI, which cannot accord with fine-scale patch. This mismatch of scale indeed limits us to explore the relationship between thermal comforts and patch structures. However, it will not have any limitation on deriving the spatial and temporal distribution of MTHI, even if it might be at a broad scale. Moreover, the definitions of patches are not fixed. For a large area (e.g., 10000 km2), it is necessary to define large patches (e.g., 100 km2) to accord with the area extent and the scales of other associated variables (such as meteorological ones). Finally, although our results of MTHI are based on patches, they may be also based on grid cells. Only if there exists meteorological data (including the data interpolated at grid cells), no matter at which scale, we can derive the spatial and temporal distribution of thermal comfort using this approach.
There is no general index to quantify thermal comfort, although many indices have been developed (Moran, Shitzer, and Pandolf Citation1998). THI and the thermal categories of THI and LST are limited within some geographical areas and for some people; thus, MTHI, which was developed based on their interaction and thermal categories, is also limited by area and people. The tolerances of people living at different latitudes or altitudes to thermal humidity are different. However, they vary within a relatively stable range. MTHI is more suitable for people who conduct routine activities in middle-latitude and low-altitude areas. In addition, the current MTHI does not involve wind speed, and it is more suitable for sunny days with breeze.
Factors that affect thermal humidity of vegetation patches
Considerable differences in MTHI were observed among different vegetation patches, and the lowest MTHI was 13.90 lower than the highest one. Vegetation composition was an important factor. Vegetation patches with complex vertical structures (such as tree+shrub) had significantly lower MTHI than those with simple vertical structures (such as tree, shrub, herb, or tree+herb), consistent with the results of many studies (Amani-Beni et al. Citation2018; Nichol Citation1996). Our study showed that MTHI insignificantly decreased with increased VC and TCD, primarily by acting on LST or RH. Many studies on the relationship between LST and plant abundance have drawn similar conclusions (Amani-Beni et al. Citation2018; Jonsson Citation2004; Tan et al. Citation2015). Within the vegetation patches with higher VC or TCD, herb/shrub crown or tree canopy has a stronger reflectance and absorption of solar radiation (Ng et al. Citation2012; Tan et al. Citation2015), and tree canopies with higher TCD can form a larger shadow area. These effects can effectively reduce the proportion of lightened land surface both under the crown or canopy and on the surrounding open area, resulting in a decrease in radiation received and absorbed by the underlying surface (Sun et al. Citation2017; Tao et al. Citation2017). Moreover, increasing VC or TCD can enhance the transpiration efficiency of herbs/shrubs or trees and latent heat energy dissipation, resulting in low LST and high RH (Amani-Beni et al. Citation2018; Jonsson Citation2004).
The difference in MTHI among vegetation patches depended not only on the vegetation compositions of these patches but also on the compositions of their adjacent patches, although the effect from the adjacent patches was weaker than that from the central patches. Our study showed that MTHI insignificantly decreased with increased ATCD (primarily by T and RH) and AVC (primarily by LST and RH). Temperature and humidity within a central vegetation patch may be affected by its adjacent patches with numerous trees or herbs/shrubs by horizontal convection cooling and wetting.
The difference in MTHI among vegetation patches was affected by not only the vegetation composition of central patches and their adjacent patches but also the spatial associations among heterogeneous patches (Wu and Chen Citation2017). Our study showed that NDR had the most significant correlation with MTHI among the selected patch indices, similar to the results of previous studies (Jenerette et al. Citation2011; Moore, Spittlehouse, and Story Citation2005). Because river water has a high specific heat capacity, when the same amount of solar radiation is absorbed, the temperature of river water rises more slowly and is lower than that of its surrounding land. Moreover, considerable evaporation from the river surface can take significant heat away by latent heat dissipation, resulting in a low T and a high RH on the river surface. In addition, given that river water is highly fluid with high thermal conductivity, water and heat exchanges often occur between river water and its surrounding land. Therefore, when other factors are similar, the vegetation patches closer to the river had lower temperature, wetter air, and thus, lower MTHI (Eskelson et al. Citation2011; Rambo and North Citation2008).
Approaches to improving human thermal comfort
Our study showed that people always felt uncomfortable in the riparian buffer during the daytime in July when high temperatures occur most frequently. Hence, the restored riparian subarea did not realize its ecosystem service of effectively regulating the microclimate, and some effective and efficient measures need to be undertaken to improve thermal comfort.
In the study subarea, NDR affected the microclimate and MTHI the most; thus, rivers are very important for improving the microclimate and relieving the thermal environment. Hence, we suggest making better use of river water (e.g., increasing some ditches to which river water is drawn around the activity spaces). In addition, the amount of river water in our study area was small; the riverway was narrow; the riverbed was exposed at many locations (). If the riverway is dredged such that the water amount increases, a cooling environment will be developed.
Although the effect of patch plant abundance on MTHI was not as significant as expected, when VC or TCD reached a certain threshold, MTHI values exhibited a clearly reducing trend. Therefore, increasing plant abundance both within a patch and its adjacent areas can effectively improve thermal comfort.
Because the cost of heavy plantation is high, some key sites are more likely to be prioritized. Vegetation patches with the highest or high MTHI are the key sites; e.g., those with mean MTHI ≥70 and those with torrid HTC level at 12:00–14:00. The vegetation patches located at road corners or close to high-cover hardened surfaces, such as basketball and volleyball courts, are also the key sites because many visitors spend a considerable amount of time there. Some patches located at road corners had a very high MTHI; e.g., patches 12, 1, and 38 had MTHI values of 76.14, 73.80, and 70.56, respectively (). These patches with high MTHI had the following common characteristics: VC was lower than 18%, and there were no effective canopy shades; e.g., patch 1 had a VC of 3.6% and TCD of 0.14. In contrast, the patches with low MTHI had either high VC (for example, patch 18 had a VC of 78.0%) or effective canopy shades (for example, patch 8 had a TCD of 69.8%). Therefore, to utilize the limited green space in urban areas to improve the microclimate comfort, low efficient planting activity must be avoided as much as possible, especially at these key sites. We suggest avoiding planting trees that cannot form sufficient shades for the land surface (for example, making TCD lower than 0.46) and avoiding planting sparse herbs or shrubs (for example, making VC lower than 24%). In addition, we suggest reducing large and contiguous activity spaces with low VC or dividing large activity spaces into multiple small ones surrounded by discrete plants to increase the total cooling potential.
The vegetation patches by the river are also the key sites because many visitors spend considerable amounts of time there for playing with water or fishing. Typically, herbs, shrubs, or short trees were planted more along the riverbanks in our study area. However, the riverbank plants did not necessarily result in low MTHI. For example, MTHI for the riverbank shrub (Toona sinensis) patch 5 was 69.59, much higher than those for the riverbank shrub (reeds) patch 28 and shrub (Rhodotypos scandens) patch 6 (about 64) (). This was mainly because patch 5 had a lower VC (21.19%) than patches 28 and 6 (about 68%). Additionally, patches 28 and 6 were adjacent to the patches with larger canopies, such as tree (Syringa oblate)+herb patch 29 and tree (Populus tomentosa)+shrub patch 8 (), which had TCD values of 1.15 and 0.70, respectively. Hence, even if the area is near the river, adequate attention must be directed toward herb or shrub abundance and adjacent tree planting to improve the microclimate at riverbanks.
Adjusting the vertical vegetation structure may be a more effective and efficient measure than increasing the planting abundance to improve the thermal comfort. Constructing more tree+shrub patches than tree+herb/tree/shrub/herb patches is beneficial to decrease MTHI; however, there were only three tree+shrub patches in the study subarea; thus, considerably increasing tree+shrub patches will improve the thermal comfort. Moreover, the contribution of shrubs to decrease MTHI was slightly greater than that of trees. Thus, an effective and efficient measure involves replacing costly trees with more shrubs.
Conclusions
The present study proposed a new thermal humidity index (i.e., MTHI) that included LST closely correlated with solar radiation, which made MTHI more sensitive to microclimate changes than the widely used THI. Theoretically, MTHI can present the effects of both single microclimate indices and their interactions on thermal comfort. Based on the thermal category thresholds of both THI and LST, the determined theoretical thresholds of MTHI can indicate the corresponding human thermal comfort levels. By comparing the estimated MTHI values with other model estimations (from the survey of preference for microclimate) and measurements (from the survey of perception for thermal comfort), the proposed MTHI was confirmed to accurately indicate the thermal comfort on sunny days with breeze.
As a case study, we applied MTHI values to explore the temporal dynamics and spatial distribution of thermal comfort in an urban riparian landscape. However, MTHI can be applied to other urban landscapes in middle-latitude and low-altitude areas if LST values over the entire landscapes are derived. We also proposed six patch indices to quantify structural characteristics of a patch and its adjacent patches, and utilized the relationships between MTHI and patch indices to offer suggestions to alleviate the thermal discomfort in the summer. Both the relationships and suggestions can be extended to other urban areas.
In the future, we expect to further modify MTHI by involving other critical meteorological variables (such as wind speed) that may affect the HTC. We will further evaluate the estimation accuracy of MTHI in other urban areas or in larger areas based on broad-scale meteorological data. We will also try to apply MTHI to the planning and design of different urban landscapes to improve the microclimate regulation services of these landscapes.
Acknowledgments
We gratefully acknowledge the graduate students who helped us conduct field work and the visitors who gave their active responses on our surveys. We would like to thank all reviewers for helpful suggestions and comments. Finally, we would like to thank Editage (http://www.editage.cn/index.html) for English language editing.
Disclosure statement
No potential conflict of interest was reported by the author(s).
Additional information
Funding
References
- Amani-Beni, M., B. Zhang, G. di Xie, and J. Xu. 2018. “Impact of Urban Park’s Tree, Grass and Waterbody on Microclimate in Hot Summer Days: A Case Study of Olympic Park in Beijing, China.” Urban Forestry and Urban Greening 32: 1–18. doi:10.1016/j.ufug.2018.03.016.
- Balogun, I. A., and M. T. Daramola. 2019. “The Outdoor Thermal Comfort Assessment of Different Urban Configurations Within Akure City, Nigeria.” Urban Climate 29: 100489. doi:10.1016/j.uclim.2019.100489.
- Budd, G. M. 2008. “Wet-Bulb Globe Temperature (WBGT)-Its History and Its Limitations.” Journal of Science and Medicine in Sport / Sports Medicine Australia 11: 20–32. doi:10.1016/j.jsams.2007.07.003.
- Colyvan, M., J. Justus, and H. M. Regan. 2010. “The Natural Environment is Valuable but Not Infinitely Valuable.” Conservation Letters 3: 224–228. doi:10.1111/j.1755-263X.2010.00118.x.
- Dahdouh-Guebas, F., and N. Koedam. 2006. “Empirical Estimate of the Reliability of the Use of the Point-Centred Quarter Method (PCQM): Solutions to Ambiguous Field Situations and Description of the PCQM+ Protocol.” Forest Ecology and Management 228: 1–18. doi:10.1016/j.foreco.2005.10.076.
- Dobbs, C., F. J. Escobedo, and W. C. Zipperer. 2011. “A Framework for Developing Urban Forest Ecosystem Services and Goods Indicators.” Landscape and Urban Planning 99: 196–206. doi:10.1016/j.landurbplan.2010.11.004.
- Eludoyin, O. M., and I. O. Adelekan. 2013. “The Physiologic Climate of Nigeria.” International Journal of Biometeorology 57: 241–264. doi:10.1007/s00484-012-0549-3.
- Eskelson, B. N. I., P. D. Anderson, J. C. Hagar, and H. Temesgen. 2011. “Geostatistical Modeling of Riparian Forest Microclimate and Its Implications for Sampling.” Canadian Journal of Forest Research: Journal Canadien de la Recherche Forestiere 41: 974–985. doi:10.1139/x11-015.
- Feng, L., M. Zhao, Y. Zhou, L. Zhu, and H. Tian. 2020. “The Seasonal and Annual Impacts of Landscape Patterns on the Urban Thermal Comfort Using Landsat.” Ecological Indicators 110: 105798. doi:10.1016/j.ecolind.2019.105798.
- Gagge, A. P., J. A. J. Stolwijk, and Y. Nishi. 1972. “An Effective Temperature Scale Based on a Simple Model of Human Physiological Regulatory Response.” ASHRAE Transactions 77: 247–257.
- Huang, C., Y. Yun, W. Yu, X. Yuan, R. Zhao, H. Li, and L. Li. 2013. ”Research on Space Grading Affected by Summer Thermal Comfort Degree in Tianjin: A Case Study of TM Image Inversion-Based Urban Heat Island Effect.” Shanghai Urban Planning and Review 5: 76–80. (in Chinese).
- Jendritzky, G., R. de Dear, and G. Havenith. 2012. “UTCI-Why Another Thermal Index?” International Journal of Biometeorology 56: 421–428. doi:10.1007/s00484-011-0513-7.
- Jenerette, G. D., S. L. Harlan, W. L. Stefanov, and C. A. Martin. 2011. “Ecosystem Services and Urban Heat Riskscape Moderation: Water, Green Spaces, and Social Inequality in Phoenix, USA.” Ecological Applications : A Publication of the Ecological Society of America 21: 2637–2651. doi:10.1890/10-1493.1.
- Jiang, B., C. Wong, F. Lu, Z. Ouyang, and Y. Wang. 2014. “Drivers of Drying on the Yongding River in Beijing.” Journal of Hydrology 519: 69–79. doi:10.1016/j.jhydrol.2014.06.033.
- Jonsson, P. 2004. “Vegetation as an Urban Climate Control in the Subtropical City of Gaborone, Botswana.” International Journal of Climatology 24: 1307–1322. doi:10.1002/joc.1064.
- Klok, L., S. Zwart, H. Verhagen, and E. Mauri. 2012. “The Surface Heat Island of Rotterdam and Its Relationship with Urban Surface Characteristics.” Resources, Conservation & Recycling 64: 23–29. doi:10.1016/j.resconrec.2012.01.009.
- Kong, F., W. Yan, G. Zheng, H. Yin, G. Cavan, W. Zhan, N. Zhang, and L. Cheng. 2016. “Retrieval of Three-Dimensional Tree Canopy and Shade Using Terrestrial Laser Scanning (TLS) Data to Analyze the Cooling Effect of Vegetation.” Agricultural and Forest Meteorology 217: 22–34. doi:10.1016/j.agrformet.2015.11.005.
- Kovats, R. S., and S. Hajat. 2008. “Heat Stress and Public Health: A Critical Review.” Annual Review of Public Health 29: 41–55. doi:10.1146/annurev.publhealth.29.020907.090843.
- Li, X., W. Zhou, and Z. Ouyang. 2013. “Relationship Between Land Surface Temperature and Spatial Pattern of Greenspace: What are the Effects of Spatial Resolution?” Landscape and Urban Planning 114: 1–8. doi:10.1016/j.landurbplan.2013.02.005.
- Mahmoud, A. H. A. 2011. “Analysis of the Microclimatic and Human Comfort Conditions in an Urban Park in Hot and Arid Regions.” Building and Environment 46: 2641–2656. doi:10.1016/j.buildenv.2011.06.025.
- Mather, J. R. 1974. Climatology : Fundamentals and Applications. New York: McGraw-Hill Book Company.
- Mayer, H., and P. Höppe. 1987. “Thermal Comfort of Man in Different Urban Environments.” Theoretical and Applied Climatology 38: 43–49.
- Meehl, G. A., and C. Tebaldi. 2004. “More Intense, More Frequent, and Longer Lasting Heat Waves in the 21st Century.” Science 305: 994–997. doi:10.1126/science.1098704.
- Metje, N., M. Sterling, and C. J. Baker. 2008. “Pedestrian Comfort Using Clothing Values and Body Temperatures.” Journal of Wind Engineering and Industrial Aerodynamics 96: 412–435. doi:10.1016/j.jweia.2008.01.003.
- Moore, R. D., D. L. Spittlehouse, and A. Story. 2005. “Riparian Microclimate and Stream Temperature Response to Forest Harvesting: A Review.” Journal of the American Water Resources Association / AWRA 41: 813–834. doi:10.1111/j.1752-1688.2005.tb03772.x.
- Moran, D. S., and Y. Epstein. 2006. “Evaluation of the Environmental Stress Index (ESI) for Hot/Dry and Hot/Wet Climates.” Industrial Health 44: 399–403. doi:10.2486/indhealth.44.399.
- Moran, D. S., K. B. Pandolf, Y. Shapiro, Y. Heled, Y. Shani, W. T. Mathew, and R. R. Gonzalez. 2001. “An Environmental Stress Index (ESI) as a Substitute for the Wet Bulb Globe Temperature (WBGT).” Journal of Thermal Biology 26: 427–431. doi:10.1016/S0306-4565(01)00055-9.
- Moran, D. S., A. Shitzer, and K. B. Pandolf. 1998. “A Physiological Strain Index to Evaluate Heat Stress.” Heat Strain Index 275: 129–134. doi:10.1152/ajpregu.1998.275.1.R129.
- Nasir, R. A., S. S. Ahmad, and A. Z. Ahmed. 2012. “Psychological Adaptation of Outdoor Thermal Comfort in Shaded Green Spaces in Malaysia.” Social and Behavioral Sciences 68: 865–878. doi:10.1016/j.sbspro.2012.12.273.
- Ng, E., L. Chen, Y. Wang, and C. Yuan. 2012. “A Study on the Cooling Effects of Greening in a High-Density City: An Experience from Hong Kong.” Building and Environment 47: 256–271. doi:10.1016/j.buildenv.2011.07.014.
- Nichol, J. E. 1996. “High-Resolution Surface Temperature Patterns Related to Urban Morphology in a Tropical City: A Satellite-Based Study.” Journal of Applied Meteorology 35: 135–152. doi:10.1175/1520-0450(1996)035<0135:HRSTPR>2.0.CO;2.
- Nikolopoulou, M., and S. Lykoudis. 2006. “Thermal Comfort in Outdoor Urban Spaces: Analysis Across Different European Countries.” Building and Environment 41: 1455–1470. doi:10.1016/j.buildenv.2005.05.031.
- Rambo, T. R., and M. P. North. 2008. “Spatial and Temporal Variability of Canopy Microclimate in a Sierra Nevada Riparian Forest.” Northwest Scientific 82: 259–268. doi:10.3955/0029-344X-82.4.259.
- Shao, H., H. Lu, G. Xu, and B. Marian. 2017. “Integration into Plant Biology and Soil Science Has Provided Insights into the Total Environment.” The Science of the Total Environment 579: 928–929. doi:10.1016/j.scitotenv.2016.10.167.
- Sharma, M. R., and S. Ali. 1986. “Tropical Summer Index-A Study of Thermal Comfort of Indian Subjects.” Building and Environment 21: 11–24. doi:10.1016/0360-1323(86)90004-1.
- Stabler, L. B., C. A. Martin, and A. J. Brazel. 2005. “Microclimates in a Desert City Were Related to Land Use and Vegetation Index.” Urban Forestry and Urban Greening 3: 137–147. doi:10.1016/j.ufug.2004.11.001.
- Sun, S., X. Xu, Z. Lao, W. Liu, Z. Li, E. Higueras García, L. He, and J. Zhu. 2017. “Evaluating the Impact of Urban Green Space and Landscape Design Parameters on Thermal Comfort in Hot Summer by Numerical Simulation.” Building and Environment 123: 277–288. doi:10.1016/j.buildenv.2017.07.010.
- Tahbaz, M. 2011. “Psychrometric Chart as a Basis for Outdoor Thermal Analysis.” International Journal of Architectural Engineering & Urban Planning 21: 95–109.
- Tan, C. L., N. H. Wong, S. K. Jusuf, and Z. Q. Chiam. 2015. “Impact of Plant Evapotranspiration Rate and Shrub Albedo on Temperature Reduction in the Tropical Outdoor Environment.” Building and Environment 94: 206–217. doi:10.1016/j.buildenv.2015.08.001.
- Tao, Q., Z. Li, J. Zheng, and X. Chen. 2017. “Model of Solar Diffuse Radiation Transmission Through Circular Perforated Louvers and Experimental Verification.” Energy and Buildings 142: 49–55. doi:10.1016/j.enbuild.2017.03.002.
- Thom, E. C. 1959. “The Discomfort Index.” Weatherwise 12: 57–61. doi:10.1080/00431672.1959.9926960.
- Tomlinson, C. J., L. Chapman, J. E. Thornes, and C. J. Baker. 2011. “Including the Urban Heat Island in Spatial Heat Health Risk Assessment Strategies: A Case Study for Birmingham, UK.” International Journal of Health Geographics 10: 42. doi:10.1186/1476-072X-10-42.
- Trancoso, R., J. Syktus, N. Toombs, D. Ahrens, K.-K.-H. Wong, and R. D. Pozza. 2020. “Heatwaves Intensification in Australia: A Consistent Trajectory Across Past, Present and Future.” The Science of the Total Environment 742: 140521. doi:10.1016/j.scitotenv.2020.140521.
- Unger, J. 1999. “Comparisons of Urban and Rural Bioclimatological Conditions in the Case of a Central-European City.” International Journal of Biometeorology 43: 139–144. doi:10.1007/s004840050129.
- Voogt, J. A., and T. R. Oke. 1998. “Effects of Urban Surface Geometry on Remotely-Sensed Surface Temperature.” International Journal of Remote Sensing 19: 895–920. doi:10.1080/014311698215784.
- Wang, Y., and Y. Shen. 1998. ”The Temperature-Humidity Effect and Human Comfort in Shanghai Summer.” Journal of East China Normal University (Natural Science) 3: 60–66. (in Chinese).
- Wang, Z., X. Zhao, J. Yang, and J. Song. 2016. “Cooling and Energy Saving Potentials of Shade Trees and Urban Lawns in a Desert City.” Applied Energy 161: 437–444. doi:10.1016/j.apenergy.2015.10.047.
- Weng, Q. 2003. “Fractal Analysis of Satellite-Detected Urban Heat Island Effect.” Photogrammetric Engineering and Remote Sensing 69: 555–566. doi:10.14358/PERS.69.5.555-556.
- Weng, Q. 2009. “Thermal Infrared Remote Sensing for Urban Climate and Environmental Studies: Methods, Applications, and Trends.” ISPRS Journal of Photogrammetry and Remote Sensing 64: 335–344. doi:10.1016/j.isprsjprs.2009.03.007.
- Wilmers, F. 1990. “Effects of Vegetation on Urban Climate and Buildings.” Energy and Buildings 16: 507–514. doi:10.1016/0378-7788(90)90028-H.
- Wu, Z., and L. Chen. 2017. “Optimizing the Spatial Arrangement of Trees in Residential Neighborhoods for Better Cooling Effects: Integrating Modeling with in-Situ Measurements.” Landscape and Urban Planning 167: 463–472. doi:10.1016/j.landurbplan.2017.07.015.
- Xu, H., X. Hu, and H. Guan. 2017. “Development of a Fine-Scale Discomfort Index Map and Its Application in Measuring Living Environments Using Remotely-Sensed Thermal Infrared Imagery.” Energy and Buildings 150: 598–607. doi:10.1016/j.enbuild.2017.06.003.
- Yaglou, C., and D. Minard. 1957. “Control of Heat Casualties at Military Training Centers.” AMA: Archives of Industrial Health 16: 302–316.
- Zhang, N., and Y. Zhao. 2007. ”Effects of Crown Shape on Reflectance of Grassland.” Journal of Remote Sensing 11: 9–19. (in Chinese).
- Zhang, X., T. Zhong, X. Feng, and K. Wang. 2009. “Estimation of the Relationship Between Vegetation Patches and Urban Land Surface Temperature with Remote Sensing.” International Journal of Remote Sensing 30: 2105–2118. doi:10.1080/01431160802549252.
- Zhao, Q., D. J. Sailor, and E. Wentz. 2018. “Impact of Tree Locations and Arrangements on Outdoor Microclimates and Human Thermal Comfort in an Urban Residential Environment.” Urban Forestry and Urban Greening 32: 81–91. doi:10.1016/j.ufug.2018.03.022.
- Zhu, W., and Z. Deng. 2012. ”The Ecological Restoration of Yongding River in Urban Section.” Water Conservancy Science and Technology and Economy 2: 19–21. (in Chinese).