
 ?Mathematical formulae have been encoded as MathML and are displayed in this HTML version using MathJax in order to improve their display. Uncheck the box to turn MathJax off. This feature requires Javascript. Click on a formula to zoom.
ABSTRACT
Tropospheric ozone (O3) is a phytotoxic air pollutant and the O3-induced visible foliar injury (O3 VFI) is a biomarker. A recently developed Free-air O3 eXposure (FO3X) is a promising facility to verify field-observed “O3-like” VFIs and to establish a flux-based threshold for the O3 VFI onset. The present study compared O3-like VFI registered in the southern European forest sites with actual O3 VFI observed in a FO3X experiment. The O3-like VFIs were evaluated by eye in forests and thus it was subjective. According to the imaging analysis, we firstly demonstrated that major parts of the colors were similar in the field and the FO3X. The color pallets for O3 VFI was species-specific and considered a advanced tool for the O3 VFI diagnosis. In addition, we calculated a flux-based threshold for the O3 VFI onset at the FO3X based on a Phytotoxic Ozone Dose (POD1), which ranged from 4.9 to 18.1 mmol m−2 POD1. This FO3X-derived threshold partly explained but did not necessarily match with the observation for several tree species in actual forests. The multivariate analysis showed that O3 VFI was decreased by the presence of various species and suggested the importance of continuous monitoring activities in the field for the further analysis.
Introduction
Tropospheric ozone (O3) is a significant greenhouse gas and phytotoxic air pollutant, which has a deleterious effect on forest health (Watanabe et al. Citation2021). Therefore, monitoring forest health and functionality under climate change and air pollution is crucial for estimating forest vulnerability to the ongoing changes and for establishing mitigation measures (Paoletti et al. Citation2022). Furthermore, the recently revised National Emission Ceilings Directive of the European Union (2016/2284/EU, hereafter NEC Directive Citation2016 targets a 30% reduction in air pollutant emissions by 2030, compared with 2005 levels, and it is necessary to ensure the monitoring of air pollution impacts on ecosystems in EU member states as specified in Art. 9 of NEC Directive. Various O3 metrics such as AOT40 (Accumulated exposure Over a Threshold of 40 ppb; abbreviations are listed in Table S1) have been proposed to examine forest responses to O3 (Lefohn et al. Citation2018). However, scientific evidence has pointed out that O3 damage is closely related to O3 uptake through stomata (CLRTAP Citation2017). Therefore, Phytotoxic Ozone Dose above a stomatal-flux threshold Y (PODY), which is derived from a cumulative O3 uptake over the growing season, is now included in the NEC Directive for the assessment of quantitative O3 impacts on forest trees (de Marco et al. Citation2019).
When plants are exposed to O3, they often show specific O3-induced visible foliar injury (O3 VFI), which has been used as a bio-marker to assess potential negative impacts of O3 (Feng et al. Citation2014; Hoshika et al. Citation2018). Ozone-like VFIs have been found in various tree species across forest sites in Europe, indicating a possible phytotoxicity of the ambient level of O3 (annual O3 mean concentrations: 35 to 50 ppb) in forests (Paoletti et al. Citation2019; Vollenweider et al. Citation2019; Sicard et al. Citation2020).
Traditionally, the O3-like VFIs have been evaluated by eye and, thus, the approach was rather subjective, although much efforts have been made to harmonize the VFI monitoring through the inter-calibration courses by international organizations such as ICP-Forests (Schaub et al. Citation2016). A manipulative O3 exposure experiment is therefore considered as one of the key approaches for the validation of O3-like VFI to diagnose and identify foliar symptoms caused by O3 (Moura et al. Citation2018; Vollenweider et al. Citation2019). Previously, O3-like VFIs have been verified in a wide variety of settings, including greenhouses and chambers of various sizes and designs (e.g., Bussotti et al. Citation2003). Although those experiments provided an insight into potential mechanisms, a difference in meteorological factors such as light, air temperature, and wind speed between chambers and natural conditions may also affect a quantitative analysis of O3 VFI relative to actual field conditions (Nussbaum and Fuhrer Citation2000). Free-air O3 eXposure (FO3X) has been established in Italy since 2015, which is a unique facility in Mediterranean Europe to assess the effects of O3 on vegetation within the framework of the European AnaEE (Analysis and Experimentation on Ecosystems) Research Infrastructure. As is the case with free-air CO2 enrichment, experiments by free-air O3 enrichment are considered as the best approach to provide realistic estimates of tree responses under real-world conditions (Paoletti et al. Citation2017). Symptoms of O3 VFIs were reported in several tree species at the FO3X (Hoshika et al. Citation2018, Citation2020). However, there is a need for validation studies to confirm whether the O3-like VFIs observed in actual forests are similar enough to real O3 VFIs produced in the FO3X. In addition, little is known whether the FO3X-derived thresholds for O3 VFI can be applied to actual forest conditions, although such manipulative experiments have been used to develop standards for forest protection against O3 (Büker et al. Citation2015). A flux-based threshold for the O3 VFI onset is considered essential for the evaluation of regional O3 pollution (Sicard et al. Citation2020). According to the forest monitoring data, Sicard et al. (Citation2020) proposed flux-based thresholds for O3-like VFI of 5 and 12 mmol m−2 POD1 in dominant conifers and broadleaved trees, respectively.
The present study compared O3 VFI for forest tree species at the FO3X facility with the symptoms observed at actual forest sites with the main aim of validating the field observations. For this purpose, a dataset obtained at southern European forest sites (France, Italy, and Romania) was utilized thanks to the European project MOTTLES (MOnitoring ozone injury for seTTing new critical LevelS) (Paoletti et al. Citation2019). A novel color pallet approach was developed to analyze the color composition of symptoms for categorizing and standardizing the O3 VFI. The onset of O3 VFI was also analyzed on a stomatal flux basis using POD1. This study aimed to answer the following specific questions: 1) Are O3-like foliar symptoms observed in the field comparable to actual O3 VFIs produced at the FO3X? and 2) Does the FO3X-derived flux-based threshold also explain the incidence of O3 VFI at the forest sites?
Materials and methods
Ozone fumigation experiments at the FO3X facility
Ozone fumigation studies were carried out at the FO3X facility in Italy (43° 49“N, 11° 12” E, 55 m a.s.l.). We set three levels of O3 treatments (ambient O3 concentration [AA], 1.2 times ambient concentration [1.2×AA], and 1.4 times ambient concentration [1.4×AA], in 2015; AA, 1.5 times ambient concentration [1.5×AA], and twice ambient concentration [2.0×AA] in 2017, 2018, 2019, 2020). The experimental design was a split-plot with three replicated blocks (L × W × H: 5 × 5 × 2 m) for each O3 treatment. The specific detail of the fumigation system can be found in Paoletti et al. (Citation2017). Targeted species were three oaks (Quercus ilex L., Quercus pubescens Willd., Quercus robur L.) in 2015, strawberry tree (Arbutus unedo L.) in 2017, black alder (Alnus glutinosa (L.) Gaertn.), phillyrea (Phillyrea angustifolia L.), mountain ash (Sorbus aucuparia L.) and bilberry (Vaccinium myrtillus L.) in 2018, three pines (Pinus halepensis Mill., P. pinaster Ait., P. pinea L.) in 2019 and elmleaf blackberry (Rubus ulmifolius Schott) in 2020. Those species were common in the MOTTLES monitoring sites. All plants were transplanted into plastic pots (oaks: 10 L, phillyrea; bilberry, pines, and elmleaf blackberry: 25 L; strawberry tree: 30 L; black alder and mountain ash: 50 L) with a mixture of sand: peat: soil (1:1:1 as volume). Before the O3 fumigation, the pots were irrigated to keep the well-watered conditions, i.e., volumetric soil water content was kept to field capacity (0.295 m3 m−3, Paoletti et al. Citation2017). Target species, exposure period, hourly mean O3 concentrations, and mean meteorological parameters during the experiments are shown in .
Table 1. Exposure period, target species, and environmental conditions during the experiment at the free-air O3 eXposure (FO3X). n.A. denotes not available. Ambient O3 concentration (AA), 1.2 times ambient concentration (1.2×AA), 1.4 times ambient concentration (1.4×AA), 1.5 times ambient concentration (1.5×AA) and twice ambient concentration (2.0×AA).
The symptoms were carefully checked using a × 10 hand lens for the closer examination of injuries, and all leaves were targeted for each plant. Two-well experienced observers periodically assessed O3 VFI to determine the date for first-symptom onset. The observers were involved in validation activities, attended field courses and performed annual inter-comparison exercises, organized by ICP-Forests. Foliar injury was compared with the reference picture atlas provided by the validation center for central Europe (www.wsl.ch) and identified according to the previous O3 VFI studies in tree species (Calatayud et al. Citation2010; Hoshika et al. Citation2013; Schaub and Calatayud Citation2013).
MOTTLES forest sites and field observations
The study is based on data recorded by the MOTTLES O3 monitoring network from 2017 to 2021 for Italian sites, and 2017–2019 for other countries. The network includes various biogeographical regions in southern European forest sites in three countries (France, Italy, and Romania). The target forest sites cover representative species in these regions, such as Fagus sylvatica in mountainous Alpine areas and Quercus ilex in Mediterranean forest areas. As a result, the MOTTLES network considered 7 broadleaved and 4 coniferous dominant tree species ().
Table 2. Site information of the 17 monitoring ozone injury for seTttting new critical LevelS (MOTTLES) sites in France, Italy and Romania. Daily mean air temperature (T), Daily mean solar radiation (RAD), Daily mean relative humidity (RH), Annual total precipitation (Prep.) and Hourly mean ozone concentration (O3) are calculated from 2017 to 2021 for Italian sites and from 2017 to 2019 for France and Romania (± standard deviation).
Each site consisted of i) an open area (open field – OFD) to record remotely and continuously meteorological and O3 values with active sensors, ii) a nearby Light Exposed Sampling Site – LESS (Schaub et al. Citation2016), located in the light-exposed forest edge closest to the OFD station (maximum radius of 500 m) LESS area, and iii) an “in the plot” (ITP) area, where soil moisture and forest-health indicators are recorded into the forest. Specific details on MOTTLES active O3 monitoring sites are available in Paoletti et al. (Citation2019). The field protocols for assessing O3 VFI by MOTTLES surveyors followed the ICP-Forests manual (Schaub et al. Citation2016). Surveys were carried out by the same two people in each country from August to early-mid September, i.e., when O3 VFI are more likely to be observed in the MOTTLES sites (Dalstein et al. Citation2005; Paoletti et al. Citation2010). Two campaigns of trans-country inter-calibration were carried out within MOTTLES, and the surveyors had taken part in the international cross-calibration courses organized by ICP Forests.
At each site, the assessment of O3 VFI was conducted every year within the ITP and the LESS. In ITP, the evaluation of O3 VFI were performed at each plot on five trees randomly selected. For each tree, five light-exposed branches with ≥30 needles/leaves per branch or needle age class were removed from the upper crown. For deciduous species, current year (C) leaves/needles were assessed. For evergreen species, C, one – year–old (C + 1) and two – year–old (C + 2) leaves/needles were assessed. On each leaf/needle, the extent of O3 VFI (as a percentage of the total leaf area) was visually scored by using the actual percentage, and results were then averaged for the five branches, resulting in one value per tree; finally, the tree values were averaged per plot. In the MOTTLES network, the LESS is 50 m long and divided into 25 × 2 m2 non-overlapping quadrats. In 20 of the 25 quadrants, which were randomly chosen, all plant species were listed, and the presence or absence of O3 VFI was recorded on the same day in which the ITP survey was carried out.
For the species with validated O3 VFI, the available literature (Innes, Skelly, and Schaub Citation2001) and atlas provided by the validation center for central Europe (www.wsl.ch) were used to support the observations. Here, O3 VFI datasets at MOTTLES sites during 2017–2021 were used for the analysis.
Calculation of ozone indices
Both exposure- and flux-based O3 metrics were already calculated at MOTTLES sites over the study period from measured parameters (Sicard et al. Citation2020, Citation2021). In addition, the metrics, i.e., AOT40 and species-specific POD1, were calculated by using meteorological and O3 concentration data measured at the FO3X facility. Accumulated exposure over a threshold of 40 ppb (AOT40) was calculated using the hourly O3 data during daytime (solar radiation >50 W m−2, CLRTAP, Citation2017) measured at each site:
where [O3] is the hourly concentration of O3 (ppb), and dt is the time step (1 h).
Phytotoxic Ozone Dose above a detoxification threshold of 1 nmol m−2 s−1 (POD1) was calculated according to the standard methodology suggested by CLRTAP (Citation2017).
where Fst is the hourly stomatal uptake of O3 (nmol m−2 s−1), which is derived from leaf surface resistance (rc) and boundary layer resistance (rb) (CLRTAP, Citation2017). Fst is thus given by:
where gs is the stomatal conductance (mmol O3 m−2 projected leaf area [PLA] s−1). rb is calculated by wind speed and leaf dimension, and rc is defined as 1/(gs+gext) (s m−1). gext is the cuticular conductance (0.0004 s m−1). For the details of the calculation of rb and rc, see CLRTAP (Citation2017).
A simplified formula of the multiplicative stomatal conductance model was applied because all plants were grown under well-watered conditions at the FO3X (Hoshika et al. Citation2020). It is given by:
where gmax is the maximum stomatal conductance to O3 expressed on a total leaf surface area (mmol O3 m−2 PLA s−1), fmin is the minimum conductance, flight, ftemp, and fVPD indicate the stomatal response functions to photosynthetic photon flux density (PPFD), air temperature (T) and vapor pressure deficit (VPD), respectively. For several species (A. glutinosa, Q. ilex, Q. pubescens, Q. robus, S. aucuparia, V. myrtillus), species-specific stomatal conductance parameters were already reported in our previous studies (Hoshika et al. Citation2018, Citation2020). Stomatal conductance for the other species was parameterized according to the measurements with various meteorological conditions using a portable leaf gas exchange measurement system (CIRAS-2 PP Systems, Herts, UK). Measurements were carried out at least once a month (7 to 19 days in total for each species) throughout the experimental period (). Pooled data (A. unedo: 128 data, P. angustifolia: 374 data, P. halepensis: 174 data, P. pinaster: 303 data, P. pinea: 164 data, R. ulmifolius: 249 data) were used for the species-specific parameterization according to the boundary line technique (Elvira et al. Citation2004; Büker et al. Citation2015; Hoshika, Paoletti, and Omasa Citation2012). To draw the boundary line (i.e., upper limits of point gs data in a scatter diagram) for each environmental variable, the data were divided into the following stepwise classes: PPFD: 200 μmol m−2 s−1 steps (when PPFD <200 μmol m−2 s−1, 50 μmol m−2 s−1 steps were applied), T: 2°C steps, VPD: 0.2 kPa steps. Each model function was then fitted according to 95th percentile values per each stepwise class of environmental factors. gmax and fmin were estimated as the 95th and 5th percentile, respectively (Bičárová et al. Citation2019; Hoshika et al. Citation2020). For the detailed formula of flight, ftemp, and fVPD functions, see CLRTAP (Citation2017).
Data analysis
For three species, Rubus ulmifolius, Vaccinium myrtillus, and Sorbus aucuparia, an O3 VFI image analysis was developed to compare the symptoms observed in the field with those developed at the FO3X. Three pictures with minimum 180 dpi (RGB – red, green, blue color mode) of leaves presenting O3 VFI of each species were selected from the field and FO3X conditions. First, the mid-part of each leaf was cut off from the original picture with the same size for each species. Next, each cut of the sample picture was transformed in Indexed Color mode, and a Local (Perceptual) and an 8-color pallet was generated. Next, the color pallets were merged, forming a general 8-color pallet for the O3 VFI pictures obtained from MOTTLES or FO3X conditions. The final 8-color pallets, which characterize the color composition of O3 VFIs, were then compared between field and FO3X conditions, considering the percentage of the same colors appearing in both conditions. We surveyed the significant O3 VFI colors of the final color pallet (50% of the total colors range) as the ones better describing the O3 VFI (O3 VFI/Color), while the other colors were related to leaf typical chlorophyll pigments (LTCP). All analyses were conducted using Adobe Photoshop CC 2017, and the color names were verified in the Hex dictionary (https://www.hexdictionary.com/). All pictures analyzed with its, respectively, 8-color pallet are available as supplementary material (Fig. S1).
In order to detect main predictors for symptoms in the natural environment, we correlated symptom variables with site variables. We applied two linear models by using the linear model (lm) function of R software (Team R Development Core, Citation2018): in the first model we considered the percentage of symptomatic species within the LESS as response variable; in the second model we considered the O3 VFI (merging ITP and LESS data) as response variable. The following site variables were included in the model as predictors: year, country, slope aspect, dominant species, and biogeographical region (as categorical), elevation (as continuous), and the total number of species within the LESS (as count variable); all interactions among site variables were also considered in the model. Selection of the optimal model, among those generated by all possible combinations, was based on the Akaike Information Criterion (AIC) values to assess the quality of the model (Barton et al. Citation2012). For the best model selected, we also calculated R2 and parameter-specific p-values for each predictor level (e.g., value).
Results
Ozone visible injury at MOTTLES forest sites
The O3 VFI occurring in the MOTTLES sites were characterized by the following categories: Homogeneously distributed interveinal reddish (Rd), Reddish interveinal stippling (RdSt), Homogeneously distributed interveinal brownish (Brw), Dark brownish interveinal stippling (BrwSt), Bronzing (Br), and chlorosis (Cl) (). The 23 symptomatic species presented, in most of the cases, a combination of these symptoms. The most common O3 VFIs were Cl and BrwSt, occurring in 43% of the species, followed by RdSt, detected in 35% of the species. Rd, Br, and Brw occurred in 26%, 13%, and 9% of the species, respectively. Some pictures were selected to show each of the categorical O3 VFI occurring in symptomatic species at MOTTLES sites (.).
Figure 1. Examples of ozone visible foliar injury (O3 VFI) from Monitoring Ozone injury for seTTtting new critical LevelS (MOTTLES) sites and the Free-air O3 eXposure (FO3X), A and G) Homogeneously distributed interveinal reddish (Rd); B, C, F, H and I) Reddish interveinal stippling (RdSt); D, K and L) Dark brownish interveinal stippling (BrwSt); E and J) Chlorosis (Cl). K and L) Homogeneously distributed interveinal brownish (Brw); C, F) Bronzing (Br).
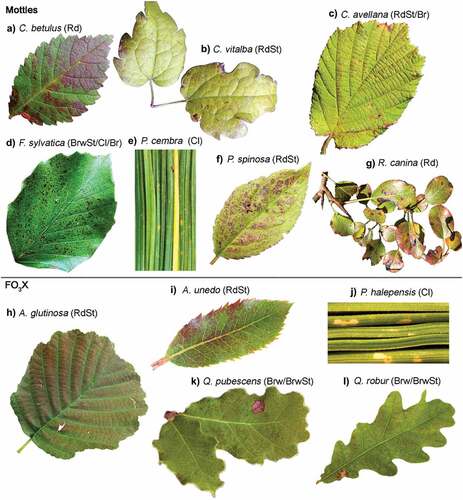
Table 3. Species showing ozone-induced visible foliar injury (O3 VFI) at the MOTTLES (Monitoring Ozone injury for seTttting new critical LevelS) sites (ITP – in the plot and LESS - Light Exposed Sampling Site) in France (FR), Italy (IT) and Romania (RO) or from the Free-air O3 eXposure (FO3X). O3-induced visible foliar injury (O3 VFI) classifies as homogeneously distributed interveinal reddish (Rd), Reddish interveinal stippling (RdSt), Homogeneously distributed interveinal brownish (Brw), Dark brownish interveinal stippling (BrwSt), chlorosis (Cl) and Bronzing (Br). Leaf habit (evergreen [Ev]/deciduous [De], conifer [C]/broadleaf [Br].
In MOTTLES forest sites, merging ITP and LESS data, O3 VFI was observed on 23 species, consisting of 14 trees, 8 shrubs and 1 liana (Clematis vitalba) (). Fagus sylvatica was the species found to be most frequently symptomatic (21 times across all sites and years), followed by the shrubs Rubus ulmifolius and Corylus avellana, recorded 12 and 11 times, respectively. Most of the symptomatic species were deciduous angiosperms, while only two conifers, i.e., Pinus cembra and Picea abies, were found to be symptomatic 2 times and once, respectively. Regarding the forest LESS, linear models showed that the percentage of symptomatic species, despite a significant influence of the country (; .), decreased with the increment in the total number of tree and shrub species within the LESS (.). The same trend was observed for O3 VFI (.); however, in this case, species richness in the LESS was the unique driver among the selected site characteristics.
Figure 2. Visual results of the selected linear model for the percentage of symptomatic species within the Light Exposed Sampling Site – LESS (symptomatic_sps) presented in table 3. Significant effects on symptomatic_sps determined by a) by the total number of species in the LESS (SR_LESS) plotted as linear regression with confidence interval and b) by the Country (FR, France; IT, Italy; RO, Romania) plotted as violin box plot.
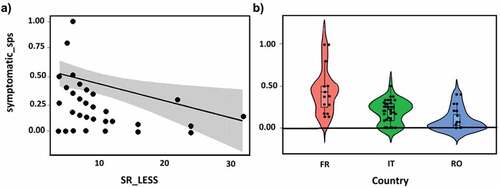
Figure 3. Visual results of the selected linear model for the percentage of ozone visible foliar injury (O3_VFI) per plot, presented in table 3. Significant effect on O3_VFI determined by the total number of species in the Light Exposed Sampling Site – LESS (SR_LESS) plotted as linear regression with confidence interval.
Table 4. Optimal linear model structures relating the percentage of symptomatic species (symptomatic_sp) over the LESS (Light Exposed Sampling Site) and the percentage of ozone visible foliar injury (O3 VFI) in the plot (ITP). Response variables to the total number of species in the LESS (SR_LESS), the country, and the year [R syntax of the starting model: y ~ SR_LESS * year * country * elevation * aspect * dominant species * biogeographical region]. Values for the predictor variables: SR_LESS, country (level Italy and Romania compared with France), are parameter estimates. R2 refers to the fraction of the variation explained by the model structure, and R2 adjusted takes into account the number of independent variables used for predicting the target variable.
Ozone visible injury at the FO3X
Pictures of the O3 VFI for the symptomatic species at FO3X are shown in .. Ozone exposure caused O3 VFI in all target deciduous species, while only two of six evergreen species were symptomatic, i.e., a Mediterranean shrub, A. unedo, and a Mediterranean pine, P. halepensis (). Among the symptomatic species, A. glutinosa, S. aucuparia, and V. myrtillus showed first symptoms even under real-world O3 conditions (18 May to 21 June), while O3 VFI was found only later for A. unedo and Q. pubescens (3 to 25 September).
Table 5. Onset of ozone visible foliar injury (O3 VFI) at the Free-air O3 eXposure (FO3X). Ambient O3 concentration (AA), 1.2 times ambient concentration (1.2×AA), 1.4 times ambient concentration (1.4×AA), 1.5 times ambient concentration (1.5×AA) and twice ambient concentration (2.0×AA).
Following the same classification used to identify O3 VFI in the MOTTLES sites, a similar combination of symptoms was observed in the eight symptomatic species in the FO3X facility (). The most common O3 VFI observed was BrwSt occurring in 50% of the species, followed by BrwSt and RdSt, detected in 38% of the species. Rd occurred in 25%, while Cl was found in 13% of the species. So far, Br has not been observed in the FO3X. The Cl mottling appeared on needles of P. halepensis, while the other evergreen species, A. unedo, presented RdSt occurring between the veins on the upper leaf surface. A similar symptom was found in V. myrtillus in which Rd was also observed. The deciduous broadleaf S. aucuparia presented RdSt, and also Brw and BrwSt. In addition, interveinal Rd appeared on the upper leaf surface in R. ulmifolius. Finally, Brw and BrwSt similarly occurred between the primary leaves veins in the two deciduous oak species.
Comparing ozone visible injury at the MOTTLES and FO3X sites: A color analysis
For R. ulmifolius, 62.5% of colors selected in the final 8-color pallets were common colors presented in both MOTTLES and FO3X samples (). Considering only the O3 VFI/Color, 75% of the colors were common between the MOTTLES and FO3X samples (Coral Reef − 512E10, Peat – C7BAA1, and Pesto − 6C6133). One specific O3 VFI/Color was not identified at FO3X samples and was recorded only at the MOTTLES site (Bracken − 512E10). Furthermore, 50% of the LTCP colors were common between the MOTTLES and FO3X samples.
Figure 4. Examples of color composition in adaxial leaf blades with ozone visible foliar injury (O3 VFI) from Monitoring Ozone injury for seTTtting new critical LevelS (MOTTLES) sites and the Free-air O3 eXposure (FO3X), A and C) Homogeneously distributed interveinal reddish (Rd); B and C) Reddish interveinal stippling (RdSt) B) Dark brownish interveinal stippling (BrwSt) and Homogeneously distributed interveinal brownish (Brw). Colors better describing the O3 VFI (O3 VFI/Color) or Leaf typical chlorophyll pigments (LTCP).
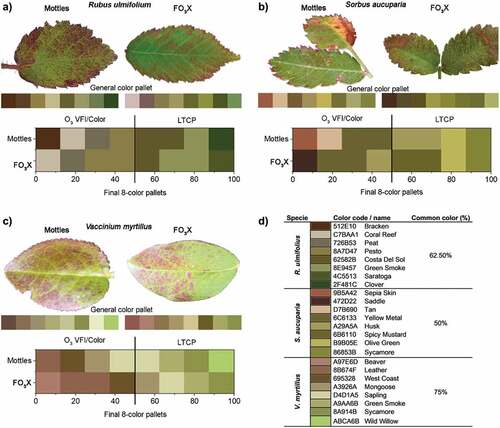
For S. aucuparia, 50% of colors selected in the final 8-color pallets were present in both MOTTLES and FO3X samples (). Considering only the O3 VFI/Color, 25% of the colors were common between the MOTTLES and FO3X sample (Yellow Metal − 6C6133). One O3 VFI/Color was recorded only at the MOTTLES site (Saddle −472D22), whereas two O3 VFI/Color was recorded at the FO3X (Sepia Skin – B5A42, and Tan – D7B690). Furthermore, 75% of the LTCP colors were common between the MOTTLES and FO3X samples.
For V. myrtillus, however, not all the considered O3 VFI in the MOTTLES sites were similar to the FO3X O3 VFI pictures (Fig. S1), 75% of colors selected in the final 8-color pallets were present in both samples (). Considering only the O3 VFI/Color, 75% of the colors were common between the MOTTLES and FO3X samples (Leather − 8B674F, West Coast − 695328 and Mongoose – A3926A). One specific O3 VFI/Color, was not identified at FO3X samples and was recorded only at the MOTTLES site (Beaver – A97E6D). Furthermore, 75% of the LTCP colors were common between the MOTTLES and FO3X samples.
Stomatal ozone uptake for visible injury onset at the FO3X
New stomatal conductance model parameters for species (A. unedo, P. angustifolia, P. halepensis, P. pinaster, P. pinea, R. ulmifolius) are shown in Table S2 and Fig. S2, and the gmax values were dependent on species ranging from 95 (A. unedo) to 165 mmol O3 m−2 PLA s−1 (P. halepensis, and R. ulmifolius). The stomatal light response function (flight) followed a typical light-saturation curve with a saturation point above 1000 µmol m−2 s−1. The gs response to temperature (ftemp) had a bell-shaped curve where gs reached the maximum at the optimal temperature (22–26 °C). The fVPD function indicated that stomatal closure was caused by VPD higher than 1.2 to 1.5 kPa regardless of the species. However, the VPD attaining minimum gs (VPDmin) was relatively low in P. halepensis compared to the other species.
Two representative O3 indices, i.e., POD1 and AOT40, were calculated to find the values corresponding to the onset of the first O3 VFI in the 12 species at the FO3X experiment (). The AOT40 threshold for the onset of O3 VFI was different among the symptomatic species (3.9 to 50.9 ppm h AOT40). The Mediterranean evergreen A. unedo required 50.9 ppm h AOT40 to show the first O3 VFI, while the first O3 VFI appeared on both deciduous A. glutinosa and S. aucuparia from low AOT40 values (3.9 to 6.5 ppm h AOT40). On the other hand, the onset of O3 VFI was observed from 5 mmol m−2 POD1 for A. glutinosa and V. myrtillus, and from 18.1 mmol m−2 POD1 for Q. pubescens.
Table 6. Phytotoxic Ozone Dose (POD1) and accumulated exposure over a threshold of 40 ppb (AOT40) values corresponding to the occurrence of the O3 visible foliar injury (O3 VFI) onset at the Free-air O3 eXposure (FO3X).
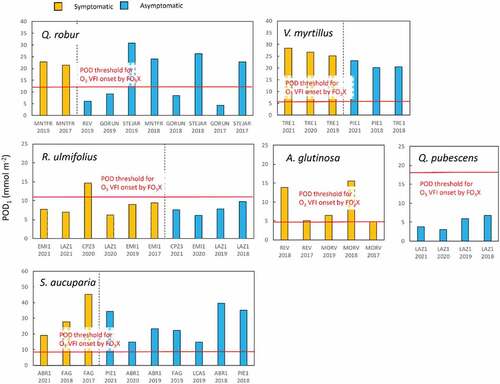
We then applied these FO3X-derived thresholds to the MOTTLES conditions. In theory, O3 VFI should be present when POD1 exceeds the threshold for the onset of O3 VFI, whereas no O3 VFI should be found when POD1 is lower than this threshold. In fact, in the MOTTLES sites, the results were in line with this theory for A. glutinosa and Q. pubescens (). However, plants were often asymptomatic for Q. robur, S. aucuparia and V. myrtillus even though POD1 was higher than this threshold. On the contrary, R. ulmifolius was symptomatic even in most cases when POD1 was lower than the threshold.
Figure 5. Phytotoxic Ozone Dose (POD1) and the presence or absence of ozone visible foliar injury (O3 VFI) for several forest species in Monitoring Ozone injury for seTTtting new critical LevelS (MOTTLES) sites. Both in the plot (ITP) and Light Exposed Sampling Site (LESS) data were considered. Red line shows the POD1 threshold for the onset of O3 VFI obtained from the Free-air O3 eXposure (FO3X) experiments (see Table 6 for a detail).
Discussion
Color analysis and comparisons of the foliar symptoms between FO3X and actual forests
This first attempt to diagnose O3 VFI by comparing actual field and manipulative experimental conditions based on the symptom color composition appeared promising, especially for two species where 75% of the O3 VFI/Color were shared between MOTTLES and FO3X samples. A leaf color chart is defined as a series of color swatches used to identify leaf physiological status and characteristics (Takebe and Yoneyama Citation0000). Color composition in terms of the color chart has been used in several studies, especially to estimate leaf and canopy chlorophyll content and their variation in field conditions (Nguy-Robertson et al. Citation2015) and for adjusting nitrogen (N) fertilization rate, thus improving N management in field conditions on the basis of leaf color.
Comparing the O3 VFI between the field and experimental conditions using the color composition was here demonstrated to be a potential tool for the O3 VFI diagnosis. For the three species compared in the presented study, 50% to 75% of the colors in the final 8-color pallets were commonly present in the field and under manipulative experimental conditions. This indicates that the O3 VFI/Color are similar between field and FO3X conditions, suggesting that it is possible to make successful validation of field-observed O3 symptoms by using manipulative fumigation studies. However, it is important to follow standard procedures for the shooting of pictures used in the image analysis, as lighting conditions and picture resolution may affect the colors. The ICP-forest manual (Schaub et al. Citation2016) listed a series of indications for taking photographs of O3 VFI, that must be followed for the quality assurance.
The O3 VFI provides clear indications of O3-induced oxidative stress and is reliable when verified by a combination of approaches, once the symptoms expression can be similar even when the stress factors are different (Vollenweider and Gunthardtgoerg Citation2006; Guerrero et al. Citation2013; Alves et al. Citation2016; Moura et al. Citation2018; Vollenweider et al. Citation2019). For instance, the adaxial St can appear following several other sources of oxidative stress (Vollenweider and Gunthardtgoerg Citation2006), and Cl is a common symptom that needs careful validation to be diagnosed as O3 VFI (Vollenweider et al. Citation2019). Furthermore, usually observed O3 VFI in field surveys are aspecific and difficult to interpret (Bussotti et al. Citation2006) because leaf colors may also be affected by the plant phenological nutritional and physiological status and other abiotic causes (Bussotti and Ferretti Citation2009). However, it should be noted that such a field-specific O3 VFI/Color was found to be always lower than 25% of color composition.
The successful assessments of O3 VFI are mainly dependent on the observer’s experience, and knowledge and color images such as photo guides of O3 VFI are considered important tools, especially in field conditions where observation is required for several species and a large number of individuals. The validation of O3 VFI is therefore crucial and must be conducted under experimental conditions and using microscopy observation (Vollenweider, Ottiger, and Günthardt-Goerg Citation2003; Bussotti et al. Citation2005, Citation2006; Moura et al. Citation2018) to ascertain an O3 VFI diagnosis by providing a mechanistic understanding of O3 effect (Günthardt-Goerg and Vollenweider Citation2007; Faoro and Iriti Citation2009). However, the new methodology proposed here based on color composition can informatize well-trained observer’s experience and digitalizes their visual information and knowledge of how to identify O3 VFI. For example, the arithmetic manipulation of the RGB color channels has been used to detect a wide variety of plant disease symptoms (Barbedo Citation2017). Although further analyses for the specificity of O3 VFI are still needed, a proper visual information for the O3 VFI can be a simple informatic tool to establish an automated O3 VFI identifier using a RGB image alternative to the traditional method of a time-consuming validation by microscopy, thus improving the assessment and identification of O3 VFI.
Comparison of flux-based threshold for the ozone visible injury onset between the FO3X and actual forests
In the 2000s, several field studies reported that O3 VFI was shown in forest trees when AOT40 reached 10 ppm h (Vollenweider et al. Citation2019; Vanderheyden et al. Citation2001). However, as Vanderheyden et al. (Citation2001) pointed out for forest tree species in Switzerland, the AOT40 threshold showing O3 VFI varied from year to year. In fact, O3 damage is closely related to stomatal O3 uptake rather than O3 exposure only (CLRTAP, Citation2017; Watanabe et al. Citation2021). Therefore, a consensus has increased in the scientific community to recommend the flux-based O3 risk assessment on forest trees (Paoletti et al. Citation2022) suggesting that an equivalent stomatal O3 dose results in a similar O3 damage over various species with a different sensitivity to O3 (Reich Citation1987; Feng et al. Citation2018). In fact, the AOT40-based threshold for the onset of O3 VFI for the O3 resistant evergreen species, A. unedo, was 10-fold higher than that for the O3 sensitive deciduous species, A. glutinosa. Interestingly, the flux-based threshold corresponding to the first symptom onset for A. unedo was rather similar to that for A. glutinosa. In fact, A. unedo, which has a low gmax limiting stomatal O3 uptake, showed O3 VFI only in the autumn season, while A. glutinosa showed O3 VFI in early summer even under ambient O3 conditions because it shows a very high stomatal conductance and stomatal O3 uptake easily exceeds the critical range of O3 dose that can be detoxified.
According to the field observations in MOTTLES sites, Sicard et al. (Citation2020) proposed flux-based thresholds for O3 VFI of 5 and 12 mmol m−2 POD1 in dominant conifers and broadleaved trees, respectively, while 11 mmol m−2 POD1 was required for the presence of O3 VFI in various sensitive tree species present within the LESS (Sicard et al. Citation2021). Although categorizing plant types is useful for setting the critical standard for forest protection, plant responses to O3 are rather species-specific, as confirmed by the high flux-based threshold reported for Pinus halepensis (e.g., 8.2 mmol m−2 POD1) in Southeastern France (Sicard et al. Citation2016). At the FO3X, the flux-based threshold for the O3 VFI onset was ranged from 4.9 to 18.1 mmol m−2 POD1. It seems that the FO3X-derived threshold also explained well the presence of O3 VFI for A. glutinosa and Q. pubescens in the MOTTLES conditions. However, the threshold observed for the injury onset at the FO3X did not often match the presence of O3 VFI in actual forests. The incidence of the VFI was lower for S. aucuparia and V. myrtillus in actual forests compared to the FO3X condition. Indeed, S. aucuparia, and V. myrtillus showed O3 VFI in early summer at FO3X even under AA conditions, while they were not always found symptomatic in actual forests. Also, for the less sensitive species such as Q. robur, very limited O3 VFIs were found under the MOTTLES conditions even though a relatively high POD1 was observed (>20 mmol m−2 POD1). There is a possibility that gs of field plants would be different with that of pot plants. In fact, Beikircher et al. (Citation2021) suggested a lower gs in field-grown mature Acer pseudoplatanus trees than in potted-seedlings. On contrary, Samuelson and Kelly (Citation1997) indicate a greater gs in mature Quercus rubra trees than seedlings. Actually, a site-specific gs parameter may provide a more precise estimation of POD1 in the MOTTLES sites. In addition, in a manipulative experiment, plants are usually potted, well-watered, isolated, and totally exposed to the atmospheric O3 conditions; therefore, the higher incidence of symptoms can be related to the lack of stress compensation by an interaction of leaves within a canopy crown (Löw et al. Citation2006). Otherwise, a complex structure of forests with species mixtures may decrease herbivory, disease and other abiotic stresses, with increasing nutrient supply rates over the long term (Tilman, Isbell, and Cowles Citation2014). Interestingly, according to the multivariate analysis on MOTTLES datasets, O3 VFI decreased with an increasing number of species in the LESS. LESS is a forest edge, and therefore it is generally characterized by a high number of species with different growth forms determining a multi-layered structure (Ranney, Bruner, and Levenson Citation0000; Łuczaj and Sadowska Citation1997). As a vertical O3 gradient can be observed in a forest canopy (Ollinger, Aber, and Reich Citation1997), the presence of nonsensitive species in the upper layer can establish a protective mechanism for more sensitive species in the bottom layer. Such a hypothesis is in line with the assumption that mixed stands are more resilient to environmental stress than monospecific ones (Grossiord et al. Citation2014). Eichhorn et al. (Citation2005) and Pollastrini et al. (Citation2016) identified species diversity as a relevant factor that positively influences the crown conditions (i.e., reduced defoliation) in North European and Mediterranean forests.
Only R. ulmifolius showed the opposite behavior, i.e., it was symptomatic in the field even with a relatively low POD1 below the level in which the VFI was observed at the FO3X. Such differences can be explained by the strong competitive habit of the species for light (Gaudio, Balandier, and Marquier Citation2008). R. ulmifolius shrubs tend to overwhelm other species and, therefore, are more exposed to atmospheric conditions.
Conclusions
The results confirmed that a new generation free-air O3 fumigation facility such as FO3X is an appropriate tool for the validation activities of field-observed O3 VFI. New imaging analysis of color composition for O3 VFI indicates that a major part of the colors were similar between the field and the FO3X. Such digitized information will provide an advancement in the approach for O3 VFI assessment from the bio-informatic point of view such as a mobile application as diagnostic tool for field scientists. A further calibration for estimating O3 VFI by color composition (i.e., differences between O3 VFI and other visible injury, color distribution in the leaves) is recommended for a more extensive range of O3-sensitive species because other abiotic stress factors may sometimes mask the O3 VFI.
The flux-based threshold for the O3 VFI onset at the FO3X was ranged from 4.9 to 18.1 mmol m−2 POD1. Although this FO3X-derived threshold also explained the presence of O3 VFI for A. glutinosa and Q. pubescens under real-world conditions, it did not always match with the observation for the other species. Q. robur, S. aucuparia and V. myrtillus were relatively resistant in actual forests rather than the FO3X experiment, given that they were not visibly affected in the MOTTLES sites even though POD1 exceeded the FO3X-derived threshold. On the other hand, R. ulmifolius exhibited the O3 VFI even at a relatively low POD1. Although the mechanisms are still unknown, the multivariate analysis indicated an interaction of the presence of various species on O3 VFI and suggested the importance of biodiversity and continuous monitoring activities in the field.
European forests are considerable areas of the world terrestrial biodiversity. In MOTTLES, we investigated 23 tree species. The ozone FACE (Free Air Controlled Exposure) experiments need to be expanded to more species to realize a proper and representative assessment of forest health under O3 pollution.
Acknowledgments
We are grateful for financial support to the Fondazione Cassa di Risparmio di Firenze (2013/7956), the LIFE projects MOTTLES (LIFE15 ENV/IT/000183) and MODERn (NEC) (LIFE20 GIE/IT/000091), and the CNR project OzonPlant - Relazioni tra piante e inquinamento da ozono (DTA.AD002.640) and 4ClimAir (SAC.AD002.173.019).
Disclosure statement
No potential conflict of interest was reported by the author(s).
Additional information
Funding
References
- Alves, E. S., B. B. Moura, A. N. V. Pedroso, F. Tresmondi, and S. R. Machado. 2016. “Cellular Markers Indicative of Ozone Stress on Bioindicator Plants Growing in a Tropical Environment.” Ecological Indicators 67: 1–15. doi:10.1016/j.ecolind.2016.03.011.
- Barbedo, J. G. A. 2017. “A New Automatic Method for Disease Symptom Segmentation in Digital Photographs of Plant Leaves.” European Journal of Plant Pathology 147 (2): 349–364. doi:10.1007/s10658-016-1007-6.
- Barton, D. N., S. Kuikka, O. Varis, L. Uusitalo, H. J. Henriksen, M. Borsuk, A. D. L. Hera, R. Farmani, S. Johnson, and J. D. C. Linnell. 2012. “Bayesian Networks in Environmental and Resource Management.” Integrated Environmental Assessment and Management 8 (3): 418–429. doi:10.1002/ieam.1327.
- Beikircher, B., L. Sack, A. Ganthaler, A. Losso, and S. Mayr. 2021. “Hydraulic-Stomatal Coordination in Tree Seedlings: Tight Correlation Across Environments and Ontogeny in Acer Pseudoplatanus.” The New Phytologist 232: 1297–1310. doi:10.1111/nph.17585.
- Bičárová, S., Z. Sitková, H. Pavlendová, P. Bytnerowicz, P. Fleischer, and A. Fleischer. 2019. “The Role of Environmental Factors in Ozone Uptake of Pinus Mugo Turra.” Atmospheric Pollution Research 10 (1): 283–293. doi:10.1016/j.apr.2018.08.003.
- Büker, P., Z. Feng, J. Uddling, A. Briolat, R. Alonso, S. Braun, S. Elvira, et al. 2015. ”New Flux Based Dose–Response Relationships for Ozone for European Forest Tree Species.” Environmental Pollution 206: 163–174. doi:10.1016/j.envpol.2015.06.033.
- Bussotti, F., G. Agati, R. Desotgiu, P. Matteini, and C. Tani. 2005. “Ozone Foliar Symptoms in Woody Plant Species Assessed with Ultrastructural and Fluorescence Analysis.” The New Phytologist 166 (3): 941–955. doi:10.1111/j.1469-8137.2005.01385.x.
- Bussotti, F., and M. Ferretti. 2009. “Visible Injury, Crown Condition, and Growth Responses of Selected Italian Forests in Relation to Ozone Exposure.” Environmental Pollution 157 (5): 1427–1437. doi:10.1016/j.envpol.2008.09.034.
- Bussotti, F., M. Schaub, A. Cozzi, G. Gerosa, K. Novak, and C. Hug. 2006. “Sources of Errors in Assessing Ozone Visible Symptoms on Native Vegetation.” Environmental Pollution 140 (2): 257–268. doi:10.1016/j.envpol.2005.07.012.
- Bussotti, F., M. Schaub, A. Cozzi, K. Krauchi, M. Ferretti, K. Novak, and J. M. Skelly. 2003. “Assessment of Ozone Visible Symptoms in the Field: Perspectives of Quality Control.” Environmental Pollution 125 (1): 81–89. doi:10.1016/S0269-7491(03)00095-2.
- Calatayud, V., F. Marco, J. Cerveró, G. Sánchez-Peña, and M. J. Sanz. 2010. “Contrasting Ozone Sensitivity in Related Evergreen and Deciduous Shrubs.” Environmental Pollution 158 (12): 3580–3587. doi:10.1016/j.envpol.2010.08.013.
- CLRTAP. 2017. Mapping Critical Levels for Vegetation, Chapter III. Manual on Methodologies and Criteria for Modelling and Mapping Critical Loads and Levels and Air Pollution Effects, Risks and Trends. In UNECE Convention on Long-Range Transboundary Air Pollution. Geneva, Switzerland: UNECE.
- Dalstein, L., N. Vas, F. Tagliaferro, A. Ferrara, and F. Spaziani. 2005. “Effets de L’ozone Sur la Forêt Et la Végétation Dans Les Alpes Franco-Italiennes.” Forêt Méditerranéenne, Forêt Méditerranéenne XXVI (2): 149–156.
- de Marco, A., C. Proietti, A. Anav, L. Ciancarella, I. D’Elia, S. Fares, M. F. Fornasier, et al. 2019. ”Impacts of Air Pollution on Human and Ecosystem Health, and Implications for the National Emission Ceilings Directive: Insights from Italy.” Environment International 125: 320–333. doi:10.1016/j.envint.2019.01.064.
- Eichhorn, J., R. Icke, A. Isenberg, U. Paar, and E. Schönfelder. 2005. “Temporal Development of Crown Condition of Beech and Oak as a Response Variable for Integrated Evaluations.” European Journal of Forest Research 124 (4): 335–347. doi:10.1007/s10342-005-0097-z.
- Elvira, S., E. Bermejo, E. Manrique, and B. S. Gimeno. 2004. “On the Response of Two Populations of Quercus Coccifera to Ozone and Its Relationship with Ozone Uptake.“ Atmospheric Environment 38 (15): 2305–2311.
- European Parliament and Council DIRECTIVE (EU) 2016/2284 on the Reduction of National Emissions of Certain Atmospheric Pollutants. Official Journal of the European Union. 2016.344. https://eur-lex.europa.eu/legal-content/EN/TXT/?uri=CELEX%3A52020DC0266
- Faoro, F., and M. Iriti. 2009. “Plant Cell Death and Cellular Alterations Induced by Ozone: Key Studies in Mediterranean Conditions.” Environmental Pollution 157 (5): 1470–1477. doi:10.1016/j.envpol.2008.09.026.
- Feng, Z., P. Büker, H. Pleijel, L. Emberson, P. E. Karlsson, and J. Uddling. 2018. “A Unifying Explanation for Variation in Ozone Sensitivity Among Woody Plants.” Global Change Biology 24 (1): 78–84. doi:10.1111/gcb.13824.
- Feng, Z., J. Sun, W. Wan, E. Hu, and V. Calatayud. 2014. “Evidence of Widespread Ozone-Induced Visible Injury on Plants in Beijing, China.” Environmental Pollution 193: 296–301. doi:10.1016/j.envpol.2014.06.004.
- Gaudio, N., P. Balandier, and A. Marquier. 2008. “Croissance de Deux Espèces Compétitrices (Rubus Idaeus, Cytisus Scoparius) Colonisatrices des Trouées En Forêt Tempérée Selon la Disponibilité En Lumière.” Annals of Forest Science 65 (1): 104. doi:10.1051/forest:2007076.
- Grossiord, C., A. Granier, S. Ratcliffe, O. Bouriaud, H. Bruelheide, E. Chećko, D. I. Forrester, et al. 2014. ”Tree Diversity Does Not Always Improve Resistance of Forest Ecosystems to Drought.” Proceedings of the National Academy of Sciences 111 (41): 14812–14815. doi:10.1073/pnas.1411970111.
- Guerrero, C. C., M. S. Günthardt-Goerg, P. Vollenweider, and D. Ballhorn. 2013. “Foliar Symptoms Triggered by Ozone Stress in Irrigated Holm Oaks from the City of Madrid, Spain.” PLoS One 8 (7): e69171. doi:10.1371/journal.pone.0069171.
- Günthardt-Goerg, M. S., and P. Vollenweider. 2007. “Linking Stress with Macroscopic and Microscopic Leaf Response in Trees: New Diagnostic Perspectives.” Environmental Pollution 147 (3): 467–488. doi:10.1016/j.envpol.2006.08.033.
- Hoshika, Y., E. Carrari, B. Mariotti, S. Martini, A. D. Marco, P. Sicard, and E. Paoletti. 2020. “Flux-Based Ozone Risk Assessment for a Plant Injury Index (Pii) in Three European Cool-Temperate Deciduous Tree Species.” Forests 11 (1): 82. doi:10.3390/f11010082.
- Hoshika, Y., E. Carrari, L. Zhang, G. Carriero, S. Pignatelli, G. Fasano, A. Materassi, and E. Paoletti. 2018. “Testing a Ratio of Photosynthesis to O3 Uptake as an Index for Assessing O3-Induced Foliar Visible Injury in Poplar Trees.” Environmental Science and Pollution Research 25: 8113–8124. doi:10.1007/s11356-017-9475-6.
- Hoshika, Y., E. Paoletti, E. Agathokleous, T. Sugai, and T. Koike. 2020. “Developing Ozone Risk Assessment for Larch Species.” Frontiers in Forests and Global Change 3. doi:10.3389/ffgc.2020.00045.
- Hoshika, Y., E. Paoletti, and K. Omasa. 2012. “Parameterization of Zelkova Serrata Stomatal Conductance Model to Estimate Stomatal Ozone Uptake in Japan.” Atmospheric Environment 55: 271–278. doi:10.1016/j.atmosenv.2012.02.083.
- Hoshika, Y., F. Pecori, I. Conese, T. Bardelli, E. Marchi, W. J. Manning, O. Badea, and E. Paoletti. 2013. “Effects of a Three-Year Exposure to Ambient Ozone on Biomass Allocation in Poplar Using Ethylenediurea.” Environmental Pollution 180: 299–303. doi:10.1016/j.envpol.2013.05.041.
- Innes, J. L., J. M. Skelly, and M. Schaub. 2001. “Ozone and Broadleaved Species: A Guide to the Identification of Ozone-Induced Foliar Injury/Ozon.” In Laubholz- Und Krautpflanzen: Ein Fuhrer Zum Bestimmen von Ozonsymptomen;Birmensdorf, Eidgenossische Forschungsan- Stalt WSL Haupt, 136. Bern, Stuttgart, Wien: Haupt (January 1, 2001) .
- Lefohn, A. S., C. S. Malley, L. Smith, B. Wells, M. Hazucha, H. Simon, V. Naik, et al. 2018. ”Tropospheric Ozone Assessment Report: Global Ozone Metrics for Climate Change, Human Health, and Crop/Ecosystem Research.”Elementa: Science of the Anthropocene 6.doi:10.1525/elementa.279.
- Löw, M., K. Herbinger, A. J. Nunn, K. H. Häberle, M. Leuchner, C. Heerdt, H. Werner, et al. 2006. ”Extraordinary Drought of 2003 Overrules Ozone Impact on Adult Beech Trees (Fagus Sylvatica).” Trees - Structure and Function 20 (5): 539–548. doi:10.1007/s00468-006-0069-z.
- Łuczaj, Ł., and B. Sadowska. 1997. “Edge Effect in Different Groups of Organisms: Vascular Plant, Bryophyte and Fungi Species Richness Across a Forest-Grassland Border.” Folia Geobotanica Et Phytotaxonomica 32 (4): 343–353. doi:10.1007/bf02821940.
- Moura, B. B., E. S. Alves, M. A. Marabesi, S. R. de Souza, M. Schaub, and P. Vollenweider. 2018. “Ozone Affects Leaf Physiology and Causes Injury to Foliage of Native Tree Species from the Tropical Atlantic Forest of Southern Brazil.” The Science of the Total Environment 610–611: 912–925. doi:10.1016/j.scitotenv.2017.08.130.
- Nguy-Robertson, A., Y. Peng, T. Arkebauer, D. Scoby, J. Schepers, and A. Gitelson. 2015. “Using a Simple Leaf Color Chart to Estimate Leaf and Canopy Chlorophyll a Content in Maize (Zea Mays).” Communications in Soil Science and Plant Analysis 46 (21): 2734–2745. doi:10.1080/00103624.2015.1093639.
- Nussbaum, S., and J. Fuhrer. 2000. “Difference in Ozone Uptake in Grassland Species Between Open-Top Chambers and Ambient Air.“ Environmental Pollution 19 (3): 463–471.
- Ollinger, S. V., J. D. Aber, and P. B. Reich. 1997. “Simulating Ozone Effects on Forest Productivity: Interactions Among Leaf-, Canopy-, and Stand-Level Processes.” Ecological Applications 7 (4): 1237–1251. doi:10.1890/1051-0761(1997)007[1237:SOEOFP]2.0.CO;2.
- Paoletti, E., A. Alivernini, A. Anav, O. Badea, E. Carrari, S. Chivulescu, A. Conte, et al. 2019. ”Toward Stomatal–Flux Based Forest Protection Against Ozone: The MOTTLES Approach.” The Science of the Total Environment 691: 516–527. doi:10.1016/j.scitotenv.2019.06.525.
- Paoletti, E., G. Carriero, G. Fasano, Y. Hoshika, G. Carriero, D. Silaghi, and O. Badea. 2017. “A New-Generation 3D Ozone FACE (Free Air Controlled Exposure). Science of the Total Environment.” The Science of the Total Environment 2016: 21–25. doi:10.1016/j.scitotenv.2016.09.217.
- Paoletti, E., M. Schaub, R. Matyssek, G. Wieser, A. Augustaitis, A. M. Bastrup-Birk, A. Bytnerowicz, M. S. Günthardt-Goerg, G. Müller-Starck, and Y. Serengil. 2010. “Advances of Air Pollution Science: From Forest Decline to Multiple-Stress Effects on Forest Ecosystem Services.” Environmental Pollution 158 (6): 1986–1989. doi:10.1016/j.envpol.2009.11.023.
- Paoletti, E., P. Sicard, Y. Hoshika, S. Fares, O. Badea, D. Pitar, I. Popa, A. Anav, B. B. Moura, and A. de Marco. 2022. “Towards Long-Term Sustainability of Stomatal Ozone Flux Monitoring at Forest Sites.” Sustainable Horizons 2: 100018. doi:10.1016/j.horiz.2022.100018.
- Pollastrini, M., M. Feducci, D. Bonal, M. Fotelli, A. Gessler, C. Grossiord, V. Guyot, et al. 2016. ”Physiological Significance of Forest Tree Defoliation: Results from a Survey in a Mixed Forest in Tuscany (Central Italy).” Forest Ecology and Management 361: 170–178. doi:10.1016/j.foreco.2015.11.018.
- Ranney, J. W., M. C. Bruner, and J. B. Levenson.The Importance of Edge in the Structure and Dynamics of Forest Islands. Forest Island Dynamics in Man-Dominated Landscapes 1981.10.1007/978-1-4612-5936-7_6
- R Core Team. 2018. A Language and Environment for Statistical Computing. Vienna, Austria: R Foundation for Statistical Computing. https://cran.r-project.org/doc/FAQ/R-FAQ.html#Citing-R
- Reich, P. B. 1987. “Quantifying Plant Response to Ozone: A Unifying Theory.” Tree Physiology 3: 63–91. doi:10.1093/treephys/3.1.63.
- Samuelson, L. J., and J. M. Kelly. 1997. “Ozone Uptake in Prunus Serotina, Acer Rubrum and Quercus Rubra Forest Trees of Different Sizes.” The New Phytologist 136: 255–264. doi:10.1046/j.1469-8137.1997.00734.x.
- Schaub, M., and V. Calatayud. 2013. “Assessment of Visible Foliar Injury Induced by Ozone.” Developments in Environmental Science 12: 205–221.
- Schaub, M., V. Calatayud, M. Ferretti, G. Brunialti, G. Lövblad, G. S. M. Krause, and M. J., Sanz. 2016. “Part VIII: Monitoring of Ozone Injury.“ In Manual on Methods and Criteria for Harmonized Sampling, Assessment, Monitoring and Analysis of the Effects of Air Pollution on Forests; UNECE ICP Forests Programme Coordinating Centre, ed. UNECE ICP Forests Programme Coordinating Centre, 14. Eberswalde, Germany: Thünen Institute of Forest Ecosystems.
- Sicard, P., A. de Marco, E. Carrari, L. Dalstein-Richier, Y. Hoshika, O. Badea, D. Pitar, et al. 2020. ”Epidemiological Derivation of Flux-Based Critical Levels for Visible Ozone Injury in European Forests.” Journal of Forestry Research 31 (5): 1509–1519. doi:10.1007/s11676-020-01191-x.
- Sicard, P., A. de Marco, L. Dalstein-Richier, F. Tagliaferro, C. Renou, and E. Paoletti. 2016. “An Epidemiological Assessment of Stomatal Ozone Flux-Based Critical Levels for Visible Ozone Injury in Southern European Forests.” The Science of the Total Environment 541. doi:10.1016/j.scitotenv.2015.09.113.
- Sicard, P., Y. Hoshika, E. Carrari, A. de Marco, and E. Paoletti. 2021. “Testing Visible Ozone Injury Within a Light Exposed Sampling Site as a Proxy for Ozone Risk Assessment for European Forests.” Journal of Forestry Research 32 (4): 1351–1359. doi:10.1007/s11676-021-01327-7.
- Takebe, M., and T. Yoneyama Measurement of Leaf Color Scores and Its Implication to Nitrogen Nutrition of Rice Plants;
- Tilman, D., F. Isbell, and J. M. Cowles. 2014. “Biodiversity and Ecosystem Functioning.” Annual Review of Ecology, Evolution, and Systematics 45: 471–493. doi:10.1146/annurev-ecolsys-120213-091917.
- Vanderheyden, D., J. Skelly, J. Innes, C. Hug, J. Zhang, W. Landolt, and P. Bleuler. 2001. “Ozone Exposure Thresholds and Foliar Injury on Forest Plants in Switzerland.” Environmental Pollution 111 (2): 321–331. doi:10.1016/S0269-7491(00)00060-9.
- Vollenweider, P., and M. Gunthardtgoerg. 2006. “Erratum to “Diagnosis of Abiotic and Biotic Stress Factors Using the Visible Symptoms in Foliage” [Environ. Pollut. 137 (2005) 455–465].” Environmental Pollution 140 (140): 562–571. doi:10.1016/j.envpol.2006.01.002.
- Vollenweider, P., M. S. Günthardt-Goerg, T. Menard, M. Baumgarten, R. Matyssek, and M. Schaub. 2019. “Macro- and Microscopic Leaf Injury Triggered by Ozone Stress in Beech Foliage (Fagus Sylvatica L.).” Annals of Forest Science 76 (3). doi:10.1007/s13595-019-0856-5.
- Vollenweider, P., M. Ottiger, and M. S. Günthardt-Goerg. 2003. “Validation of Leaf Ozone Symptoms in Natural Vegetation Using Microscopical Methods.” Environmental Pollution 124 (1): 101–118. doi:10.1016/S0269-7491(02)00412-8.
- Watanabe, M., E. Agathokleous, A. Anav, V. Araminiene, E. Carrari, A. De Marco, Y. Hoshika, C. Proietti, P. Sicard, and E. Paoletti. ”Impacts of Ozone on the Ecophysiology of Forest Tree Species.” In Tropospheric Ozone -A Hazard for Vegetation and Human Health, edited by S. B. Agrawal, M. Agrawal, A. Singh, S. B. Agrawal, M. Agrawal, and A. Singh 277–306. Newcastle, UK: Publishing, Cambridge Scholars. 2021.