
 ?Mathematical formulae have been encoded as MathML and are displayed in this HTML version using MathJax in order to improve their display. Uncheck the box to turn MathJax off. This feature requires Javascript. Click on a formula to zoom.
ABSTRACT
Adipogenic differentiation and thermogenesis in brown adipose tissue (BAT) undergo dynamic processes, altering phenotypes and gene expressions. Proper reference genes in gene expression analysis are crucial to mitigate experimental variances and ensure PCR efficacy. Unreliable reference genes can lead to erroneous gene expression quantification, resulting in data misinterpretation. This study focused on identifying suitable reference genes for mouse brown adipocyte research, utilizing brown adipocytes from the Ucp1-luciferase ThermoMouse model. Comparative analysis of gene expression data under adipogenesis and thermogenesis conditions was conducted, validating 13 housekeeping genes through various algorithms, including DeltaCq, BestKeeper, geNorm, Normfinder, and RefFinder. Tbp and Rer1 emerged as optimal references for Ucp1 and Pparg expression in brown adipogenesis, while Tbp and Ubc were ideal for the expression analysis of these target genes in thermogenesis. Conversely, certain conventional references, including Actb, Tubb5, and Gapdh, proved unstable as reference genes under both conditions. These findings stress the critical consideration of reference gene selection in gene expression analysis within specific biological systems to ensure accurate conclusions.
1. Introduction
Brown adipose tissue (BAT) primarily maintains body temperature by generating heat through cold-induced or non-shivering thermogenesis [Citation1,Citation2]. In recent decades, many researchers have focused more on thermogenesis in BAT as it has the potential to enhance energy expenditure, promote the burning of stored fat, and uncover new targets for anti-obesity interventions [Citation3–6]. In BAT, thermogenesis is primarily associated with the activity of uncoupling protein 1 (UCP1), a hallmark protein expressed on the inner mitochondrial membrane of brown adipocytes [Citation7,Citation8]. Many cell and animal models have been developed to study the functions of UCP1 and its modulators. In particular, Ucp1-luciferase ThermoMouse, a valuable mouse model, greatly facilitates BAT-related studies on adipogenesis, energy consumption, and thermogenesis [Citation9]. This genetically modified mouse model expresses a luciferase gene under the control of the Ucp1 gene promoter, enabling researchers to visualize and quantify Ucp1 expression in real time, either in vivo or in vitro [Citation9]. Therefore, this mouse model can be effectively utilized for preclinical screening studies and other biological approaches related to adipogenesis and thermogenesis.
UCP1 proteins residing in the mitochondrial inner membrane uncouple the proton gradient potentials used for ATP synthesis in brown adipocytes, leading to an increase in oxygen consumption and heat production, instead of ATP energy [Citation10,Citation11]. In addition to its primary function of UCP1 in thermogenesis, it is also critically associated with browning and adipocyte differentiation, characterized by significant changes in cell morphology and gene expression [Citation12,Citation13]. Additionally, some key transcription factors, including peroxisome proliferator-activated receptor gamma (PPARG) and CCAAT/enhancer-binding protein alpha (CEBPA), play essential roles in adipogenesis [Citation14–16]. These transcription factors induce the expression of numerous genes and trigger distinct morphological and genomic alterations during adipogenesis. In particular, they regulate the formation of lipid droplets and mitochondrial content in differentiated brown adipocytes [Citation10,Citation17].
In gene expression analysis, normalization of mRNA data is of significant importance. This enables a meaningful comparison of mRNA expression levels across various experiments and under different conditions. Several techniques are commonly employed for this normalization, including utilization of internal reference genes (often known as housekeeping genes), total RNA globalization, percentile normalization, and various statistical approaches [Citation18]. The choice of the most suitable method depends on factors such as experimental design, data distribution, and specific goals of the analysis. When utilizing the housekeeping gene method, the relative expression levels of specific genes are typically assessed by comparing them to a reference gene that remains constitutively expressed in cells, thereby providing a valuable biological reference marker. Therefore, using an appropriate reference gene for gene expression studies is critical for defining the cellular or functional characteristics of biological processes. Several cellular housekeeping genes such as Gapdh, Actb, and Tubb5, consistently expressed inside cells, are widely used as reference genes for expression studies. Nevertheless, it is worth noting that the expression levels of these housekeeping genes can be subject to conditional regulation, resulting in significant variations that depend on factors such as cell type, tissue, developmental stage, and metabolic conditions [Citation19–23]. Unreliable reference genes can mislead the quantification of gene expression, resulting in misinterpretation of data and inaccurate conclusions. Thus, it is crucial to identify suitable housekeeping genes for the development and differentiation of adipose tissue, particularly in the presence of specific experimental variations.
In this study, we evaluated and identified appropriate reference genes for gene expression analysis during brown adipogenesis using two experimental panels: Adipogenesis and Thermogenesis. We selected 13 reference genes (Actb, B2m, Gapdh, Gusb, Hprt, Pgk1, Rer1, Rpl113a, Rps18, Tbp, Tubb5, Ubc, and Sdha) based on their various cellular functions and evaluated their expression stability using several statistical algorithms. Finally, we identified some suitable genes, such as Tbp, Rer1, Ubc which were stably expressed in brown adipogenesis and thermogenesis, and validated their impact on the relative expression of target genes.
2. Results
2.1. Adipogenesis and thermogenesis using the immortalized stromal vascular fraction (SVF) preadipocytes.
We first isolated preadipocytes from the interscapular BAT of 3-week-old male Ucp1- luciferase transgenic mice and immortalized brown preadipocytes as described previously [Citation9]. For brown adipogenesis, immortalized preadipocytes were treated with a specific differentiation medium according to the protocol shown in . Intracellular lipid droplets began to appear in the cytoplasm on day 4 after induction of differentiation, and they were fully accumulated inside cells on day 8, suggesting that brown adipocytes were successfully induced under these conditions (). Indeed, based on the quantitative analysis with Oil Red O staining, the intracellular triacylglyceride content of fully differentiated cells (Day 8) was significantly increased compared to that of uninduced cells (Day 0) (), indicating that these immortalized preadipocytes were successfully differentiated into brown adipocytes.
Figure 1. Brown adipocyte differentiation. (a) Induction scheme of brown adipocyte differentiation in vitro from immortalized brown preadipocytes. The details of differentiation process were described under ‘materials and methods’. Created by Biorender.com. (b) Phase-contrast images of cells at day − 2, day 0, day 4, and day 8 during the differentiation process. bar: 50 µm (c) phase-contrast and oil-red-O staining images at pre- adipocytes (day 0) and mature adipocytes (day 8). bar: 100 µm (d) quantification of the relative oil-red-O absorbance between mature adipocytes and preadipocytes. (e) Norepinephrine-induced UCP1 activity on mature adipocytes. Mature adipocytes (day 8) containing Ucp1-luc were incubated with DMSO for control and norepinephrine (1 µM) for 24 hours. The luciferase activity was determined by the method described in materials and methods section. ctr: control; Nore: norepinephrine. * p < 0.05, **** p < 0.0001.
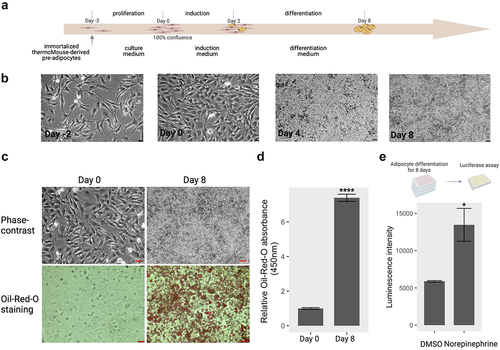
Norepinephrine (NE), a common thermogenic agent, plays an important role in initiating and maintaining cold-induced non-shivering thermogenesis through the activation of UCP1 in brown adipocytes in vitro [Citation24–26]. We tested the luciferase activity of mature brown Ucp-luc1 adipocytes differentiated for eight days with treatment 1.0 µM NE for 24 h. The luciferase activity in the brown adipocytes responding to NE was significantly upregulated compared to that in non-treated control adipocytes (), indicating the successful induction of thermogenesis in mature brown adipocytes with NE treatment.
2.2. The q-PCR gene expression analysis of putative reference genes
Based on previous studies, we selected 13 genes with diverse roles in cellular processes. These genes are constitutively and stably expressed in cells. Actb (beta-actin) and Tubb5 (tubulin beta-5 chain) are involved in cellular structural maintenance. Gapdh (glyceraldehyde-3-phosphate dehydrogenase), Sdha (succinate dehydrogenase complex), and Pgk1 (phosphoglycerate kinase 1), play key roles in metabolism and energy production. Rer1 (retention in endoplasmic reticulum 1), Rpl13a and Rps18 (ribosomal proteins) are responsible for protein synthesis. The Tbp (TATA box-binding protein) gene is essential for transcription initiation and regulation of gene expression. Additionally, B2m (Beta-2-microglobulin), Gusb (glucuronidase beta), Hprt (hypoxanthine phosphoribosyltransferase), and Ubc (ubiquitin C) genes are involved in cellular homoeostasis. These genes were categorized based on their functional annotations from the Reference Sequence (RefSeq) database at NCBI [Citation27], and their primer sequences for amplification and other information are described in . Primer pairs for the candidate genes were designed using the NCBI Primer-BLAST tool [Citation28].
Table 1. Summary of a pair of primers for 13 reference genes and two target genes.
To assess RT-qPCR efficiency, we first performed standard curve analysis on brown adipocytes using day 4 samples (adipocytes on the fourth day after induction of adipogenesis). According to a previous study, this method can assist in avoiding practical and theoretical issues associated with PCR efficiency according to a previous study [Citation29]. RT-qPCR reactions were performed in 10-fold serial dilutions of 500 ng cDNA samples obtained from day 4-adipocytes. All PCR reactions exhibited only one single peak for each target gene in the melting curve analysis, suggesting that target-specific amplification resulted in a single and pure amplicon (Figure S1). The PCR efficiency (E) and coefficient of determination (R2) of the target gene primer pairs were determined using the slope of the standard curves (Figure S2). Based on these analyses, all RT-qPCR reactions showed an acceptable value of E (%) and R2, ranging from 80.05 to 97.68 for the efficiency percentage, with associated R2 values of approximately 0.99 (). These results clearly confirm that the efficiency and specificity of the target gene primer sets used for RT-qPCR amplification in this study were reliable.
Table 2. The PCR amplification efficiency of reference and target genes.
2.3. Evaluation of the expression stability of reference gene
To evaluate the expression stability of 13 reference genes in brown adipocytes, we used two experimental models: Adipogenesis and Thermogenesis. For adipogenesis, total RNAs was collected from brown adipocytes on days 0, 2, 4, and 8 of the differentiation process, as shown in . For thermogenesis, cells on day 0 or day 8 were treated with norepinephrine or DMSO for 24 h to measure the thermogenic effects before total RNAs collection. The candidate reference genes exhibited diverse expression levels in both models, as evident from the the original Ct values obtained through RT-qPCR assays across all experimental conditions (Table S1 and Figure S3). Most candidate genes had mean Ct values between 15 ~ 23. Regardless of the experimental panels, Gapdh showed higher Ct values between 28 ~ 30, indicating its lowest expression in the cells. In addition, Sdha and Pgk1 exhibited the highest Ct variations during both adipogenesis and thermogenesis (Table S1).
Next, the gene expression data were subjected to gene stability analysis using four different algorithms (Delta CT, BestKeeper, NormFinder, and GeNorm) integrated with a web-based comprehensive tool, RefFinder.com. The expression stability of each gene was calculated using the original Ct values derived from the two primary models, namely adipogenesis and thermogenesis. The overall stability score of the candidate reference genes was determined by employing the geometric mean rankings from all algorithm scores [Citation30]. The delta CT algorithm was used to compare the differences in Ct values among the reference genes. The average standard deviation (SD) of Ct values for each gene revealed the gene stability score. This indicates that low SD values are more stable [Citation31]. Based on the Delta CT algorithm analysis, Tbp exhibited the lowest average SD value (0.78 in the adipogenesis panel, suggesting that it is a most-like reference gene, as shown in . Interestingly, Rer1 with a mean SD of 0.78, was found to be the most suitable reference gene in the thermogenesis panel. In addition, this gene was identified as one of the best reference candidates for adipogenesis (). On the contrary, the Delta CT algorithm analysis showed that Sdha was the least consistent on both panels with an average SD of 1.68 and 1.97 ().
Figure 2. Stability scores and ranking of 13 candidate housekeeping genes in the adipogenesis and thermogenesis panel. (a,b) Stability scores from Delta CT algorithms; (c,d) Stability scores from BestKeeper algorithms; (e,f) Stability scores from NormFinder algorithms; (g,h) Stability scores from GeNorm algorithms at an adipogenesis (left) or thermogenesis (right) panel, respectively. For the adipogenesis panel, cells were collected at day 0, day 2, day 4, and day 8 during adipocyte differentiation. For the thermogenesis panel, cells at day 0 and day 8 were treated with norepinephrine (1 µM) or DMSO and incubated for 24 hours. All experiments were performed at three biological replications. The mRNA expression of reference genes underwent examination through RT-qPCR and the RefFinder tool was utilized for calculating stability scores. Original Ct values, including biological replications, from all time points in adipogenesis condition or all treatments in thermogenesis were inputted into the RefFinder tool for analysis. The stability score of individual candidate gene, determined by each algorithm, was displayed as bar-graphs. Lower (left) and higher (right) scores indicate more and less stable genes, respectively.
Similar to Delta CT, the standard deviation of Ct values was used to rank the reference genes for BestKeeper algorithm analysis. Additionally, we determined the Pearson correlation coefficient (r) between reference genes using this algorithm to evaluate their co-regulation. The genes with the lowest SD value and highest r-value were considered to be the most stable, while genes with SD < 1 were believed to be inconsistent [Citation32]. Based on these criteria, Tbp (SD = 0.12, r = 0.144) and Rer1 (SD = 0.27, r = 0.528) were the most stable genes in the adipogenesis panel, whereas Ubc (SD = 0.14, r = 0.348), Tbp (SD = 0.18, r = 0.247), and Rer1 (SD = 0.18, r = 0.907) were ranked as the most stable genes in the thermogenesis panel. In contrast, Sdha (SD = 1.36) in the adipogenesis panel and Sdha (SD = 1.66), Actb (SD = 1.52), Gusb (SD = 1.2), Pgk1 (SD = 1.09), and Tubb5 (1.08) in the thermogenesis panel exhibited SD > 1, which belong to the least stable genes (Tables S2 and S3) ().
The NormFinder algorithm was used to determine the stability value (ρ) based on the intra- and inter-group variations in candidate reference genes. This algorithm considers both the variation between subgroups and overall variation. As a result, reference genes with lower ρ values, especially ρ < 0.25, indicate greater stability [Citation33]. We found that Tbp (ρ = 0.2) and Rer1 (ρ = 0.21) were the most suitable genes for the adipogenesis panel. In contrast, Actb (ρ = 1.14), Gapdh (ρ = 1.15), and Sdha (ρ = 1.6) are unlikely to meet these criteria. In the thermogenesis panel, a group of genes, including Rps18, Tbp, Ubc, Rer1, and Rpl13a exhibited a ρ value of 0.06, suggesting that they are stable reference genes. Actb (ρ = 1.66) and Sdha (ρ = 1.95) were at the bottom of the stability value ().
Finally, we determined the stability values (M) of the reference genes using the GeNorm algorithm. They represent the average pairwise variation of a specific control gene with all the other reference genes. That is, the algorithm can identify a combination of two ideal reference genes that are constitutively and stably expressed under experimental conditions. Genes with a lower than 0.5 M value generally indicate less variation and greater stability in the gene expression of samples [Citation34]. In the adipogenesis panel, the M value between Rpl13a and Ubc was 0.22, indicating that they were an ideal pair of reference genes. In addition, Rer1 (M = 0.27), Tbp (M = 0.37), Rps18 (M = 0.42), and B2m (M = 0.44) exhibited M values lower than 0.5. In contrast, Gapdh (M = 0.92) and Sdha (M = 1.04) were the least stable genes (). Interestingly, Tbp and Ubc (M = 0.12) were the most stably expressed genes in the thermogenesis panel, whereas the two least stably expressed genes were Actb (M = 0.98) and Sdha (M = 1.13). Other genes, including Rer1 (M = 0.23), Rpl13a (M = 0.25), B2m (M = 0.26), Rps18 (M = 0.27), Hprt (M = 0.38), and Gapdh (M = 0.48), showed a suitable M value, indicating that these genes are stably expressed under thermogenic conditions with less variation.
2.4. Overall ranking of the candidate reference genes
Next, we applied the RefFinder algorithm to integrate the outputs of Delta CT, Best-Keeper, NormFinder, and GeNorm, and ultimately determine the geometric mean of ranking (GMR), which consequently provides the final evaluation and comprehensive ranking of candidate genes. Lower GMR values indicated more stable gene expression, as suggested previously [Citation30]. In the adipogenesis panel, Tbp showed the lowest GMR value (1.41), followed by Rer1 (GMR = 2.21) (). These two genes are the most suitable reference candidates for gene expression analysis during adipogenesis. Some other reference genes, including Rpl13a, Rps18, and Ubc were also reliable, whereas the Sdha gene with a GMR value of 13 was the least stable reference gene in the adipogenesis panel. Interestingly, the Tbp gene also exhibited the lowest value of GMR (1.19) in the thermogenesis panel, followed by Ubc (GMR = 1.41) (). Similarly, the Sdha (GMR = 12) gene together with Tubb5 (GMR = 13) were ranked as the least stable genes under these conditions. The gene stability ranking results obtained from the four algorithm-based analyses and a comprehensive RefFinder in adipogenesis and thermogenesis are summarized in and , respectively.
Figure 3. Geometric mean of rankings (GMR) from all four algorithms scores of 13 candidate housekeeping genes in the (a) adipogenesis and (b) thermogenesis panel. The GMR values were calculated by the Refinder algorithm using the original ct values of each gene as input, considering all experimental designs. Lower (left) and higher (right) scores indicate more and less stable genes, respectively.
Table 3. The comparative summary of gene stability for 13 reference genes in the adipogenesis panel.
Table 4. The comparative summary of gene stability for 13 reference genes in the thermogenesis panel.
2.5. The effect of different reference genes on the expression of target genes
Next, we carried out expression analysis of two target genes, Pparg and Ucp1, in adipogenesis or thermogenesis, using the selected reference genes. UCP1 proteins are typically expressed at low levels in the early stages of adipogenesis, and its expression in differentiating brown adipocytes gradually increases in a stage-dependent manner. In addition, the Ucp1 gene is tightly regulated in response to thermogenic stimuli or cold exposure [Citation7,Citation35]. In addition, Pparg expression increases during adipogenesis owing to its crucial role in adipocyte differentiation [Citation36,Citation37]. Indeed, Ucp1 or Pparg expression in brown adipocytes significantly increased at the later stages of adipogenesis in a time-dependent manner (); however, only Ucp1 expression greatly responded to norepinephrine in brown adipocytes, although the expression of both genes was elevated in differentiated adipocytes (Day 8) regardless of Norepinephrine ().
Figure 4. The relative gene expression of adipogenic markers based on four specific reference genes during the brown adipocyte differentiation. The relative expression levels of Ucp1 (a) and pparg (b) normalized to each reference gene (Tbp, Ubc, Rer1 and Sdha) were represented as graphs. Cells were collected at each differentiation time (day 0 (D0), day 2 (D2), day 4 (D4), and day 8 (D8)), followed by an RT-qPCR assay to assess the mRNA expression of Ucp1 and Pparg. The relative expression of the two target genes was normalized using various reference genes and calculated relative to the control. All experiments were performed at three replications. * < 0.05, ** < 0.01, *** < 0.005, **** < 0.001, ns: non-significant, p value. Orange, green, cyan, and purple represent Tbp, Ubc, Rer1 and Sdha, respectively.
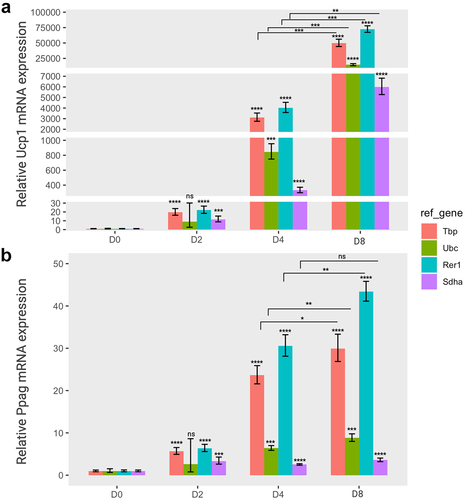
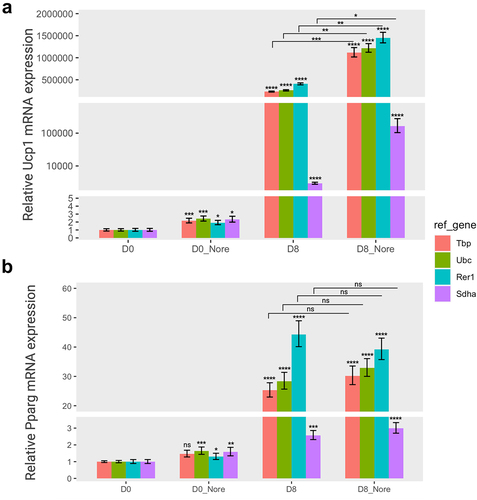
Figure 5. The relative gene expression of adipogenic markers based on four specific reference genes in norepinephrine-induced thermogenesis. The relative expression levels of Ucp1 (a) and pparg (b) normalized to each reference gene (tbp, Ubc, Rer1, and sdha) were represented as graphs. Cells were treated with norepinephrine (1 µM) or DMSO (control) at day 0 (D0, preadipocytes) and day 8 (D8, differentiated adipocytes) and incubated for 24 hours, and subsequently subjected to to RT-qPCR assay to examine the mRNA expression of Ucp1 and Pparg. The relative expression of the two target genes were normalized using various reference genes and calculated in relation to the control. All experiments were performed at three replications. * < 0.05, ** < 0.01, *** < 0.005, **** < 0.001, ns: non-significant. Nore, norepinephrine. Orange, green, cyan, and purple represent Tbp, Ubc, Rer1, and Sdha, respectively.
The relative expression levels of these two target genes varied depending on the reference gene. In the adipogenesis panel, the relative expression of Ucp1 gene was significantly increased until the completion of differentiation (day 8) when normalized to all reference genes. In particular, Ucp1 expression was higher when using the relatively stable reference genes (Tbp, Rer1, and Ubc) than Sdha, which is the most unstable gene (). The expression of Pparg exhibited a similar pattern for both Tbp and Rer1 reference genes. However, the relative Pparg expression at the differentiation stage of brown adipocytes was very low when either Ubc or Sdha was used as a reference gene (). Indeed, the Ubc gene was less stable in the adipogenesis panel, although it was ranked as the second most stable gene in thermogenesis ().
Similarly, the relative expression of the Ucp1 gene was greatly increased in mature adipocytes (day 8) compared to uninduced preadipocytes (day 0) when normalized to Tbp, Rer1, and Ubc. In addition, the Ucp1 relative levels were notably increased upon treatment with norepinephrine in differentiated adipocytes (day 8) in the thermogenesis panel (). In addition, norepinephrine activated UCP1 expression in uninduced brown preadipocytes (day 0). In the same panel, the relative Pparg expression was consistently increased in differentiated adipocytes (day 8) compared to that in preadipocytes (day 0) but did not respond to norepinephrine, as expected (). All selected reference genes (Tbp, Rer1, and Ubc), except Sdha showed a similar effect on Pparg expression. The relative expression levels of the two target genes revealed a striking contrast when normalized to the most stable versus least stable genes, suggesting that a specific reference gene might considerably impact the assessment of gene expression under various experimental conditions.
3. Discussion
Brown adipocytes, which are specialized fat cells, can generate heat, which regulates body temperature and energy expenditure [Citation2,Citation17]. Therefore, understanding the molecular mechanisms behind these events is essential to evaluate the physiological significance and potential therapeutic implications of brown adipose tissues in metabolic disorders and obesity-related conditions. Many studies using mouse models and brown adipogenesis suggest that they could be utilized to develop a new potential therapy by regulating adipose tissue browning and thermogenic activity [Citation9,Citation38,Citation39]. In this study, we generated immortalized brown preadipocytes isolated from the interscapular BAT of Ucp1-luciferase transgenic mice and performed gene expression analysis during brown adipogenesis in vitro. To screen for new therapeutic targets in adipogenesis, we first examined possible reference genes that could be used for normalization of gene expression. In particular, selecting a suitable reference is critical for studying the function of genes that are differentially expressed during the developmental stages of adipocytes. Indeed, according to a previous study [Citation19], some reference genes showed different gene expression stabilities in the adipose tissues of mice with metabolic disorders based on real-time PCR analysis.
In diverse scientific disciplines, there has been a notable increase in the number of studies validating reference genes for RT-qPCR normalization. Different methodologies employ varied approaches to rank these genes, and consequently, relying on a single method may not yield the definitive ‘best’ reference gene. To address this, multiple approaches are often employed to ascertain the most suitable reference gene. In our study, we utilized the RefFinder tool [Citation30], which integrates four contemporary computational programmes (geNorm [Citation34], NormFinder [Citation33], BestKeeper [Citation32], and the comparative ΔCt method [Citation21]. This comprehensive approach enabled the assessment of stability and reliability of 13 well-established reference genes, each serving distinct functions (as detailed in ), across two in vitro experimental conditions: adipogenesis and thermogenesis. A similar strategy has been widely adopted to evaluate the expression stability of reference genes under various experimental conditions [Citation21–23,Citation40].
Among the 13 candidate genes, we identified two genes (Tbp and Rer1) as the optimal references for gene expression analysis of target genes in brown adipogenesis and thermogenesis (). These results are consistent with several previous studies in which Tbp was stably and consistently expressed across adipose tissues, including white adipose tissue (WAT) and brown adipose tissue (BAT) [Citation19,Citation20]. Additionally, the Tbp gene has been suggested as a reference for qPCR-based gene expression analyses in peripheral nerve injury conditions [Citation41], liver cell-injured models [Citation42], osteogenic differentiation [Citation43], and in the ageing models [Citation44]. Since the TBP protein plays an essential role in transcription initiation to maintain cellular homoeostasis, its expression should be stable during cell differentiation. Indeed, TBP, as a general transcription factor, directly binds to the TATA box sequence of promoters in most genes and serves as a crucial component of the general transcription machinery [Citation45]. In addition, the Rer1 (Retention in endoplasmic reticulum 1) gene exhibited remarkable stability across the two experimental conditions, consistently normalizing the expression of target genes, Ucp1 and Pparg ( and ). Although Rer1 is not conventionally employed as a reference gene in adipocyte research, in our specific experimental context, it demonstrated stability and suitability as one of the most reliable reference genes for expression analysis in mouse brown adipocytes. Generally, Rer1 is recognized as a well-conserved early Golgi membrane protein crucial for cellular homoeostasis and maintaining the functional integrity of the endoplasmic reticulum (ER) [Citation46]. A study by Taichi Hara et. al showed that Rer1 is essential for neural stem cell maintenance, and its depletion can lead to malformation in the mouse cerebral cortex [Citation47]. They also suggested that the quality control systems in the late-Golgi or post-Golgi stages exhibit a more stringent function in mouse cells compared to other cultured cell lines, offering a potential explanation for the observed stability of Rer1 gene in our experimental context.
Moreover, we identified that the most traditional reference genes belonging to two groups, cellular structural maintenance (Actb and Tubb5) and metabolism and energy production (Gapdh, Pgk1, and Sdha), displayed expression variability in our experimental conditions, securing mid to low rankings among the 13 candidate genes. Actb and Gapdh are commonly used as endogenous control genes to assess relative gene expression owing to their high abundance. However, in this study, the Actb gene was ranked only 10th in the adipogenesis panel and 11th in the thermogenesis panel, while the Gapdh gene was identified as a less stable gene, ranking 12th in the adipogenic panel and 8th in the thermogenic panels. Our findings align with numerous studies, demonstrating that Gapdh and Actb, housekeeping genes frequently mentioned in the literature, may not be optimal choices for our experimental design. Their gene expression levels were relatively unstable in various contexts, including the mouse choroid plexus [Citation20], T lymphocytes co-cultured with mesenchymal stem cells [Citation40], ageing studies [Citation44], and human adipose stromal cells [Citation48]. This suggests that these reference genes might be specifically modulated during adipogenesis and thermogenesis, which consequently induces structural and metabolic alterations in brown adipocytes. In general, cellular metabolic activities specifically respond to external signals at different developmental stages, indicating relatively unstable expression patterns of genes associated with cellular structure and metabolism, as shown in the study. Using the least stable gene, Sdha to normalize the target genes revealed a substantial difference in the relative expression levels of Ucp1 and Pparg. This was unexpectedly lower than the consistent findings obtained for the most stable genes, Tbp1 and Rer1 ().
In summary, our findings suggest that Tbp and Rer1 present promising options as reference genes for RT-qPCR-based gene expression analysis in the context of adipogenesis and thermogenesis, specifically in mouse brown adipocytes under in vitro conditions. Nevertheless, it is crucial to acknowledge that our analysis concentrated on a specific set of candidate reference genes within mouse cells and in vitro experimental settings, potentially limit their generalizability. Furthermore, aligning with prior research, we strongly advocate for the implementation of validation experiments to identify suitable reference genes before delving into the study of specific cellular functions.
4. Materials and methods
4.1. Reagents and drugs
Reagents and drugs used in this study were listed as follows: Dulbecco Modified Eagle Medium (DMEM) (high glucose, #11965092), DMEM/F-12 (HEPES, #11330032), foetal bovine serum (FBS; #16000–044), RNase-free (#89836), DNase I Solution (1 unit/µL), and RevertAid First Strand cDNA Synthesis Kit from Thermo Scientific; 3-Isobutyl-1-Methylxanthine (IBMX, #I5879), Indomethacin (#I7378), Dexametha- sone (#D4902), Insulin from porcine pancreas (#I5523), 3,3,5-Triiodo-L-thyronine (#T2877), Norepinephrine (#N5785), Collagenase D (#COLLD-RO), Dispase II (#42613-33-2) from Sigma Aldrich; Trizol reagent (#15596026), PureLink Genomic DNA Mini Kit from Invitrogen; amfiSure qGreen Q-PCR Master Mix(2X), With- out ROX (#Q5600–005) from GenDEPOT. G418 (#10131–035) and Lipofectamine 3000 (#11668–500) from Gibco (Grand, Island NYUSA). Protease inhibitor cocktails (#78441), Enhanced ChemiLuminescence (ECL) detection system (#34080), and M2 lysis buffer (#85111) were purchased from Thermo Scientific.
4.2. Generation of immortalized UCP1 luciferase preadipocyte lines
The stromal vascular fraction (SVF) was isolated from both sides of the interscapular BAT of a 3-week-old male ThermoMouse mouse strain (JAX stock #026690) euthanized with an intraperitoneal injection of avertin (2,2,2 Tribromoethanol, 250 mg/kg). Animal experiments followed the National Institute of Health (NIH) guidelines and a scientifically reviewed protocol (GLA-100917-M0093). The Animal Care Committee for Animal Research at Gyeongsang National University approved the study protocol (GNU-200820-M0053). The study was conducted according to the ARRIVE guidelines 2.0 (https://arriveguidelines.org) [Citation49]. The cells isolated from the SVF were then cultured in Dulbecco’s modified Eagle’s medium (DMEM) with 10% FBS and immortalized using the retrovirus-mediated simian virus 40 large T antigen (SV40 LT), as described previously [Citation50]. Immortalized preadipocytes were selected in media containing puromycin (2 µg/ml) and verified by genotyping following the manufacturer’s protocols (Jackson Laboratory).
4.3. Cell culture and brown adipocyte differentiation
The immortalized preadipocytes were maintained in standard high-glucose DMEM supplemented with 10% FBS and 100 µg/mL streptomycin and incubated in a 37oC humidified atmosphere containing 5% CO2. For the brown adipocyte differentiation, immortalized preadipocytes were seeded at an initial cell concentration of 1 × 10[Citation5] cells/ml and incubated until cell confluency reached 90% − 100%. The cells were then cultured in an induction medium (DMEM/F-12 medium, 10% FBS, 0.5 mM Isobutylmethylxathin (IBMX), 0.125 mM Indomethacin, 1.0 µM Dexamethasone, 5.0 µg/ml insulin, 1.0 nM T3) for two days, and subsequently maintained for six consecutive days in differentiation medium (DMEM/F-12 medium, 10% FBS, 5.0 µg/ml insulin, 1.0 nM T3).
4.4. Cell culture and brown adipocyte differentiation
The immortalized preadipocytes were maintained in standard high-glucose DMEM supplemented with 10% FBS and 100 µg/mL streptomycin and incubated in a 37°C humidified atmosphere containing 5% CO2. For the brown adipocyte differentiation, immortalized preadipocytes were seeded at an initial 1 × 10[Citation5] cells/ml cell concentration and incubated until cell confluency reached 90% − 100%. The cells were then cultured in an induction medium (DMEM/F-12 medium, 10% FBS, 0.5 mM Isobutylmethylxathin (IBMX), 0.125 mM Indomethacin, 1.0 µM Dexamethasone, 5.0 µg/ml insulin, 1.0 nM T3) for two days, and subsequently maintained for six consecutive days in differentiation medium (DMEM/F-12 medium, 10% FBS, 5.0 µg/ml insulin, 1.0 nM T3).
4.5. Oil red O staining
The Oil Red O (ORO) solution was freshly prepared by mixing Oil Red O stock solution (0.03% Oil Red O in 100% isopropanol) in a mixture of 60:40 stock solution with distilled water (DW). The cells were fixed in a 4% formaldehyde solution for 30 min at room temperature and then washed with DW three times. Subsequently, 60% isopropanol was added to the cells, allowed to sit for five minutes, and removed without washing. The cells were evenly covered with ORO solution, the cell plates were rotated, and incubated at room temperature for 10–20 min. After incubation, the ORO solution was removed, and the cells were gently washed with two to five DW washes until no excess dye solution was visible. The cells were then submerged in DW to avoid drying, and examined under a bright-field microscope within 24 h before quantitative analysis. To quantify the ORO staining assay, the stained cells were extracted in 100% isopropanol with a 50% volume of the cell plate (e.g. for a 24-well plate, 250 µl per well), and 80% of the extraction volume was used to measure the absorbance at a wavelength of 492 nm in a microplate reader. Isopropanol (100%) was used as the background control to subtract the background signal.
4.6. Primer design
Primers were designed using Primer-BLAST with a targeted amplicon product size of 70–200 bp in length, a G-C content of 50–60%, and a melting temperature (Tm) aiming for a minimum of 60oC and a maximum of 63oC. Primers of the reference genes and target genes used in the assay are listed in , with detailed information on the designed primers used in this study, including NCBI reference sequences, primer sequences, G-C content, and Tm.
4.7. RNA extraction and RT-qPCR
The cells were collected at the indicated times and used for RNA extraction according to the manufacturer’s instructions. Briefly, total RNAs from six-well plates was extracted with 1.0 mL Trizol for each well. For the matured adipocyte samples, additional centrifugation of the Trizol-containing cell lysate was performed at 12,000 rpm for 10 min to remove excess fat. We verified that the A260/A280 ratios were between 1.8 and 2.0. Before cDNA synthesis, 1.0 µg of total RNA sample was treated with 1 U DNase I solution for 30 min at 37oC °C to remove trace amounts of DNA. Next, a Thermo Scientific RevertAid First Strand cDNA Synthesis Kit was used to generate first-strand cDNA using RNA templates for reverse transcription, according to the manufacturer’s instructions. Subsequently, qPCR was performed using the amfiSure qGreen Q-PCR Master Mix kit following the manufacturer’s protocol with 100 ng cDNA synthesis products in a 10 µl reaction. Reactions were performed using Rotor-Gene Q (QIAGEN, Hilden, Germany).
Target gene expression was quantified in the differentiated samples relative to the selected reference genes relative to the control sample (day 0). The ∆∆Ct model was applied using Pearson pcr R package [Citation51]. The relative expression of the target genes was compared on each differentiation day to the control cells (day 0) using Student’s t-test. p-values < 0.05. Experiments were performed in triplicate.
4.8. RT-qPCR standard curve
The RT-qPCR standard curve method was performed using SVFs four days (day 4) after the induction of adipogenesis with six data points over several orders of 10-fold dilutions. An RT-qPCR standard curve was graphically represented as a semi-log regression line plot of the CT values versus the log of each sample dilution. The R2 value is the coefficient of correlation obtained for the standard curve and should be > 0.99, to provide good confidence within the correlation. Efficiency (E%) was calculated from slope of the standard curve according to the following equation:
4.9. Stability score analysis
The stability of gene expression was examined using RefFinder, a web-based comprehensive tool [Citation52] created for the analysis and screening of reference genes, to compare and rank the evaluated potential reference genes. The tool incorporates four key algorithms NormFinder [Citation33], GeNorm [Citation34], BestKeeper [Citation32], and Delta CT [Citation21]. To employ the RefFinder tool, we inputted the original Ct values, encompassing all biological replications at different time points for adipogenesis conditions or treatments for thermogenesis conditions for each gene, adhering to the instructions provided on the RefFinder platform [Citation30]. The output stability scores from RefFinder included NormFinder, ρ; GeNorm, M; BestKeeper, r; Delta CT: Mean SD of mean ~Ct; and comprehensive gene stability RefFinder: Geomean. The geometric means of the ranks were calculated from all four algorithms and provided a comprehensive final ranking of the candidate reference genes.
4.10. Software environment and reproducibility
R and Bioconductor programmes were used to perform the relative expression of target genes, statistical analysis, and data visualization [Citation53–55].
4.11. Statistical analysis
For each sample, RT-qPCR was independently performed at least three times. Data are presented as mean values (± S.D). The normal distribution of the Ct values derived from the RT-qPCR assays was determined by Shapiro-Wilk test [Citation56]. The statistical significance of the two groups was evaluated using an unpaired Student’s t-test, in the t.test() function conducted in R (Vienna, Austria) [Citation53]. p < 0.05.
Accession codes
The code used to generate the figures and tables and run the analysis in this study is open-source (GPL-3) and freely available at https://github.com/BCMSLab.
Supplemental Material
Download MS Word (796.8 KB)Acknowledgments
We thank all the lab members for their thoughtful feedback on this study.
Disclosure statement
No potential conflict of interest was reported by the author(s).
Data availability statement
The reference sequences used for designing primers in this study can be found in the NCBI Reference Sequences (NM007393.5; NM009735.3; NM001289726.2; NM010368.2; NM013556.2; NM008828.3; NM026395.2; NM009438.5; NM011296.3; NM013684.3; NM011655.5; NM019639.4; NM023281.1; NM009463.3; NM001127330.3).
Supplemental data
Supplemental data for this article can be accessed online at https://doi.org/10.1080/21623945.2024.2330355
Additional information
Funding
References
- Wang GX, Zhao XY, Lin JD. The brown fat secretome: metabolic functions beyond thermogenesis. Trends Endocrinol Metab. 2015;26(5):231–14. doi: 10.1016/j.tem.2015.03.002
- Townsend KL, Tseng YH. Brown fat fuel utilization and thermogenesis. Trends Endocrinol Metab. 2014;25(4):168–177. doi: 10.1016/j.tem.2013.12.004
- Betz MJ, Enerbäck S. Targeting thermogenesis in brown fat and muscle to treat obesity and metabolic disease. Nat Rev Endocrinol. 2018;14(2):77–87. doi: 10.1038/nrendo.2017.132
- Kajimura S, Spiegelman BM, Seale P. Brown and beige fat: physiological roles beyond heat generation. Cell Metab. 2015;22(4):546–559. doi: 10.1016/j.cmet.2015.09.007
- Luijten IHN, Cannon B, Nedergaard J. Glucocorticoids and brown adipose tissue: do glucocorticoids really inhibit thermogenesis? Mol Aspects Med. 2019;68(July):42–59. doi: 10.1016/j.mam.2019.07.002
- Ballinger MA, Andrews MT, Suarez, RK., et al. Nature’s fat-burning machine: brown adipose tissue in a hibernating mammal. J. Exp. Biol. 2018;221(Suppl 1):jeb162586. doi:10.1242/jeb.162586
- Ikeda K, Yamada T. UCP1 Dependent and Independent Thermogenesis in Brown and Beige Adipocytes. Front Endocrinol. 2020;11(July):1–6. doi: 10.3389/fendo.2020.00498
- Oeckl J, Janovska P, Adamcova K, et al. Loss of UCP1 function augments recruitment of futile lipid cycling for thermogenesis in murine brown fat. Mol Metab. 2022;61(April):101499. doi: 10.1016/j.molmet.2022.101499
- Galmozzi A, Sonne SB, Altshuler-Keylin S, et al. ThermoMouse: an in vivo Model to identify modulators of UCP1 expression in brown adipose tissue. Cell Rep. 2014;9(5):1584–1593. doi: 10.1016/j.celrep.2014.10.066
- Kalinovich AV, de Jong JMA, Cannon B, et al. UCP1 in adipose tissues: two steps to full browning. Biochimie. 2017;134:127–137. doi: 10.1016/j.biochi.2017.01.007
- Fedorenko A, Lishko PV, Kirichok Y. Mechanism of fatty-acid-dependent UCP1 uncoupling in brown fat mitochondria. Cell. 2012;151(2):400–413. doi: 10.1016/j.cell.2012.09.010
- Duteil D, Metzger E, Willmann D, et al. LSD1 promotes oxidative metabolism of white adipose tissue. Nat Commun. 2014;5(1):4093. doi: 10.1038/ncomms5093
- Kusudo T, Hashimoto M, Kataoka N, et al. CREG1 promotes uncoupling protein 1 expression and brown adipogenesis in vitro. J Biochem. 2019;165(1):47–55. doi: 10.1093/JB/MVY083
- Lefterova MI, Zhang Y, Steger DJ, et al. Ppargamma and C/EBP factors orchestrate adipocyte biology via adjacent binding on a genome-wide scale. Genes Dev. 2008;22(21):2941–2952. doi: 10.1101/gad.1709008
- Ahmed M, Lai TH, Hwang JS, et al. Transcriptional regulation of autophagy genes via stage-specific activation of CEBPB and PPARG during adipogenesis: a systematic study using public gene expression and transcription factor binding datasets. Cells. 2019;8(11):1321. doi: 10.3390/cells8111321
- Loft A, Forss I, Siersbæk MS, et al. Browning of human adipocytes requires KLF11 and reprogramming of PPARγ superenhancers. Genes Dev. 2015;29(1):7–22. doi: 10.1101/gad.250829.114
- Townsend KL, Tseng Y-H. Of mice and men: novel insights regarding constitutive and recruitable brown adipocytes. Int J Obes Suppl. 2015;5(S1):S15–S20. doi: 10.1038/ijosup.2015.5
- Fundel K, Haag J, Gebhard PM, et al. Normalization strategies for mRNA expression data in cartilage research. Osteoarthr Cartil. 2008;16(8):947–955. doi: 10.1016/J.JOCA.2007.12.007
- Almeida-Oliveira F, Leandro JGB, Ausina P, et al. Reference genes for quantitative PCR in the adipose tissue of mice with metabolic disease. Biomed Pharmacother. 2017;88:948–955. doi: 10.1016/j.biopha.2017.01.091
- Ho KH, Patrizi A. Assessment of common housekeeping genes as reference for gene expression studies using RT-qPCR in mouse choroid plexus. Sci Rep. 2021;11(1):1–15. doi: 10.1038/s41598-021-82800-5
- Silver N, Best S, Jiang J, et al. Selection of housekeeping genes for gene expression studies in human reticulocytes using real-time PCR. BMC Mol Biol. 2006;7(1):1–9. doi:10.1186/1471-2199-7-33
- Nevone A, Lattarulo F, Russo M, et al. A strategy for the selection of RT-qPCR reference genes based on publicly available transcriptomic datasets. Biomedicines. 2023;11(4):1079. doi: 10.3390/biomedicines11041079
- Mu J, Wang Y, Wang M, et al. Identification of reliable reference genes for gene expression studies in mouse models under microplastics stress. Ecotoxicol Environ Saf. 2023;252(January):114569. doi: 10.1016/j.ecoenv.2023.114569
- Hayashi M, Nagasaka T. Suppression of norepinephrine-induced thermogenesis in brown adipose tissue by fasting. Am J Physiol. 1983;245(6):E582–E586. doi: 10.1152/AJPENDO.1983.245.6.E582
- Cannon B, Nedergaard J. Brown adipose tissue: function and physiological significance. Physiol Rev. 2004;84(1):277–359. doi: 10.1152/PHYSREV.00015.2003
- van Marken Lichtenbelt WD, Daanen HAM. Cold-induced metabolism. Curr Opin Clin Nutr Metab Care. 2003;6(4):469–475. doi: 10.1097/01.MCO.0000078992.96795.5F
- O’Leary NA, Wright MW, Brister JR, et al. Reference sequence (RefSeq) database at NCBI: current status, taxonomic expansion, and functional annotation. Nucleic Acids Res. 2016;44(D1):D733–D745. doi: 10.1093/NAR/GKV1189
- Ye J, Coulouris G, Zaretskaya I, et al. Primer-BLAST: a tool to design target-specific primers for polymerase chain reaction. BMC Bioinf. 2012;13(1):134. doi: 10.1186/1471-2105-13-134
- Larionov A, Krause A, Miller WR. A standard curve based method for relative real time PCR data processing. BMC Bioinf. 2005;6(1):62. doi: 10.1186/1471-2105-6-62
- Xie F, Wang J, Zhang B. RefFinder: a web-based tool for comprehensively analyzing and identifying reference genes. Funct Integr Genomics. 2023;23(2):125. doi: 10.1007/S10142-023-01055-7
- Livak KJ, Schmittgen TD Analysis of relative gene expression data using real-time quantitative PCR and the double delta CT method. Methods. 2001;25(4):402–408. doi: 10.1006/meth.2001.1262
- Pfaffl MW, Tichopad A, Prgomet C, et al. Determination of stable housekeeping genes, differentially regulated target genes and sample integrity: BestKeeper–Excel-based tool using pair-wise correlations. Biotechnol Lett. 2004;26(6):509–515. doi: 10.1023/B:BILE.0000019559.84305.47
- Andersen CL, Jensen JL, TF Ørntoft. Normalization of real-time quantitative reverse transcription-PCR data: a model-based variance estimation approach to identify genes suited for normalization, applied to bladder and colon cancer data sets. Cancer Res. 2004;64(15):5245–5250. doi: 10.1158/0008-5472.CAN-04-0496
- Vandesompele J, De Preter K, Pattyn F, et al. Accurate normalization of real-time quantitative RT-PCR data by geometric averaging of multiple internal control genes. Genome Biol. 2002;3(7):1–12. doi: 10.1186/gb-2002-3-7-research0034
- Shinde AB, Song A, Wang QA. Brown adipose tissue heterogeneity, energy metabolism, and beyond. Front Endocrinol. 2021;12(April):1–13. doi: 10.3389/fendo.2021.651763
- Tontonoz P, Hu E, Spiegelman BM. Stimulation of adipogenesis in fibroblasts by PPARγ2, a lipid-activated transcription factor. Cell. 1994;79(7):1147–1156. doi: 10.1016/0092-8674(94)90006-X
- Wang QA, Zhang F, Jiang L, et al. Peroxisome proliferator-activated receptor γ and its role in adipocyte homeostasis and thiazolidinedione-mediated insulin sensitization. 2018;38(10). doi: 10.1128/MCB.00677-17
- Colas C, Mouchiroud M, Al Dow M, et al. DEPTOR loss impairs brown adipocyte development in vitro but has limited impacts in mice. Mol Metab. 2023;67:67. doi: 10.1016/J.MOLMET.2022.101660
- Chang CF, Gunawan AL, Liparulo I, et al. CoQ regulates brown adipose tissue respiration and uncoupling protein 1 expression. Antioxidants (Basel). 2022;12(1):14. doi: 10.3390/ANTIOX12010014
- Li X, Yang Q, Bai J, et al. Evaluation of eight reference genes for quantitative polymerase chain reaction analysis in human T lymphocytes co-cultured with mesenchymal stem cells. Mol Med Rep. 2015;12(5):7721–7727. doi: 10.3892/mmr.2015.4396
- Wang Y, Shan Q, Meng Y, et al. Mrpl10 and Tbp are suitable reference genes for peripheral nerve crush injury. Int J Mol Sci. 2017;18(2):263. doi: 10.3390/IJMS18020263
- Chen J, Bao Z, Huang Y, et al. Selection of suitable reference genes for qPCR gene expression analysis of HepG2 and L02 in four different liver cell Injured models. Biomed Res Int. 2020;2020:1–11. doi: 10.1155/2020/8926120
- Franko N, Vrščaj LA, Zore T, et al. TBP, PPIA, YWHAZ and EF1A1 are the most stably expressed genes during Osteogenic Differentiation. Int J Mol Sci. 2022;23(8):4257. doi:10.3390/IJMS23084257
- González-Bermúdez L, Anglada T, Genescà A, et al. Identification of reference genes for RT-qPCR data normalisation in aging studies. Sci Rep 91. 2019;9(1):1–11. doi:10.1038/s41598-019-50035-0
- Schiera G, Di Liegro CM, Di Liegro I. Molecular determinants of malignant brain cancers: from intracellular alterations to invasion mediated by extracellular vesicles. Int J Mol Sci. 2017;18(12):2774. doi: 10.3390/ijms18122774
- Sato K, Nishikawa SI, Nakano A. Membrane protein retrieval from the golgi apparatus to the endoplasmic reticulum (ER): characterization of the RER1 gene product as a component involved in ER localization of Sec12p. Mol Biol Cell. 1995;6(11):1459–1477. doi: 10.1091/MBC.6.11.1459
- Hara T, Maejima I, Akuzawa T, et al. Rer1-mediated quality control system is required for neural stem cell maintenance during cerebral cortex development. PloS Genet. 2018;14(9):1–22. doi: 10.1371/journal.pgen.1007647
- Krautgasser C, Mandl M, Hatzmann FM, et al. Reliable reference genes for expression analysis of proliferating and adipogenically differentiating human adipose stromal cells. Cell Mol Biol Lett. 2019;24(1). doi: 10.1186/s11658-019-0140-6
- du Sert NP, Hurst V, Ahluwalia A, et al. The arrive guidelines 2.0: Updated guidelines for reporting animal research. PLoS Biol. 2020;18(7):1–12. doi: 10.1371/journal.pbio.3000410
- Kawano M, Morikawa K, Suda T, et al. Chimeric SV40 virus-like particles induce specific cytotoxicity and protective immunity against influenza a virus without the need of adjuvants. Virology. 2014;448:159–167. doi: 10.1016/j.virol.2013.10.010
- Ahmed M, Kim DR. Pcr: an R package for quality assessment, analysis and testing of qPCR data. PeerJ. 2018;6(3):e4473. doi: 10.7717/peerj.4473
- Xie F, Xiao P, Chen D, et al. miRdeepfinder: a miRNA analysis tool for deep sequencing of plant small RNAs. Plant Mol Biol. 2012;80(1):75–84. doi: 10.1007/S11103-012-9885-2
- R Core Team. R: a language and environment for statistical computing. 2021. Available from: https://www.r-project.org/
- Gentleman RC, Carey VJ, Bates DM, et al. Bioconductor: open software development for computational biology and bioinformatics. Genome Biol. 2004;5(10):1–16.
- Xu S, Chen M, Feng T, et al. Use ggbreak to effectively utilize plotting space to deal with large datasets and outliers. Front Genet. 2021;12:2122. doi: 10.3389/fgene.2021.774846
- Shapiro SS, Wilk MB. An analysis of variance test for normality (complete samples). Biometrika. 1965;52(3–4):591–611. doi: 10.1093/biomet/52.3-4.591