
ABSTRACT
A Disintegrin And Metalloproteinase domain-containing protein 10 (ADAM10), is involved in several metabolic and inflammatory pathways. We speculated that ADAM10 plays a modulatory role in adipose tissue inflammation and metabolism. To this end, we studied adipose tissue-specific ADAM10 knock-out mice (aKO). While young, regular chow diet-fed aKO mice showed increased insulin sensitivity, following prolonged (33 weeks) high-fat diet (HFD) exposure, aKO mice developed obesity and insulin resistance. Compared to controls, aKO mice showed less inflammatory adipokine profile despite the significant increase in adiposity. In brown adipose tissue, aKO mice on HFD had changes in CD8+ T cell populations indicating a lesser inflammatory pattern. Following HFD, both aKO and control littermates demonstrated decreased adipose tissue pro-inflammatory macrophages, and increased anti-inflammatory accumulation, without differences between the genotypes. Collectively, our observations indicate that selective deletion of ADAM10 in adipocytes results in a mitigated inflammatory response, leading to increased insulin sensitivity in young mice fed with regular diet. This state of insulin sensitivity, following prolonged HFD, facilitates energy storage resulting in increased fat accumulation which ultimately leads to the development of a phenotype of obesity and insulin resistance. In conclusion, the data indicate that ADAM10 has a modulatory effect of inflammation and whole-body energy metabolism.
Introduction
Notch signalling is an evolutionarily conserved pathway with an essential role in differentiation, organogenesis, proliferation, metabolism, and survival of many cells types, including adipocytes [Citation1–3]. Notch receptors (NOTCH1–4) are transmembrane proteins with three domains: a Notch Extra-Cellular Domain (NECD), a Trans-Membrane (TM) domain, and a Notch Intra-Cellular Domain (NICD). Notch ligands are transmembrane proteins members of the Delta/Serrate/LAG-2 (DSL) family and include Delta-like (DLL) 1, 3, and 4 and Jagged 1 and 2 (JAG1, JAG2) in mammals [Citation1,Citation4]; The interaction between Notch receptors and ligands results in proteolytic cleavage cascade of the Notch receptor; the first proteolytic cleavage is performed by A Disintegrin and Metalloproteinase (ADAM) endopeptidases with release of the NECD domain, whereas the second cleavage is mediated by γ-secretase that result in the release of NICD [Citation4]. The NICD domain is then translocated to the nucleus, where it binds with the recombining binding protein suppressor of hairless (RBPJ) protein and activates transcription of downstream Notch target genes. These include members of the basic-helix-loop-helix transcription factors, belonging to the hairy and enhancer of split (HES) and HES with YRPW motif (HEY) families [Citation4].
ADAM10 is involved in many physiologic processes such as regulation of cell adhesion, chemotaxis, inflammation, and apoptosis [Citation5] and pathophysiologic processes, such as cancer and brain, liver, epithelial, and immune response disorders [Citation5], Furthermore, the diverse substrates of ADAM10 include growth factors, cytokines, hormones, adhesion molecules, and receptors, such as Notch receptor for advanced glycation end products (RAGE), IL-6 receptor (IL-6 R), and FasL [Citation6]. The pleiotropic actions of ADAM10 suggest that ADAM10 is important in adipose tissue homoeostasis and whole-organism metabolism, but very little is known about the function of ADAM10 in adipocyte function and systemic energy metabolism.
Adipose tissue macrophages (ATMs) consist of at least two different phenotypes, historically [Citation7] described as classically activated M1 macrophages and alternatively activated M2 macrophages. Emerging evidence implicates Notch signalling in M1 macrophage polarization, leading to overexpression of Tumor Necrosis Factor (TNF)-α, inducible Nitric Oxide Synthase (iNOS), Interleukin (IL)-6, and Monocyte Chemoattractant Protein (MCP)-1 [Citation8,Citation9]. Conversely, other studies reported that pharmacologic and genetic inhibition of Notch signalling leads to suppression of M1 macrophages polarization and activation of M2 macrophages and subsequent anti-inflammatory cytokine production [Citation7,Citation10]. Interestingly, inhibition of Notch signalling resulted in M2 macrophage polarization even in the presence of M1 inducers [Citation11]. Despite the convincing data supporting the pivotal role of Notch signalling in macrophage polarization, the mechanisms by which Notch signalling executes its effects are still unclear. Furthermore, inhibition of Notch signalling has been shown to promote browning of white adipose tissue and ameliorates obesity, suggesting that targeted deletion of Notch signalling in adipocytes could have profound metabolic benefits [Citation8].
A better understanding of ADAM10 activity could uncover druggable targets enabling a more specific and fine-tuned modulation of its proteolytic activity. To better assess the role of ADAM10 in adipose tissue function and immune-metabolism, we generated an adipose tissue-specific ADAM10 knock out (ADAM10 aKO) mouse. Here we describe the metabolic and immunological characteristics of this model.
Materials and methods
Animals
ADAM10 aKO mice were generated as previously described [Citation9]. Briefly, Adipoq-Cre mice (C57Bl/6/J background) were purchased from The Jackson Laboratory (Stock #028020) and were crossed to Adam10 floxed mice (C57Bl/6/J background).
All mice were housed under controlled temperature (22°C) with 12-hour light (06:00–17:59) to 12-hour dark (18:00–05:59) cycles at the Animal Care Facility at Virginia Commonwealth University. For all experiments, male mice aged 12-weeks (baseline) were used for long term (33 weeks) High Fat Diet (HFD) (60 kcal% fat, D12451i, Research Diets) and Regular Chow Diet (RCD) (Teklad 7019) feeding. Animal care and experimental procedures were performed under the approval from the IACUC of Virginia Commonwealth University.
Indirect calorimetry
Metabolic measurements were performed using an indirect calorimeter system (PhenoMaster, TSE Systems, Inc, Germany). Briefly, mice were weighed and housed individually in PhenoMaster calorimeter chambers with ad libitum access to diet and water. Recording of the data was started after a 24-hours acclimatation period to account for the stress of single-cage housing. A 12-hour-light/dark cycle was set (Light 06:00; Dark 17:59), with an ambient temperature of 22°C. The system was calibrated against a standard gas mixture to measure O2 consumed (VO2, ml/kg/h) and CO2 generated (VCO2, ml/kg/h). Energy expenditure (EE) (kcal/h/kg), respiratory quotient (ratio of VCO2/VO2, RER), food intake (g), and locomotor activity (beam breaks; X+Y planes), were evaluated over a 72-hour period. The results were normalized and compared with the wild type (WT) group per cohort, the results of which were set as 100%.
Body composition analysis
In vivo body composition analysis was performed using the time-domain NMR minispec (LF90II, Bruker Optik). Briefly, mice were weighed and placed in the LF90II using a movement restrainer to allow for proper measurements. Liver composition analysis was obtained on fresh tissue collected immediately following euthanasia and exsanguination.
Oral glucose tolerance test (OGTT) and intraperitoneal insulin tolerance test (IPITT)
OGTT: Mice were fasted for 6 hours prior to gavage feeding with D-glucose (2 g/kg) (Sigma Aldrich). Blood was collected from the tail vein at 0, 15, 30, 60, 90, and 120 min after administration, and glucose was measured with a glucometer (AimStrip Plus, GERMAINE Lab, INC). IPITT: Mice were fasted for 4 hours prior to an intraperitoneal injection of insulin (1.5 U/kg for HFD-fed mice, and 0.5 U/kg for RCD-fed mice, respectively) (Sigma Aldrich). Blood was collected from the tail vein at 0, 15, 30, 45, 60, 120 min for glucose measurements as previously described.
Serum insulin, ghrelin, adiponectin, leptin, free fatty acid (FFA) and p-AKT/Total AKT measurement
Serum insulin, ghrelin, adiponectin, leptin and free fatty acid were measured with ultrasensitive mouse Insulin ELISA kits (Crystal Chem, #90080), Ghrelin (total) Elisa kit (#EZRGRT-91K, Millipore), Adiponectin ELISA kit (Crystal Chem, #80569), Leptin ELISA kit (Crystal Chem, #90030), free fatty acid quantification kit (MAK044-1KT, Sigma Aldrich) respectively, according to manufacturers’ instruction.
For p-AKT/Total AKT measurement, inguinal adipose tissue (iWAT) extracts were homogenized and lysed in RIPA buffer (ThermoFisher, #89901) containing protease and phosphatase inhibitors (Roche, cOmplete, EDTA-free Protease Inhibitor Cocktail, PhosSTOP). Total AKT and p-AKT levels in the cell lysates quantified using the p-AKT/Total AKT kit (PEL-AKT-S473-T-1, RayBiotech), as per manufacturer’s instructions.
Homeostasis model assessment of insulin resistance (HOMA-IR) and adipose tissue insulin resistance index (adipo-IR) calculation
HOMA- IR was calculated with the formula: glucose (mmol/L) x insulin (mU/L)/22.5. Adipo-IR was calculated with the formula: FFA (mmol/L) x insulin (pmol/L).
Stromal vascular fraction cell isolation and leucocytes isolation
Stromal vascular fraction (SVFs) from epididymal white adipose tissue (eWAT) depots and interscapular brown adipose tissue (BAT) depots were isolated before and after HFD induction or Regular Chow Diet (RCD) using collagenase D (Roche) and dispase II (Roche). Adipose tissue digestion was performed as described previously [Citation12]. SVF-enriched Leukocytes were used for Flow Cytometry analysis.
Flow cytometry analysis
Flow cytometric analysis was performed as previously described [Citation11]. Briefly, erythrocytes were removed from the SVFs digested tissue by adding red blood cell lysis buffer (Biolegend). Cell-surface antigens were assessed following rinse with 5% Bovine serum albumin – PBS plus blocking antibodies. Next, cells were stained with conjugated antibodies: F4/80-Phycoerythrin (catalogue no. 123110; clone BM8; Biolegend), CD11b-FITC (catalogue no. 101206; clone M1/70; Biolegend), CD206-APC (catalogue no. 141708; clone C068C2; Biolegend), CD11c-PE/Cy7 (catalogue no. 117318; clone N418; Biolegend), CD8a-PE (catalogue no. 100708; clone 53–6.7; Biolegend), CD4-FITC (catalogue no. 100406; clone GK1.5; Biolegend), CD3-APC (catalogue no. 100236; clone 17A2; Biolegend), and CD45-PE/Cy7 (catalogue no. 103114; clone 30-F11; Biolegend). Isotype control antibodies were used. The cells were washed and subsequently fixed with 2% paraformaldehyde. Analysis was performed by using a Canto II cytometer (Becton Dickinson). Data were processed with FlowJo Software (version 10 Becton Dickinson).
Statistical analysis
Statistical analyses were performed using unpaired t-tests or One-way ANOVA with GraphPad Prism 9. Statistical significance was accepted at a p-value of less than 0.05. P-values are represented as *p < 0.05; **p < 0.01; ***p < 0.001, ****p < 0.0001, respectively.
Results
Characterization of ADAM10 aKO mice
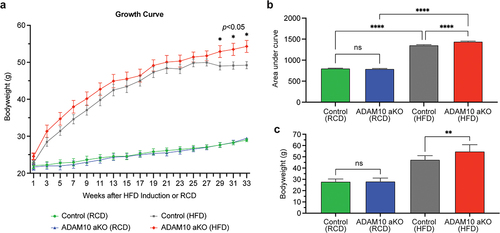
No differences in body weight were observed in ADAM10 aKO mice with RCD when compared to control littermates at 12 and 45 (12 + 33) weeks of age. In contrast, following 33 weeks of HFD diet ADAM10 aKO had significantly greater body weight gain compared to control littermates 54.8 ± 2.2 vs. 47.5 ± 1.26 gm±SEM, p = 0.028 ().
Figure 1. ADAM10 aKO mice following 33 weeks of HFD had significantly greater body weight gain compared to control littermates. (a): Body weight changes of control vs ADAM10 aKO mice on regular chow diet (RCD) and high fat diet (HFD). (b): Area Under the Curve (AUC) of control vs ADAM10 aKO mice on RCD and HFD. (c): Body weight of control vs ADAM10 aKO mice on RCD and HFD. Data are shown as mean±SEM. *p < 0.05, **p < 0.01, ***p < 0.001, ****p < 0.0001, ns: no statistical significance.
ADAM10 aKO mice demonstrate increased energy expenditure upon HFD challenge
We next characterized the energy expenditure (EE) of ADAM10 aKO and control mice while on RCD or HFD ().
Figure 2. ADAM10 aKO mice show increased energy expenditure following 33 weeks of HFD challenge. (a): Energy expenditure (Kcal/hour) of control vs ADAM10 aKO on RCD and HFD evaluated over a 72-hour period. (b): Energy expenditure (Kcal/hour) of control vs ADAM10 aKO on RCD and HFD. (c): Regression plot of full day energy expenditure, with ANCOVA analysis of energy expenditure of control vs ADAM10 aKO mice on RCD and HFD (RCD n: Control = 12, ADAM10 aKO = 11, HFD n: Control = 8, ADAM10 aKO = 7). (d): RER in full day of control vs ADAM10 aKO on RCD and HFD. (e): Cumulative food intake reported as Kcal of control vs ADAM10 aKO on RCD and HFD. (f): Locomotor activity of control vs ADAM10 aKO on RCD and HFD. Data are shown as mean±SEM *p < 0.05, **p < 0.01, ns: no statistical significance.
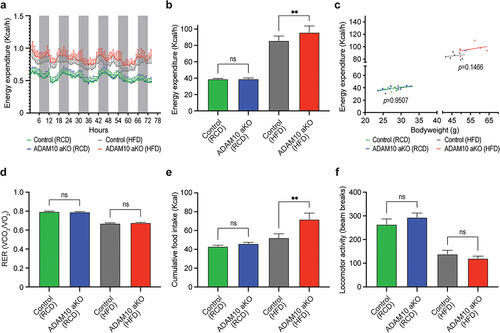
No difference in EE was observed in RCD-fed mice when compared with their control littermates. Conversely, HFD-fed ADAM10 aKO mice had significantly increased Energy Expenditure (EE) compared with control littermates. (). On the other hand, using weight-adjusted ANCOVA analysis, no significant difference in EE attributable to the genotype was observed both in RCD-fed and in HFD-fed ADAM10 aKO mice (). Respiratory Exchange Ratio (RER) was similar between groups both in RCD and HFD groups ().
Interestingly, while no difference was found in RCD-fed mice compared to their littermates, HFD-fed ADAM10 aKO mice had a significant increase in food consumption compared with their controls, (). A non-significant decrease in locomotor activity both for RCD-fed and HFD-fed was observed in ADAM10 aKO mice when compared with littermates ().
Collectively, this set of HFD-exposure experiments demonstrate that deletion of ADAM10 in adipose tissue alters energy metabolism in mice, and the differences in EE cannot be attributed to the genotype, but rather to the increase in body mass observed in the HFD-fed ADAM10 aKO.
Dietary modifications demonstrate divergent carbohydrate metabolism and insulin sensitivity profile in ADAM10 aKO mice
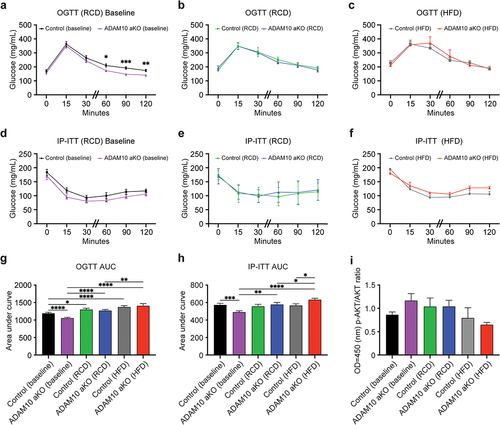
Significant differences in IP-ITT and OGTT were observed in RCD-fed ADAM10 aKO and littermates at baseline (12 weeks of age) (). Compared to littermates, ADAM10 aKO had reduced glucose Area Under the Curve (AUC) during both after OGTT and IP-IGTT () consistent with increased insulin sensitivity. Conversely, after 33 weeks, no difference was observed in fasting glucose and OGTT either on RCD or HFD (). At 33 weeks, HFD-fed ADAM10 aKO mice displayed an increase in IP-ITT glucose AUC compared to WT HFD mice (), indicating moderate insulin resistance. These data are consistent with a reverse of the phenotype displayed on RCD. Conversely, no differences were observed IP-ITT between RCD-fed ADAM10 aKO and littermates (). To further assess changes in insulin signalling, we measured total AKT and p-AKT levels in adipose tissue extracts. Consistent with the in vivo results, we observed a trend towards increase in p-AKT/AKT ratio in 12-weeks old RCD-fed aKO mice, and an opposite trend in HFD-treated AKO mice ().
Figure 3. HFD-fed ADAM10 aKO mice have impaired carbohydrate metabolism following 33 weeks of diet. (a): ADAM10 aKO vs control Baseline (12 weeks old RCD-fed mice) Oral Glucose Tolerance Test (OGTT). (b): ADAM10 aKO vs control RCD (12 weeks old +33 weeks RCD-fed mice) OGTT. (c): ADAM10 aKO vs control HFD (12 weeks old +33 weeks HFD-fed mice) OGTT. (d): ADAM10 aKO vs control Baseline (12 weeks old RCD-fed mice) intraperitoneal insulin tolerance test (IP-ITT). (e): ADAM10 aKO vs control RCD (12 weeks old +33 weeks RCD-fed mice) IP-ITT. (f): ADAM10 aKO vs control HFD (12 weeks old +33 weeks HFD-fed mice) IP-ITT. (g): Area under the curve (AUC) of ADAM10 aKO vs control from OGTT for all feeding condition. (h): AUC of ADAM10 aKO vs control from IP-ITT for all fed condition. (i): iWAT p-AKT/Total AKT ratio of control vs ADAM10 aKO mice for all fed condition. Data are shown as mean±SEM. *p < 0.05, **p < 0.01, ***p < 0.001, ****p < 0.0001, ns: no statistical significance.
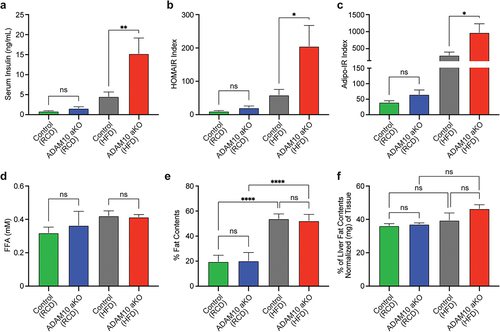
Serum insulin levels were significantly elevated in HFD-fed ADAM10 aKO compared with controls, while no differences were observed between RCD-fed ADAM10 aKO and controls (). Both HOMA-IR index () and Adipo-IR index () were significantly higher in HFD-fed ADAM10 aKO compared to controls, while no differences were observed between RCD-fed ADAM10 aKO and controls (). Finally, no differences were observed in FFA between the two genotypes both in HFD- and RCD-fed conditions ().
Figure 4. HFD-fed ADAM10 aKO mice have impaired insulin resistance following 33 weeks of diet. (a): Fasting serum insulin levels of control vs ADAM10 aKO mice on RCD and HFD. (b): HOMA IR index of control vs ADAM10 aKO mice on RCD and HFD. (c): Adipo-IR index of control vs ADAM10 aKO mice on RCD and HFD. (d): Fasting serum free fatty acid (FFA) of control vs ADAM10 aKO mice on RCD and HFD. (e): Percentage of fat mass of control vs ADAM10 aKO mice on RCD and HFD. (f): Percentage of liver fat content of control vs ADAM10 aKO mice on RCD and HFD. Data are shown as mean±SEM. *p < 0.05, **p < 0.01, ***p < 0.001, ****p < 0.0001, ns: no statistical significance.
HFD-fed ADAM10 aKO mice have no difference in total and hepatic fat content
No differences in total body composition were observed between genotypes either following RCD or HFD. As expected, a significant difference was observed within the same genotype between RCD and HFD interventions (). Compared to littermates, HFD-treated ADAM10 aKO showed a non-significant trend towards increases hepatic fat content. No differences between genotypes were observed following RCD ().
HFD-fed ADAM10 aKO mice have altered levels of adipokines and ghrelin
To assess the effects of adipose tissue-specific ADAM10 deletion on adipokine release, we measured serum Adiponectin and Leptin serum levels and Adiponectin/Leptin ratio, the latter an index of adipose tissue inflammation [Citation13].
Compared to littermates, HFD-fed ADAM10 aKO had lower Adiponectin levels, while no difference was found between RCD-fed ADAM10 aKO mice and littermates. While no difference was observed between RCD and HFD in ADAM10 aKO mice, the HFD-treated controls had a significant increase in Adiponectin ().
Figure 5. HFD-fed ADAM10 aKO mice have altered levels of Adipokines and Ghrelin. (a): Serum Adiponectin of control vs ADAM10 aKO mice on RCD and HFD. (b): Serum Leptin levels of control vs ADAM10 aKO mice on RCD and HFD. (c): Serum Ghrelin levels of control vs ADAM10 aKO mice on RCD and HFD. (d): Adiponectin/Leptin ratio of control vs ADAM10 aKO mice on RCD and HFD. Data are shown as mean±SEM. *p < 0.05, **p < 0.01, ***p < 0.001, ****p < 0.0001, ns: no statistical significance vs control.
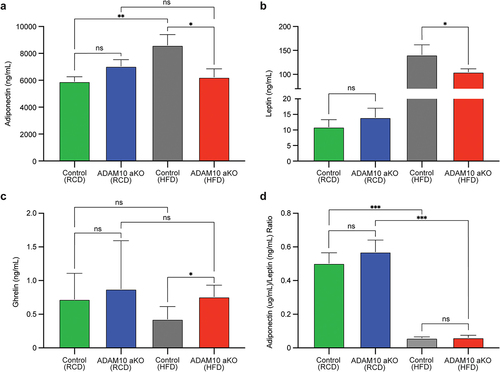
A significant reduction in serum Leptin levels was observed in HFD-fed ADAM10 aKO compared with their littermates, while no difference was found between genotypes in RCD-fed mice ().
Serum ghrelin levels were significantly elevated in HFD-fed ADAM10 aKO compared with their littermates, while no difference was found in RCD-fed mice ().
No differences were observed in Adiponectin/Leptin ratio between the two genotypes both in HFD- and RCD-fed conditions. Differences attributable to HFD- and RCD-fed condition were observed in Adiponectin/Leptin ratio within the same genotype. ().
HFD-fed ADAM10 aKO show an anti-inflammatory phenotype
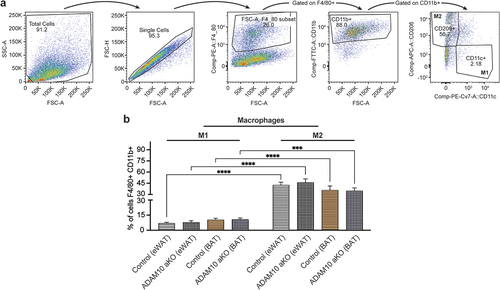
We next characterized the immune cells infiltrating the fat depots (eWAT and BAT) in HFD-fed ADAM10 aKO mice and respective littermates using multiparameter flow cytometry, following the gating strategies shown in (T CD4+/CD8+ Lymphocytes), and (M1/M2 Macrophages).
Figure 6. Following 33 weeks of HFD ADAM10 aKO mice show an anti-inflammatory phenotype – T lymphocytes population. (a): Gating strategy to detect T CD4+ Lymphocytes and T CD8+ Lymphocytes in fat depots (epidydimal white adipose tissue (eWAT) and brown adipose tissue (BAT)). (b): % CD45+ of total stromal vascular fraction in eWAT and BAT of control vs ADAM10 aKO mice. (c): % CD45+ CD3+ CD4+ CD8- or CD45+ CD3+ CD4- CD8+ of total stromal vascular fraction in eWAT and BAT of control vs ADAM10 aKO mice. Data are shown as mean±SEM. *p < 0.05, **p < 0.01, ***p < 0.001, ****p < 0.0001, ns: no statistical significance vs control.
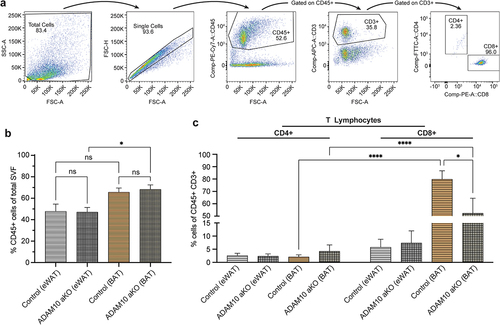
Figure 7. Following 33 weeks of HFD ADAM10 aKO mice show an anti-inflammatory phenotype – macrophages population. (a): Gating strategy to detect M1 Macrophages and M2 Macrophages in fat depots (epidydimal white adipose tissue (eWAT) and brown adipose tissue (BAT)). (b): % F4/80+ CD11b+ CD11c+ CD206- or F4/80+ CD11b+ CD11c- CD206+ of total Stromal vascular fraction in eWAT and BAT of control vs ADAM10 aKO mice. Data are shown as mean±SEM. *p < 0.05, **p < 0.01, ***p < 0.001, ****p < 0.0001, ns: no statistical significance vs control.
No differences were observed in total leukocytic (CD45+) infiltrate into eWAT and BAT between HFD-fed ADAM10 aKO mice and littermates. Interestingly, within the same genotypes, more CD45+ leukocytes were observed in BAT when compared with eWAT depots ().
Additionally, no difference in CD4+ and CD8+ T Lymphocytes populations infiltrating eWAT was observed in HFD-fed ADAM10 aKO mice and littermates. Conversely, the percentage of CD8+ lymphocytes infiltrating BAT depots was lower in HFD-fed ADAM10 aKO mice when compared to littermates (). When comparing eWAT to BAT depots, the main T Lymphocytes population in HFD-fed ADAM10 aKO mice and littermates were represented by CD8+ in BAT but not in eWAT ().
No difference was observed in M1 (F4/80+ CD11b+ CD11c+ CD206-) and M2 (F4/80+ CD11b+ CD11c- CD206+) macrophages infiltrating eWAT and BAT between HFD-fed ADAM10 aKO mice and littermates. Surprisingly, M2 was the main macrophage population in HFD-fed ADAM10 aKO mice and littermates, both in eWAT and BAT depots ().
Discussion
A sustained positive calorie overload results in excessive fat deposition that promotes a state of chronic inflammation which facilitates insulin resistance and the development of metabolic complications associated with obesity [Citation14–16].
Both innate and adaptive immune cells participate in obesity-linked inflammation, which may link obesity, insulin resistance, type 2 diabetes, and cardiovascular disease [Citation17].
To study the role of inflammation in adipose tissue and its effects on whole-body metabolism, we generated a murine model of impaired Notch signalling in adipocytes by targeting ADAM10 [Citation9]. The previously demonstrated pleiotropic actions of ADAM10 [Citation14–16] suggested it could play a role in adipose tissue homoeostasis and whole-organism metabolism, but very little is known about the function of ADAM10 in adipocyte biology and energy metabolism. To the best of our knowledge, our study is the first to characterize the effects of ADAM10 deletion in adipocytes, as well as its immunometabolism signature in response to obesity induction.
Previous studies have demonstrated that ADAM sheddase family, through their activation of the TNF-a signalling, are involved in inflammation, and indirectly to metabolic disorders, insulin resistance, and development of malignancy [Citation13,Citation18,Citation19].
The phenotype resulting from selective adipose tissue ADAM10 knock out had an intriguing metabolic dysmorphism relative to nutritional status. While at baseline (12-weeks old) RCD-fed ADAM10 aKO mice displayed increased insulin sensitivity when compared to controls, following prolonged HFD exposure ADAM10 aKO mice developed greater fat accumulation and mild insulin resistance when compared to controls. These changes were also associated with differences in adipokines and ghrelin between the two genotypes in HFD, while no significant differences were observed in RCD-fed mice.
Following HFD, ADAM10 aKO mice gained more weight and had increased EE and food intake without changes of RER or locomotor activity compared to littermates. Moreover, HFD ADAM10 aKO mice had significantly elevated serum insulin levels, driving the increase in HOMA-IR and Adipo-IR indexes. The differences in biochemical indices of insulin sensitivity were mirrored at a cellular level by the changes in pAKT/AKP ratios. Collectively, the data indicate that, in contrast to the baseline state, ADAM10 aKO mice exposed to prolonged HFD developed mild insulin resistance. The adipokine profile in HFD ADAM10 aKO mice shows a relative decrease in both adiponectin and leptin when compared to controls, while the adiponectin/leptin ratio is not different between the two genotypes, and it is consistent with a state of inflammation [Citation20]. Consistent with a relative decrease in leptin, ghrelin levels in HFD ADAM10 aKO mice were elevated.
We interpret these changes in the ADAM10 aKO mice as consistent with a state of attenuated adipose tissue inflammation at baseline, which in turns promotes a blunted response in leptin following prolonged exposure to calorie overload, leading to increase in food intake and greater propensity to gain weight. Ultimately, excess adiposity overcomes the beneficial effects of a reduced adipose tissue inflammation (as indicated by the lower adiponectin levels), resulting in a state of moderate insulin resistance. The increase in EE is primarily due to the increase in mass, and not directly attributable to the genotype, as demonstrated by the ANCOVA analysis.
Macrophages display a high degree of plasticity and can adopt different effector-function states in response to microenvironmental cues [Citation21]. Both ADAM10 aKO mice and littermates manifested decreased Adipose tissue M1 and increased Adipose tissue M2 accumulation following prolonged HFD exposure. This finding appears contradictory to the literature, whereby the majority of studies indicate a bias towards a more M1-like phenotype in WAT following the induction of obesity, parallel to an increase in pro-inflammatory mediators [Citation22–26]. On the other hand, some studies indicate a gene signature enriched in anti-inflammatory genes in eWAT macrophages following HFD exposure [Citation27]. These apparently conflicting findings can be attributed to the duration of HFD exposure. Indeed, Shaul et al. have demonstrated that epididymal ATMs recruited in response to HFD express mixed M1/M2 and remodelling transcriptional profiles, and that these profiles become more M2-like with extended HFD feeding [Citation28] This is in line with our data since in our experimental model mice were exposed to prolonged HFD, 33 weeks.
Adiponectin has inhibitory effects on inflammation by reducing macrophage production of TNF-α and IL-6, maintaining macrophage tolerance. The decrease of adiponectin levels commonly observed in obesity reduces this effect rendering macrophages more sensitive to pro-inflammatory stimuli [Citation29]. Conversely, some human studies indicate that obesity is associated with increased numbers of M2 macrophages associated with increased areas of fibrosis [Citation16]. These data are in line with our results, since following HFD exposure both genotypes demonstrated only marginal changes in adiponectin. Additionally, HFD ADAM10 aKO mice had lower adiponectin levels when compared to littermates, consistent with a relative attenuation of adipose tissue inflammation. While inhibition of Notch signalling has been associated with suppression of M1 macrophage polarization and activation of M2 macrophages [Citation9,Citation14,Citation30,Citation31] we cannot completely ascribe our findings to this pathway since we observed no significant differences in macrophage populations between the two genotypes.
Obesity results in an increase of CD3+ cells in BAT, particularly the subset of CD3+ CD8+ T cells [Citation32]. Depletion of these cells limits macrophage infiltration in WAT and is associated with a decrease in inflammation and glucose intolerance [Citation33]. This is consistent with our findings of an increase in the number of CD8+ T cells in BAT following long term exposure to HFD, with the main subpopulation of CD45+ CD3+ cells. Conversely, the relative decrease in CD8+ cells in ADAM10 aKO HFD compared with control littermates is consistent with a genotype effect leading to a state of relative attenuated inflammation in BAT.
Our observations indicate that in HFD-exposed mice, compared to WAT, BAT is enriched in CD8+ lymphocytes. This is more evident in the WT genotype. We interpret these findings as a result of the increased vascularization and metabolism of BAT when compared to WAT depots [Citation34]. Indeed, previous studies have already demonstrated an increase of CD3+ CD8+ T cells in BAT [Citation30,Citation35], particularly following HFD exposure. The relative attenuation of the inflammatory phenotype observed in aKO is consistent with the modulation of the TNF-α signalling induced by the ADAM10 deletion.
We previously assessed the effects of adipose tissue-specific ablation of the closely related ADAM17. While ADAM17 deletion in adipocytes resulted in a reduction of macrophage and eosinophil populations following HFD, no significant changes in energy and carbohydrate metabolism were observed [Citation36]. Thus, when compared with ADAM10, adipose tissue ADAM17 deletion resulted in similar effects in the immune system with attenuated metabolic phenotype. We interpret these findings as redundancy in the ADAM sheddases. One might hypothesize that double deletion of ADAM10 and 17 in adipocytes may result in a more pronounced phenotype.
Conclusion
Collectively, our observations indicate that adipocyte abrogation of ADAM10 results in a mitigation of the inflammatory response leading to increased insulin sensitivity in young mice fed with regular diet. The increased insulin signalling in turn facilitates lipogenesis and fat accumulation when the mice are exposed to prolonged HFD. Ultimately, this mechanism becomes maladaptive leading to the development of a phenotype of obesity and mild insulin resistance despite an attenuated state of inflammation.
To some degree, this effect in the RCD-fed aKO may be comparable to the action of thiazolidinediones which increase insulin sensitivity but are also associated in vitro [Citation37,Citation38] and in vivo [Citation39] with increase in adipogenesis and weight gain [Citation40]. The selective modulation of the inflammation in adipose tissue could thus be exploited as a therapeutic tool, in combination with lifestyle modifications and calorie restriction, to improve insulin sensitivity and decrease the cardiovascular risk. We recognize that this is a very speculative hypothesis, and additional studies are necessary to assess the effects of ADAM sheddases modulation in adipose tissue.
Disclosure statement
No potential conflict of interest was reported by the author(s).
Additional information
Funding
References
- Andersson ER, Sandberg R, Lendahl U. Notch signaling: simplicity in design, versatility in function. Development. 2011;138(17):3593–12. doi: 10.1242/dev.063610
- Bi P, Kuang S. Notch signaling as a novel regulator of metabolism. Trends Endocrinol Metab. 2015;26(5):248–255. doi: 10.1016/j.tem.2015.02.006
- Guruharsha KG, Kankel MW, Artavanis-Tsakonas S. The notch signalling system: recent insights into the complexity of a conserved pathway. Nat Rev Genet. 2012;13(9):654–666. doi: 10.1038/nrg3272
- Kopan R, Ilagan MX. The canonical notch signaling pathway: unfolding the activation mechanism. Cell. 2009;137(2):216–233. doi: 10.1016/j.cell.2009.03.045
- Wetzel S, Seipold L, Saftig P. The metalloproteinase ADAM10: A useful therapeutic target?. Biochim Biophys Acta, Mol Cell Res. 2017;1864(11 Pt B):2071–2081. doi: 10.1016/j.bbamcr.2017.06.005
- Seegar TCM, Killingsworth LB, Saha N, et al. Structural basis for regulated proteolysis by the alpha-secretase ADAM10. Cell. 2017;171(7):1638–48 e7. doi: 10.1016/j.cell.2017.11.014
- Fukuda D, Aikawa E, Swirski FK, et al. Notch ligand delta-like 4 blockade attenuates atherosclerosis and metabolic disorders. Proc Natl Acad Sci USA. 2012;109(27):E1868–77. doi: 10.1073/pnas.1116889109
- Bi P, Shan T, Liu W, et al. Inhibition of notch signaling promotes browning of white adipose tissue and ameliorates obesity. Nat Med. 2014;20(8):911–918. doi: 10.1038/nm.3615
- Farrar JS, Lownik JC, Way GW, et al. Identification of the transgene insertion site for an adipocyte-specific adiponectin-cre model and characterization of the functional consequences. Adipocyte. 2021;10(1):91–100. doi: 10.1080/21623945.2021.1880083
- Palaga T, Buranaruk C, Rengpipat S, et al. Notch signaling is activated by TLR stimulation and regulates macrophage functions. Eur J Immunol. 2008;38(1):174–183. doi: 10.1002/eji.200636999
- Huh JY, Kim JI, Park YJ, et al. A novel function of adipocytes in lipid antigen presentation to iNKT cells. Mol Cell Biol. 2013;33(2):328–339. doi: 10.1128/MCB.00552-12
- Kir S, White JP, Kleiner S, et al. Tumour-derived PTH-related protein triggers adipose tissue browning and cancer cachexia. Nature. 2014;513(7516):100–104. doi: 10.1038/nature13528
- Sikora-Skrabaka M, Walkiewicz KW, Nowakowska-Zajdel E, et al. ADAM10 and ADAM17 as biomarkers linked to inflammation, metabolic disorders and colorectal cancer. Curr Issues Mol Biol. 2022;44(10):4517–4527. doi: 10.3390/cimb44100309
- Hildebrandt X, Ibrahim M, Peltzer N. Cell death and inflammation during obesity: “Know my methods, WAT(son)”. Cell Death Differ. 2023;30(2):279–292.
- Reilly SM, Saltiel AR. Adapting to obesity with adipose tissue inflammation. Nat Rev Endocrinol. 2017;13(11):633–643. doi: 10.1038/nrendo.2017.90
- Spencer M, Yao-Borengasser A, Unal R, et al. Adipose tissue macrophages in insulin-resistant subjects are associated with collagen VI and fibrosis and demonstrate alternative activation. Am J Physiol Endocrinol Metab. 2010;299(6):E1016–27. doi: 10.1152/ajpendo.00329.2010
- Wu H, Ballantyne CM. Metabolic inflammation and insulin resistance in obesity. Circ Res. 2020;126(11):1549–1564. doi: 10.1161/CIRCRESAHA.119.315896
- Menghini R, Fiorentino L, Casagrande V, et al. The role of ADAM17 in metabolic inflammation. Atherosclerosis. 2013;228(1):12–17. doi: 10.1016/j.atherosclerosis.2013.01.024
- Matthews J, Villescas S, Herat L, et al. Implications of ADAM17 activation for hyperglycaemia, obesity and type 2 diabetes. Biosci Rep. 2021;41(5). doi: 10.1042/BSR20210029
- Fruhbeck G, Catalan V, Rodriguez A, et al. Adiponectin-leptin ratio is a functional biomarker of adipose tissue inflammation. Nutrients. 2019;11(2):454. doi: 10.3390/nu11020454
- Gordon S, Taylor PR. Monocyte and macrophage heterogeneity. Nat Rev Immunol. 2005;5(12):953–964. doi: 10.1038/nri1733
- Villarroya F, Cereijo R, Villarroya J, et al. Toward an understanding of how immune cells control brown and beige adipobiology. Cell Metab. 2018;27(5):954–961. doi: 10.1016/j.cmet.2018.04.006
- Fujisaka S, Usui I, Bukhari A, et al. Regulatory mechanisms for adipose tissue M1 and M2 macrophages in diet-induced obese mice. Diabetes. 2009;58(11):2574–2582. doi: 10.2337/db08-1475
- Wellen KE, Hotamisligil GS. Inflammation, stress, and diabetes. J Clin Invest. 2005;115(5):1111–1119. doi: 10.1172/JCI25102
- Olefsky JM, Glass CK. Macrophages, inflammation, and insulin resistance. Annu Rev Physiol. 2010;72(1):219–246. doi: 10.1146/annurev-physiol-021909-135846
- Donath MY, Shoelson SE. Type 2 diabetes as an inflammatory disease. Nat Rev Immunol. 2011;11(2):98–107. doi: 10.1038/nri2925
- Silva HM, Bafica A, Rodrigues-Luiz GF, et al. Vasculature-associated fat macrophages readily adapt to inflammatory and metabolic challenges. J Exp Med. 2019;216(4):786–806. doi: 10.1084/jem.20181049
- Shaul ME, Bennett G, Strissel KJ, et al. M2-like remodeling phenotypes of CD11c+ adipose tissue macrophages during high-fat diet–induced obesity in mice. Diabetes. 2010;59(5):1171–1181. doi: 10.2337/db09-1402
- Tsatsanis C, Zacharioudaki V, Androulidaki A, et al. Adiponectin induces TNF-α and IL-6 in macrophages and promotes tolerance to itself and other pro-inflammatory stimuli. Biochem Biophys Res Commun. 2005;335(4):1254–1263. doi: 10.1016/j.bbrc.2005.07.197
- Foldi J, Chung AY, Xu H, et al. Autoamplification of notch signaling in macrophages by TLR-induced and RBP-J-dependent induction of Jagged1. J Immunol. 2010;185(9):5023–5031. doi: 10.4049/jimmunol.1001544
- Boonyatecha N, Sangphech N, Wongchana W, et al. Involvement of notch signaling pathway in regulating IL-12 expression via c-rel in activated macrophages. Mol Immunol. 2012;51(3–4):255–262. doi: 10.1016/j.molimm.2012.03.017
- Mills EL, Harmon C, Jedrychowski MP, et al. Cysteine 253 of UCP1 regulates energy expenditure and sex-dependent adipose tissue inflammation. Cell Metab. 2022;34(1):140–57 e8. doi: 10.1016/j.cmet.2021.11.003
- Nishimura S, Manabe I, Nagasaki M, et al. CD8+ effector T cells contribute to macrophage recruitment and adipose tissue inflammation in obesity. Nat Med. 2009;15(8):914–920. doi: 10.1038/nm.1964
- Ni B, Chen S, Ryan KA, et al. Selective adipocyte loss of angiopoietin-2 prompts female-specific obesity and metabolic syndrome. Mol Metab. 2022;65:101588. doi: 10.1016/j.molmet.2022.101588
- Moysidou M, Karaliota S, Kodela E, et al. CD8+ T cells in beige adipogenesis and energy homeostasis. JCI Insight. 2018;3(5). doi: 10.1172/jci.insight.95456
- Lownik JC, Farrar JS, Pearce JV, et al. Adipocyte ADAM17 plays a limited role in metabolic inflammation. Adipocyte. 2020;9(1):509–522. doi: 10.1080/21623945.2020.1814544
- Hiragun A, Sato M, Mitsui H. Preadipocyte differentiation in vitro: identification of a highly active adipogenic agent. J Cell Physiol. 1988;134(1):124–130. doi: 10.1002/jcp.1041340115
- Sandouk T, Reda D, Hofmann C. Antidiabetic agent pioglitazone enhances adipocyte differentiation of 3T3-F442A cells. Am J Physiol. 1993;264(6 Pt 1):C1600–8. doi: 10.1152/ajpcell.1993.264.6.C1600
- Yki-Jarvinen H. Thiazolidinediones. N Engl J Med. 2004;351(11):1106–1118. doi: 10.1056/NEJMra041001
- Tang W, Zeve D, Seo J, et al. Thiazolidinediones regulate adipose lineage dynamics. Cell Metab. 2011;14(1):116–122. doi: 10.1016/j.cmet.2011.05.012