
 ?Mathematical formulae have been encoded as MathML and are displayed in this HTML version using MathJax in order to improve their display. Uncheck the box to turn MathJax off. This feature requires Javascript. Click on a formula to zoom.
ABSTRACT
Metabolism reprogramming within the tumor microenvironment (TME) can have a profound impact on immune cells. Identifying the association between metabolic phenotypes and immune cells in lung adenocarcinoma (LUAD) may reveal mechanisms of resistance to immune checkpoint inhibitors (ICIs). Metabolic phenotypes were classified by expression of metabolic genes. Somatic mutations and transcriptomic features were compared across the different metabolic phenotypes. The metabolic phenotype of LUAD is predominantly determined by reductase-oxidative activity and is divided into two categories: redoxhigh LUAD and redoxlow LUAD. Genetically, redoxhigh LUAD is mainly driven by mutations in KEAP1, STK11, NRF2, or SMARCA4. These mutations are more prevalent in redoxhigh LUAD (72.5%) compared to redoxlow LUAD (17.4%), whereas EGFR mutations are more common in redoxlow LUAD (19.0% vs. 0.7%). Single-cell RNA profiling of pre-treatment and post-treatment samples from patients receiving neoadjuvant chemoimmunotherapy revealed that tissue-resident memory CD8+ T cells are responders to ICIs. However, these cells are significantly reduced in redoxhigh LUAD. The redoxhigh phenotype is primarily attributed to tumor cells and is positively associated with mTORC1 signaling. LUAD with the redoxhigh phenotype demonstrates a lower response rate (39.1% vs. 70.8%, p = 0.001), shorter progression-free survival (3.3 vs. 14.6 months, p = 0.004), and overall survival (12.1 vs. 31.2 months, p = 0.022) when treated with ICIs. The redoxhigh phenotype in LUAD is predominantly driven by mutations in KEAP1, STK11, NRF2, and SMARCA4. This phenotype diminishes the number of tissue-resident memory CD8+ T cells and attenuates the efficacy of ICIs.
Introduction
Lung cancer is the leading cause of cancer-related mortality worldwide.Citation1 In recent years, Immune checkpoint inhibitors (ICIs) targeting PD-1 or PD-L1 have increased the five-year overall survival rate from 8.5% to 21.9% in patients with advanced non-small cell lung cancer (NSCLC).Citation2 However, approximately half of NSCLC do not respond to ICIs and exhibit a poor prognosis, highlighting an unmet clinical need.Citation3 On the one hand, a robust predictive biomarker is needed to identify patients who will respond to ICIs. On the other hand, the mechanism underlying primary resistance to ICIs is still not fully understood.
Metabolic reprogramming is a recognized hallmark of cancer.Citation4 Cancer cells genetically and epigenetically alter their metabolism to meet their bioenergetic and biosynthetic demands. Tumor metabolism demonstrates individual heterogeneity, affected by genetic and environmental factors.Citation5 Recently, an association between diverse bioenergetic phenotypes and metabolic dependencies has been identified in NSCLC, suggesting that metabolic dependency of cancer can result in specific metabolic phenotypes.Citation6 Emerging evidence suggests that competition for nutrients between tumor and immune cells, as well as by-products of tumor cells within the tumor microenvironment (TME), substantially affects anti-tumor immunity.Citation7 Upregulation of glutamine metabolism in cancer cells can lead to glutamine depletion, suppressing T cell proliferation and differentiation.Citation8,Citation9 Tumor-derived metabolites such as fumarate and kynurenine can weaken antitumor immunity by reducing the anti-tumor capacity of CD8+ T cellsCitation10 and promoting regulatory T cell expansion.Citation11,Citation12 This metabolic interplay helps the tumor to evade immune surveillance.Citation13
Given that the complex interplay of metabolism within the TME can have a profound impact on immune cells, it is important to advance our understanding of these diverse metabolic phenotypes in the TME. Identifying the association between metabolic phenotypes and immune cells, especially CD8+ T cells, may reveal mechanisms of primary resistance to ICIs and help discover predictive biomarkers. To address the questions above, we classified the metabolic phenotypes of lung adenocarcinoma (LUAD), the most common pathological subtype of lung cancer. The mechanisms shaping these metabolic phenotypes, as well as their impact on CD8+ T cells are investigated.
Material and methods
Study design
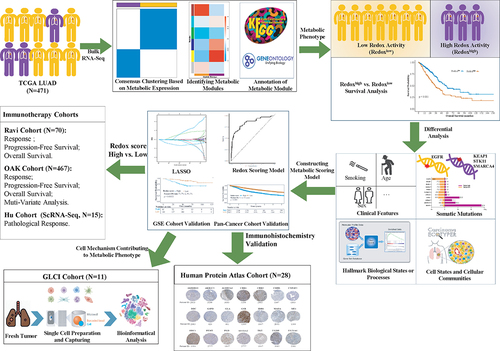
A study flowchart was illustrated in . Metabolic phenotypes in The Cancer Genome Atlas (TCGA) LUAD cohort were classified using unsupervised consensus clustering based on the RNA expression profiles of metabolic genes. The dataset was split into a training set and a validation set at a 7:3 ratio to establish a metabolic scoring model. Somatic mutations and transcriptomic features were compared across the different metabolic phenotypes. The mechanisms shaping these metabolic phenotypes and their impact on CD8+ T cells were investigated by single cell profiling analysis of treatment-naïve or neoadjuvant chemoimmunotherapy samples. Furthermore, the impact of metabolic phenotypes on the efficacy of ICIs was investigated in two independent immunotherapy cohorts.
Figure 1. Overview of study flow chart.
Patient cohorts
Discovery cohorts
LUAD patients with paired RNA sequencing and whole-exome sequencing data (n = 471) were included from TCGA. An additional LUAD cohort (n = 204) from the Gene Expression Omnibus (GSE31210)Citation14 and a pan-cancer cohort from TCGA (n = 10,103) were used to validate the prognostic stratification capability of the metabolic scoring model.
Immunotherapy cohorts
Two independent immunotherapy cohorts (the Ravi cohort and the OAK cohort) were included to compare the efficacy of ICIs between metabolic phenotypes.Citation15,Citation16 The inclusion criteria were LUAD histology, the availability of RNA-seq data, confirmed response, and availability of progression-free survival (PFS) and overall survival (OS) data. Responders were defined as patients achieving a partial or complete response, or stable disease with PFS of at least six months. Non-responders were those with disease progression or stable disease with PFS of less than six months. The response rate was defined as the ratio of responders to the sum of responders and non-responders.
Single-cell RNA sequencing cohorts
Eleven fresh tumor tissues from ten NSCLC patients undergoing lung surgery were obtained at the Guangdong Lung Cancer Institute, Guangdong Provincial People’s Hospital (GLCI cohort). Following surgical resection, samples were immediately processed for tissue preparation and single-cell RNA sequencing (scRNA-seq). The metabolic phenotype shaping mechanism and impact on CD8+T cells were explored in this scRNA-seq cohort. Additionally, another scRNA-seq cohort, which included three pre-treatment and twelve post-treatment samples from fifteen NSCLC patients who had received neoadjuvant chemoimmunotherapy, was included as a validation cohort (Hu cohort).Citation17 This study was approved by the Ethics Committee of Guangdong Provincial People’s Hospital (approval No. GDRECKY2020-199-01). The study adhered to the principles of the Declaration of Helsinki.
Classifying metabolic phenotypes
A total of 1,540 metabolic genes were gathered from 84 pathways involving human metabolism in the Kyoto Encyclopedia of Genes and Genomes (KEGG) database (Supplemental Table S1). Metabolic phenotypes were classified by unsupervised consensus clustering algorithm based on RNA expression of the metabolic genes. Key metabolic modules were identified by the weighted gene co-expression network analysis (WGCNA) in each metabolic phenotype. Metabolic modules were annotated by the Gene Ontology (GO) and KEGG pathway using clusterProfiler (version 4.8.2). Metabolic flux balance was assessed using METAFlux to substantiate the metabolic phenotype.Citation18
Analysis of molecular features and tumor ecosystem
Somatic variants identified by the MuTect2 pipeline were analyzed and visualized using maftools (version 2.16.0). We compared frequently mutated genes (≥5%) between metabolic phenotypes. Copy number aberrations at the gene level were also analyzed across metabolic phenotypes. The signature scores of the hallmark gene sets from the Molecular Signatures Database, and those of the tissue-resident memory CD8+ T cells (CD8+ Trm) (CD8A, CD8B, CD69, CD103), were calculated using GSVA (version 1.48.3). Cell communities and states were identified using EcoTyper.Citation19 Cell composition and cell abundance were compared between metabolic phenotypes. Abundance of twenty-four immune cell was also estimated by ImmuCellAI.Citation20
Establishment of the redox scoring model
The least absolute shrinkage and selection operator (LASSO) binomial analysis was performed to reduce redundant metabolic genes. Ten-fold cross-validation was used and lambda.min was chosen. Logistic regression model was used to construct the redox scoring model. Expression of selected genes was normalized as follows: normalizedGenei = (genei *10^5)/[ACTBi*(gene1+gene2+ … +genei)]. genei and ACTBi indicates expression level of selected gene and actin beta (ACTB). The standard deviation of our normalization approach was the smallest when compared with those of other gene expressions, suggesting its stability across tumor samples (Supplemental Fig S1A). Redox score was calculated as: redox score =. Coei is the corresponding model coefficient for the gene. Cut-off point to define low or high redox score was derived in corresponding datasets using maximally selected rank statistics method.
Immunohistochemistry validation
Twenty-eight patients diagnosed with LUAD from the Human Protein Atlas (https://www.proteinatlas.org/) were included. The expression of genes in the redox scoring model was evaluated by immunohistochemistry in the tumor tissue. Staining intensity was evaluated as negative, weak, moderate, or strong; the fraction of stained cells was evaluated as < 25%, 25–75%, or > 75%.
Single cell RNA sequencing
Single-cell RNA-seq experiment was performed by NovelBio Bio-Pharm Technology Co., Ltd. The detailed method of scRNA-seq pipeline were the same as previous described.Citation21 The Seurat package (version 4.3.0.1) was employed to create the object, filtering out cells of poor quality. The library size was normalized using the Seurat function NormalizeData. The top 2000 variable genes, identified by the FindVariableFeatures function, were used for principal components analysis. The top 10 principal components were retained for uniform manifold approximation and projection visualization and clustering. Batch effects were corrected using the fastMNN function from the batchelor package (version 1.16.0), employing the mutual nearest-neighbor method. Cell clustering was conducted using the FindClusters function with a graph-based clustering method. Marker genes were identified using the FindAllMarkers function with the Wilcoxon rank-sum algorithm, under the criteria: lnFC > 0.25, p < 0.05, and min.pct >0.1. Cell types were manually annotated based on representative cell markers. Malignant cells were identified by inferCNV analysis. Redox signature and mTORC1 signaling were quantified using the AddModuleScore function.
Cell-cell communication analysis
We performed Nichenet analysisCitation22 to infer the interactions between tumor cells and CD8+ T cells. Considering genes expressed in more than 10% of cells in each cluster, we extracted the top 20 ligands and top 30 receptor targets based on differential expression between ‘sender cells’ (tumor cells) and ‘receiver cells’ (CD8+T cells) for paired ligand-receptor activity analysis. Tumor cells with a low redox signature served as reference cells, and feature genes of CD8+Trm cells were identified as differentiating genes.
Statical analysis
Continuous variables were compared using the Wilcoxon rank-sum test. Categorical data were analyzed using the chi-square test or Fisher’s exact test. Kaplan-Meier curve was used to estimate median OS and PFS. Survival significance between groups was assessed using the log-rank test. Odds ratios (ORs) and 95% confidence intervals (CIs) for confounding factors were calculated via binary logistic regression analysis. Hazard ratios (HRs) and 95% CIs were computed using Cox proportional hazards survival analysis. The Spearman test was used to quantify the strength of the association between variables. A two-sided p-value of less than 0.05 was considered statistically significant unless if indicated. All statistical analyzes were conducted using R software (version 4.3.0).
Results
Metabolic clustering distinguishes a metabolic phenotype of high reductase-oxidative activity in LUAD
The TCGA LUAD cohort was clustered into two metabolic phenotypes (k = 2, Cluster A and Cluster B) (). Cluster B demonstrated decreased OS compared to Cluster A (, p < 0.001). Multivariate analysis identified Cluster B (HR: 1.51, p = 0.016) and stage (HR: 2.33, p < 0.001) as independent risk factors for OS (Supplemental Fig S1B), with stratified survival analysis indicating a decrease in OS for both early and advanced stages in Cluster B (Supplemental Fig S1C).
Figure 2. Identification of metabolic phenotypes in lung adenocarcinoma. (a) Two metabolic phenotypes of LUAD (Cluster a and (b) identified by unsupervised consensus clustering. (b) Kaplan–Meier analysis reveal poor prognosis in Cluster B. (c) a dendrogram of clustered genes in WGCNA, with each color representing a co-expressed gene module and each branch representing a gene. (d) Correlation heatmap showing the relationship between metabolic phenotypes and metabolic gene modules. Numbers indicate the correlation coefficient, followed by a statistical p-value in parentheses. (e) Differential expression analysis of three gene modules (MEbrown, MEyellow, and MEblue) between two metabolic phenotypes. (f) Cluster B identified as LUAD with high reductase-oxidative activity (redoxhigh LUAD). (g) Output of superoxide anion (O2-) and pathway score of ROS detoxification analyzed by metabolic flux balance. LUAD, lung adenocarcinoma.
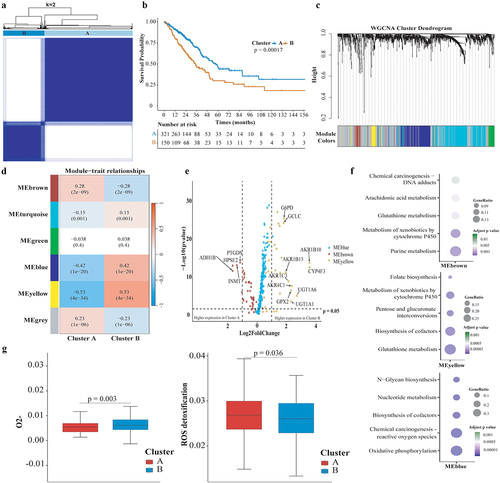
Five metabolic gene modules were identified by WGCNA between two metabolic phenotypes (). MEyellow module was the most significantly associated with Cluster B (r = 0.53, p < 0.001), followed by MEblue (r = 0.42, p < 0.001), while MEbrown module was more associated with Cluster A (r = 0.28, p < 0.001) (). Expression of MEbrown module genes tended to be higher in Cluster A, while MEyellow or MEblue module genes were more expressed in Cluster B (, Supplemental Table S2). Compared with Cluster A, oxidative phosphorylation, reactive oxygen species (ROS) production and reductive stress pathways (glutathione metabolism, biosynthesis of cofactors, pentose and guluronate interconversions) were significantly enriched in Cluster B (). Metabolic flux balance analysis revealed a significant increase in superoxide anion (O2-) production in Cluster B (0.0056 vs. 0.0045, p = 0.003), with no marked difference observed for H2O2 or hydroxide (). Furthermore, the pathway scoring for ROS detoxification was reduced in Cluster B (0.0258 vs. 0.00269, p = 0.036), suggesting ROS accumulation (). These results indicate that Cluster B represents a metabolic phenotype characterized by high reductase-oxidative activity, termed redoxhigh LUAD, as opposed to Cluster A (redoxlow LUAD).
Redoxhigh LUAD was characterized as highly proliferative tumor driven by KEAP1/STK11/SMARCA4/NRF2 mutations
Analysis revealed no significant differences in age, smoking history, or clinical stage distribution between metabolic phenotypes, with the exception of a higher male prevalence in the redoxhigh LUAD (Supplemental Fig S2A). For somatic mutations, KEAP1 mutation (55.6% vs. 2.4%, p < 0.001), STK11 mutation (22.2% vs. 9.8%, p = 0.001), SMARCA4 mutation (16.3% vs. 4.6%, p < 0.001), and LRRIQ3 mutation (11.1% vs. 3.1%, p = 0.001) were significantly higher in redoxhigh LUAD, while EGFR mutation (0.7% vs. 19.0%, p < 0.001) was more common in redoxlow LUAD (). Despite NRF2 activating mutations occurring at a frequency (2.4%) below our initial threshold, a comparative analysis between phenotypes revealed a higher occurrence of NRF2 activating mutations within the redoxhigh phenotype (5.2% vs. 1.2%, p = 0.02). No difference was found in the mutation frequency of TP53 (52% vs. 44%) and KRAS (28% vs. 30%) between two metabolic phenotypes. EGFR mutation did not co-mutate with KEAP1, STK11, or SMARCA4 mutation (Supplemental Fig S2B). The incidence of AKR1C2 and AKR1C3 amplification were higher in the redoxhigh phenotype (AKR1C2: 10.5% vs. 0.6%, p = 0.03; AKR1C3: 9.7% vs. 0.6%, p = 0.04). It was noted that 75.0% (12/16) of patients with AKR1C2 or AKR1C3 amplification coexisted with mutations in STK11, SMARCA4, KEAP1, or NRF2. Copy number aberrations of STK11 (3.0% vs. 0.9%), KEAP1 (1.5% vs. 0.6%), SMARCA4 (4.5% vs. 0.6%), or NRF1 (3.0% vs. 0.9%) were numerically higher in the redoxhigh phenotype, though no statistical difference was observed.
Figure 3. Comparison of Molecular features and Enrichment Scores of Hallmark Gene Sets between Metabolic Phenotypes. (a) Volcano plots comparing somatic mutations across metabolic phenotypes, with the horizontal axis representing the odds ratio and the vertical axis representing the statistical significance; (b) Bar plot shows mutation frequencies of representative genes in redoxhigh and redoxlow LUAD; (c) Horizontal axis representing pathway signatures and the vertical axis representing statistical significance. Dots above the horizontal axis indicate pathways upregulated in redoxhigh LUAD, below indicate pathways upregulated in redoxlow LUAD.
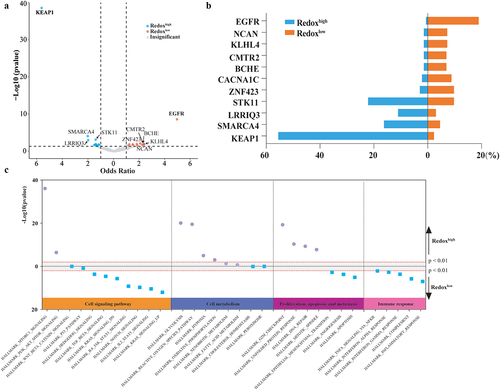
Cell proliferation (G2M checkpoint, unfolded protein response, DNA repair, and mitotic spindle) was more active in redoxhigh LUAD, while apoptosis and immune response pathways (inflammatory response, complement, interferon-γ and interferon-α response) were more active in redoxlow LUAD (). In cell signaling pathways, mTORC1 signaling was the most significantly elevated pathway in redoxhigh LUAD. In contrast, KRAS signaling, NOTCH signaling, IL2-STAT5, and IL6-JAK-STAT3 signaling were more prominent in redoxlow LUAD ().
Redoxhigh LUAD displays as an ecosystem lacking lymphocytes infiltration
The TME of LUAD was classified into ten carcinoma ecosystems (CE1-CE10) based on cell states and cellular communities (, Supplemental Table S3). CE2 was enriched in redoxhigh LUAD, while CE6 and CE10 were dominantly observed in redoxlow LUAD (). CE2 was characterized by an ecosystem rich in basal-like epithelial cells, pro-migratory-like fibroblasts and M2-like macrophages, but deficient in lymphocytes (Supplemental Table S3). CE6 was enriched for immune cells (normal-enriched B cells, resting CD4+ T cells, mature DCs, normal-enriched mast cells, M2-like macrophages, and activated neutrophils), stromal cells (normal-enriched endothelial cells and fibroblasts), and normal-enriched epithelial cells. CE10 was characterized as a proinflammatory tumor with abundant leukocytes, including naïve B cells, plasma cells, naïve/central memory CD4+ T cells, naïve/central memory CD8+ T cells, mast cells, monocytes, and cDC1s.
Figure 4. Comparative analysis of cell communities and states across metabolic Phenotypes. (a) Distribution of cell states and carcinoma ecotypes (CEs) within the TCGA LUAD cohort. The horizontal axis denotes tumor samples, while the vertical axis categorizes cell states (S01-S09) and their respective cell types (e.g., CD8+T cells) found in each tumor sample. The heatmap illustrates the proportion of each cell state within its corresponding cell type. CEs were identified by clustering the predominant cell state of each cell type within individual samples. Details on cell state annotation and marker genes are provided in Supplemental Table S3. (b) CE comparison across metabolic phenotypes. (c) Comparison of predominant cell states by cell type across metabolic phenotypes.
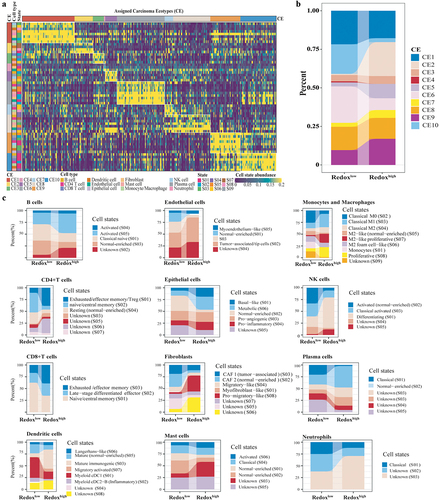
Distinct differences in cell state compositions were noted between the two metabolic phenotypes (). Metabolic epithelial cells were enriched in redoxhigh LUAD, while normal-enriched epithelial cells were prevalent in redoxlow LUAD. B cells, naïve/central memory CD4+ T cells, and naïve/central memory CD8+ T cells were more abundant in redoxlow LUAD, while the abundance of migratory and mature immunogenic DCs, tumor-associated endothelial cells, basal-like epithelial cells, pro-migratory fibroblasts, and M2-like proliferative macrophages was higher in redoxhigh LUAD (Supplemental Fig S3A). Estimations by ImmuCellAI also indicated lymphocytes enrichment in redoxlow LUAD, whereas myeloid cells were more prevalent in redoxhigh LUAD (Supplemental Fig S3B). Cytokines involved in T cell co-stimulation and the formation of tertiary lymphoid structures were significantly decreased in redoxhigh LUAD (Supplemental Fig S3C).
Redoxhigh phenotype is associated with poor prognosis in LUAD
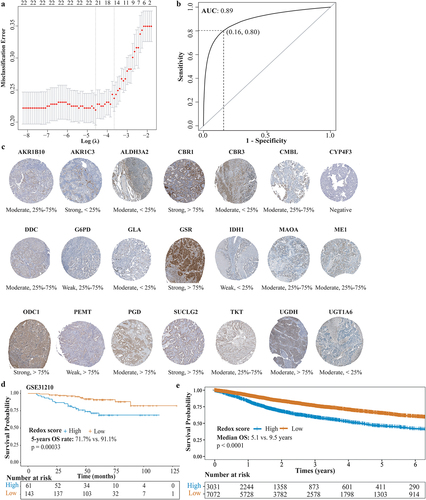
Thirty-nine hub genes from the MEyellow module were initially selected to construct the redox scoring model. Twenty-two genes were retained after LASSO regression (, Supplemental Table S4). The redox scoring model demonstrated good predictive ability for metabolic phenotypes with an area under the curve (AUC) of 0.89 (sensitivity: 0.84, specificity: 0.80) in the validation set (). High redox score was indicative of redoxhigh phenotype. Immunohistochemistry of tumor tissue validated the expression of genes in redox scoring model (, Supplemental Table S5). In the GSE31210 LUAD cohort, patients with high redox score showed significantly decreased OS (, 5-years OS rate: 71.7% vs. 91.1%, p = 0.00033). Similarly, pan-cancer patients with high redox score exhibited decreased OS (, median OS: 5.1 years vs. 9.5 years, p < 0.0001).
Figure 5. Construction and validation of redox scoring model in LUAD. (a) Tenfold cross-validation of the LASSO Cox regression model for tuning parameter selection, with the horizontal axis representing log(lambda) and the vertical axis representing misclassification error. (b) ROC curve analysis of redox scoring model for predicting metabolic phenotypes in the validation cohort. (c) the immunohistochemistry-based expression of genes from the redox scoring model in LUAD tumor tissues, utilizing data sourced from the Human Protein Atlas, not conducted in-house. (d) Kaplan–Meier analysis of OS between high and low redox score groups in the GSE31210 LUAD cohort. (e) Kaplan–Meier analysis of OS between high and low redox score groups in the TCGA pan-cancer cohort.
ScRNA-seq reveals the Redoxhigh phenotype is predominantly shaped by malignant cells
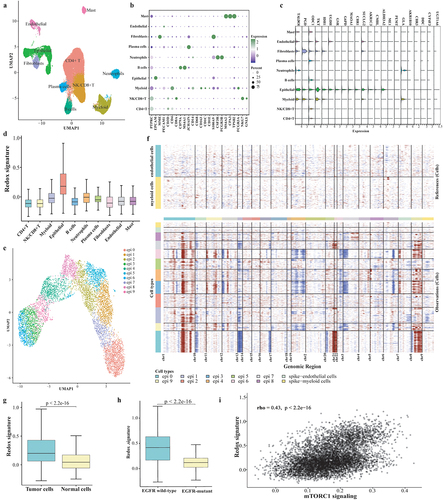
The clinical information of the GLCI cohort is listed in Supplemental Table S6. After quality control, transcriptomes from 44,352 cells were analyzed. Cell clusters were annotated as CD4+ T cells, NK/CD8+ T cells, myeloid cells, epithelial cells, B cells, neutrophils, plasma cells, fibroblasts, endothelial cells, and mast cells, based on the expression of canonical marker genes (). Notably, most metabolic genes were highly expressed in epithelial cells (), which also demonstrated the highest redox signature (). Epithelial cells were re-clustered into ten subclusters (epi 0 to epi 9), and all subclusters, except for epi 2, were annotated as malignant cells by inferCNV analysis (). The redox signature was significantly higher in malignant cells, as well as in EGFR wild-type tumors (p < 2.2e-16, ). The redox signature was positively associated with mTORC1 signaling in tumor cells (; rho = 0.43, p < 2.2e-16). These findings were also observed in the Hu cohort (Supplemental Fig S4).
Figure 6. ScRNA-seq analysis on the metabolic phenotype shaping mechanism. (a) UMAP plot of the 44,352 cells, visualizing the distribution and clustering of cell types. (b) Dot plot showcasing the expression of marker genes across all identified cell types. (c) Expression of twenty-two genes of redox scoring model in each cell type at the single-cell level. (d) Redox signature in each cell type. (e) Re-clustering of epithelial cells. (f) Results of identifying malignant cells by Infer-CNV analysis. (g) Comparison of redox signature between malignant cells and normal cells or between EGFR wild-type epithelial cells and EGFR-mutant epithelial cells. (h) the correlation between mTORC1 signaling and redox signature.
Redoxhigh phenotype leads to a diminished presence of tissue-resident memory CD8+T cells
We next focused on the impact of redox activity on CD8+ T cells, the direct anti-tumor lymphocytes. A total of 5,743 CD8+ T cells in the GLCI cohort were re-clustered into nine subclusters, including four central memory CD8+ T cells (Tcm1–4), two effector memory CD8+ T cells (Tem1–2), two tissue-resident memory CD8+ T cells (Trm1–2), and one cytotoxic CD8+ T cell (Tcyt) (). Trm1 and Trm2 highly expressed the tissue-resident marker CD103 (ITGAE) and immune checkpoints including LAG3, TIGIT, PDCD1, HAVCR2, and CTLA-4 (). No difference was observed in the composition of CD8+ T cells between patients with a high and low redox signature (p > 0.05, ). However, the abundance of CD8+ Trm, CD8+ Tcm, CD8+ Tem, and CD8+ Tcyt was negatively correlated with the redox signature (). An evaluation of the CD8+ Trm signature alongside specific Trm markers (CD69 and CD103) through RNA expression profiling by tissue microarray from the GSE31210 cohort revealed that both the Trm marker CD69 (p = 0.004) and the CD8+ Trm signature (p = 0.031) were significantly diminished in redoxhigh LUAD (). The Nichenet analysis revealed that high redox-signature tumor cells exhibited increased ligand expression of FGA, TIMP1, FURIN, while showing decreased expression of HLA-E, CCL4, CCL2, S100A9, and TYROBP ().
Figure 7. The association between redox signature and CD8+T cells. (a) Re-clustering of CD8+T cells. (b) Normalized Z-score expression of marker genes in subtypes of CD8+T cells. (c) Proportions of subtypes of CD8+T cells in individual samples (up) and across redoxhigh and redoxlow (bottom). (d) Correlation between redox signature and abundance of CD8+T cells. (e) Analysis of CD8+Trm signature, expression of specific Trm markers (CD69 and CD103) using tissue RNA microarray of GSE31210GSE cohort without EGFR mutation. (f) Predicted modulation of tumor cells to CD8+T cells by NicheNet. Relative expression of predicted ligands in tumor cells of redoxhigh vs. redoxlow (the left panel) and heatmap showing the interaction potential of top-ranked ligands in tumor cells with corresponding receptors in CD8+T cells (the right panel). (g) Expression of cytotoxic chemokines, MKI67, and CXCL13 in CD8+T cells at pre-treatment and post-treatment of neoadjuvant chemoimmunotherapy. (h) Expression of cytotoxic chemokines, MKI67, and CXCL13 in CD8+T cells between MPR and NMPR after neoadjuvant chemoimmunotherapy. (i) Abundance of CD8+T cells at pre-treatment and post-treatment of neoadjuvant chemoimmunotherapy in Hu cohort. (j) Abundance of CD8+T cells in major pathological response (MPR) and non-major pathological response (NMPR) after neoadjuvant chemoimmunotherapy (post-treatment) in Hu cohort. Trm, tissue-resident memory T cell; Tcyt, cytotoxic T cell; Tem, effector memory T cell; Tcm, central memory T cell.
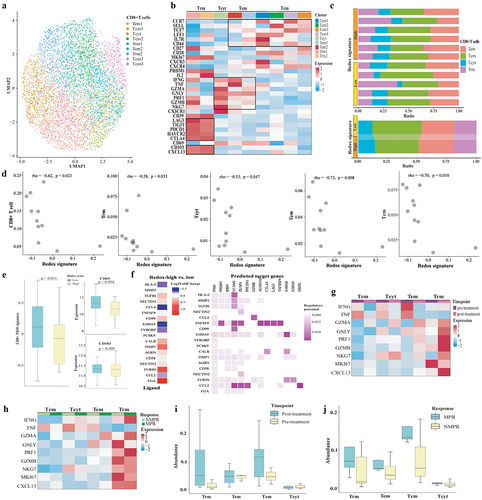
We further compared the abundance of CD8+ T cells before and after neoadjuvant chemoimmunotherapy in the Hu cohort. We utilized the ProjecTILsCitation23 to annotate cell states of CD8+T cells in the Hu cohort, with the GLCI cohort’s CD8+T cell states serving as a reference (Supplemental Fig S4E). The expression of cytotoxic chemokines (GZMA, GNLY, PRF1, GZMB) in Trm was found to increase after neoadjuvant chemoimmunotherapy, as shown in . Interestingly, there was no change observed between patients exhibiting a major pathological response (MPR) and those with a non-major pathological response (NMPR), according to . CXCL13, a chemokine crucial for the recruitment and activation of CXCR5+ CD8+ T cells, was predominantly expressed in Trm cells and saw enhanced expression after treatment. Moreover, the abundance of Trm was numerically greater in patients post-neoadjuvant chemoimmunotherapy, including in those with MPR, with post-treatment versus pre-treatment levels at 0.051 versus 0.010 () and MPR versus NMPR at 0.070 versus 0.016 ().
Redoxhigh phenotype attenuates the efficacy of immune checkpoint inhibitors
Redox phenotypes were stratified by the redox scoring model: a high redox score indicated a redoxhigh phenotype while a low redox score indicated a redoxlow phenotype. Consistent with previous findings, KEAP1 and STK11 mutations were significantly higher in patients with a high redox score (KEAP1, high vs. low: 50.9% vs. 9.0%, p < 0.001; STK11, high vs. low: 39.6% vs. 20.5%, p = 0.025), whereas EGFR mutations were more prevalent in patients with a low redox score (16.7% vs. 1.9%, p = 0.016) (). PD-L1 expression (p = 0.245) and tissue tumor mutation burden (tTMB, p = 0.779) were similar between patients with low and high redox score.
Figure 8. Impact of metabolic phenotypes on response to ICIs in lung adenocarcinoma. (a) Distribution of tTMB, PD-L1 expression, KEAP1/STK11/EGFR/KRAS status in high and low redox score groups. (b) Comparison of response rate, PFS, and OS between high and low redox score groups in patients receiving immunotherapy in Ravi cohort. (c) Comparison of response rate, PFS, and OS between high and low redox score groups in OAK cohort patients receiving atezolizumab (upper) or docetaxel (lower). (d) ROC curve analysis comparing redox score (low vs. high), PD-L1 TPS (<1% vs. >1%), and tTMB (<16 vs. ≥16) in predicting responders to atezolizumab. (e) Changes of redox signature between pre-treatment and post-treatment or between patients achieved NMPR and MPR in neoadjuvant immunochemotherapy cohort. (f) Changes of mTORC1 signaling between pre-treatment and post-treatment or between patients achieved NMPR and MPR in neoadjuvant immunochemotherapy cohort. tTMB, tissue tumor mutation burden; PFS, progression-free survival; OS, overall survival; NMPR, non-major pathological response; MPR, major pathological response.
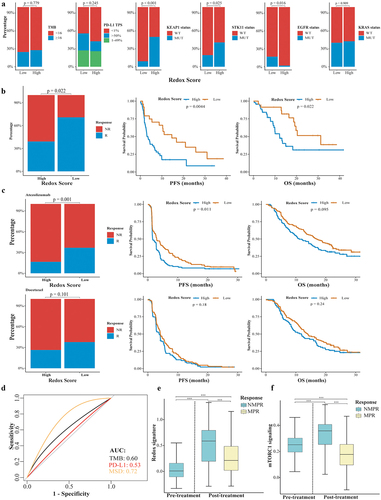
In the Ravi cohort, LUAD patients with a high redox score demonstrated a significantly decreased response rate (39.1% vs. 70.8%, p = 0.001), shorter PFS (3.3 vs. 14.6 months, p = 0.004), and OS (12.1 vs. 31.2 months, p = 0.022) compared to those with a low redox score (). In patients receiving atezolizumab in the OAK cohort, those with a high redox score also showed a decreased response rate (16.5% vs. 36.8%, p = 0.001), shorter PFS (1.6 vs. 3.0 months, p = 0.011), and OS (11.1 vs. 16.8 months, p = 0.095) (). For patients treated with docetaxel, no significant differences were observed in response rate (26.4% vs. 37.8%, p = 0.101), PFS (3.8 vs. 4.2 months, p = 0.18), and OS (10.5 vs. 14.3 months, p = 0.24) between the high and low redox score groups, indicating that the redox score may specifically predict immunotherapy outcomes (). In a multivariate analysis, a high redox score was an independent risk factor for response rate, PFS, and OS (Supplemental Fig S5). The AUC of the redox score, tTMB, and PD-L1 for predicting responders to atezolizumab was 0.72, 0.60, and 0.53 ().
The redox signature was higher in patients who did not achieve MPR (NMPR vs. MPR: 0.509 vs. 0.267, p < 0.001, ). Moreover, activity of mTORC1 signaling was significantly lower in patients who achieved an MPR (NMPR vs. MPR: 0.321 vs. 0.178, p < 0.001, ).
Discussion
Metabolic reprogramming within the TME profoundly impacts immune cells. Clarifying the interplay between genetic alterations and metabolic changes, and their collective role in immune evasion, is pivotal for the development of effective therapies to bypass immunotherapy resistance. Previous studies has found a link between high redox signatures,Citation24–27 mutations in genes associated with redox homeostasis (such as STK11 or KEAP1),Citation28–30 and adverse outcomes in lung cancer. However, the dynamic between metabolic states, specific genetic alterations, and TME composition in LUAD has not been fully elucidated. Our investigation highlights that a redoxhigh phenotype, predominantly induced by mutations in KEAP1, STK11, SMARCA4, and NRF2, results in a depletion of tissue-resident memory CD8+ T cells within the TME, undermining ICI efficacy. Hence, the metabolic phenotypes identified in our study offer valuable insights for patient stratification potentially responsive to ICIs or trials targeting metabolic pathways to alleviate oxidative stress.
The metabolic microenvironment of tumor is a focal point in current cancer research, but few studies have assessed whether specific metabolic phenotypes can serve as criteria for tumor classification or ICIs treatment before.Citation31 Our study revealed that metabolic phenotype of LUAD is dominantly decided by reductase-oxidative activity, divided into redoxhigh or redoxlow phenotype. The redoxhigh phenotype accounted for about 30% of LUAD patients. The reductase-oxidative activity involves oxidative stress and reduction reactions.Citation32 The imbalance of reductase-oxidative activity can lead to damage to DNA, proteins, and lipids within immune cells, contributing to immune evasion and tumor progression.Citation33 In our study, the mutation frequency of KEAP1, STK11, NRF1, and SMARCA4 was up to 72.5% in redoxhigh LUAD, compared to the mutation frequency of 17.4% in redoxlow LUAD. Copy number aberrations of KEAP1, STK11, NRF1, and SMARCA4 were low in this population (4.1% in total population). It suggested that the mutation of KEAP1, STK11, NRF1, and SMARCA4 are predominantly responsible for the redoxhigh phenotype. But not all KEAP1 mutations were associated with activation of the NRF2 pathway.Citation34 Recent two studies reported the utility of transcriptomic phenotypes to define KEAP1/NRF2-activated or STK11-deficient lung cancers, respectively.Citation35,Citation36 It is interesting that the gene sets applying for identifying the transcriptomic phenotypes were similar between two studies. It suggests that mutations of different genes can caused similar functional downstream effects.Citation37 It is supported by Arolt et al.‘s finding that SMARCA4 and CUL3 mutations act as mimics of KEAP1/NRF2 mutations.Citation36 In addition, our study found LRRIQ3 mutation was also significantly higher in redoxhigh LUAD. Taken together, redoxhigh phenotype represented similar functional downstream effects caused by aberrations of different genes.
Cellular communities and cell states within the TME were identified and validated in previous pan-cancer study,Citation19 but not illustrated and characterized based on metabolic phenotypes. Here, the TME of redoxhigh LUAD was displayed as an ecosystem with enriched metabolic epithelial cells and deficient lymphocytes, suggesting a prominent impact of reductase-oxidative activity on local immune activity. Deficiencies in STK11 or activation of the KEAP1/NRF2 pathway have been shown to promote ROS accumulation.Citation38,Citation39 This accumulation can lead macrophages to adopt an immunosuppressive phenotype, achieved through the activation of the NF-κB signaling pathway, which promotes PD-L1 transcription and the release of immunosuppressive chemokines.Citation40 Excess ROS can also selectively upregulate PAC1 in CD8+ T cells via the activation of EGR1.Citation41 PAC1 recruits the Mi-2β nucleosome-remodeling and histone-deacetylase complex, leading to chromatin remodeling of effector T cells, which ultimately results in the loss of their proliferative and effector capacities.Citation41 CD8+ Trm has been associated with the response to ICIs.Citation21,Citation42 In our study, the abundance and cytotoxic chemokines of CD8+ Trm increased in responders to ICIs after treatment. However, a high redox signature was associated with a decrease in CD8+ Trm within the TME, suggesting that redox activity reprogramming caused by genetic aberrations might impair CD8+ Trm. Our cell-cell communication analysis highlighted that FURIN was upregulated in high redox-signature tumor cells. Known for its overexpression in various malignancies and potential as an anti-tumor target, FURIN deficiency in T cells has been linked to impaired immune tolerance and accelerated immune responses.Citation43,Citation44 In mouse models, FURIN is instrumental in regulating the effector functions of cytotoxic T cells and in the development of CD103+ tissue-resident memory T cells.Citation45 Moreover, we noted a reduction in CCL4 expression, critical for recruiting CCR5+ CD8+ T cells,Citation46 in high redox-signature tumor cells. These observations suggest that redox-high tumor cells may employ multiple mechanisms to evade immunosurveillance, potentially contributing to resistance to ICIs. Further research is warranted to validate these findings and explore combining ICIs with anti-redox activity therapies as a strategy to counter immunotherapy resistance.
Several limitations exist in this study. Firstly, metabolic phenotyping is currently only applied to LUAD, and applicability to other tumors requires further study. Secondly, nearly 30% of redoxhigh LUAD could not be explained by the mutation and copy number aberration of KEAP1, STK11, NRF2, or SMARCA4, emphasizing that an elucidation of the impact of other genetic aberrations such as epigenetic modification might be needed in future studies. Thirdly, although the performance of redox scoring model to predict the efficacy of ICIs was validated in two independent cohorts, it still needs validation in a prospective cohort.
In summary, we discover a redoxhigh phenotype of LUAD that arises from tumor metabolic reprogramming. This redoxhigh phenotype is predominantly driven by mutations in KEAP1, STK11, and SMARCA4. The phenotype decreased number of tissue-resident memory CD8+ T cells within the TME, and it attenuates the efficacy of ICIs. Our metabolic phenotyping study provides new insights into the resistance mechanisms against ICIs and proposes the redox phenotype as a predictive biomarker for ICI responsiveness.
Supplemental Table.xlsx
Download MS Excel (88.3 KB)Supplemental Fig 3.tif
Download TIFF Image (2.9 MB)Supplemental Fig 1.tif
Download TIFF Image (1.7 MB)Supplemental Fig 4.tif
Download TIFF Image (3.6 MB)Supplemental Fig 5.tif
Download TIFF Image (1 MB)Supplementary Material.docx
Download MS Word (17.9 KB)Supplemental Fig 2.tif
Download TIFF Image (660.1 KB)Acknowledgments
We extend our gratitude to the Genentech Data Access Committee for granting access to RNA-seq and corresponding clinical data from the OAK trial.
Disclosure statement
Prof. Yi-Long Wu reports personal financial interests: consulting and advisory services, speaking engagements of Roche, AstraZeneca, Eli Lilly, Boehringer Ingelheim, Sanofi, MSM, and BMS. Prof. Qing Zhou reports lecture and presentations fees from AstraZeneca, Boehringer Ingelheim, BMS, Eli Lilly, MSM, Pfizer, Roche, and Sanofi outside the submitted work. The remaining authors declare no competing interests that may have influenced the reported work.
Data availability statement
TCGA datasets were available in https://portal.gdc.cancer.gov/. GEO dataset was available at the following URL: https://www.ncbi.nlm.nih.gov/geo/query/acc.cgi?acc= GSE31210. Single cell sequencing data of GLCI cohort and Hu cohort was available at the following URL: https://www.ncbi.nlm.nih.gov/geo/query/acc.cgi?acc= GSE171145 and https://www.ncbi.nlm.nih.gov/geo/query/acc.cgi?acc=GSE207422. Bulk RNA-seq and clinical data of OAK cohort was available upon request at the following URL: https://ega-archive.org/studies/EGAS00001005013. Bulk RNA-seq and clinical data of Ravi cohort was available at the following URL: https://www.nature.com/articles/s41588-023-01355-5. Request for other resources should be directed to the corresponding author.
Supplementary material
Supplemental data for this article can be accessed online at https://doi.org/10.1080/2162402X.2024.2340154
Additional information
Funding
References
- Siegel RL, Miller KD, Wagle NS, Jemal A. Cancer statistics, 2023. CA Cancer J Clin. 2023;73(1):17–14. doi:10.3322/caac.21763.
- de Castro G KI Jr., Wu YL, Wu Y-L, Lopes G, Kowalski DM, Turna HZ, Caglevic C, Zhang L, Karaszewska B, Laktionov KK. et al. Five-year outcomes with pembrolizumab versus chemotherapy as first-line therapy in patients with non–small-cell lung cancer and programmed death ligand-1 tumor proportion score ≥ 1% in the KEYNOTE-042 study. J Clin Oncol. 2023;41(11):1986–1991. doi:10.1200/JCO.21.02885.
- Vesely MD, Zhang T, Chen L. Resistance mechanisms to anti-PD cancer immunotherapy. Annu Rev Immunol. 2022;40(1):45–74. doi:10.1146/annurev-immunol-070621-030155.
- Hanahan D, Weinberg RA. Hallmarks of cancer: the next generation. Cell. 2011;144(5):646–674. doi:10.1016/j.cell.2011.02.013.
- Hensley CT, Faubert B, Yuan Q, Lev-Cohain N, Jin E, Kim J, Jiang L, Ko B, Skelton R, Loudat L. et al. Metabolic heterogeneity in human lung tumors. Cell. 2016;164(4):681–694. doi:10.1016/j.cell.2015.12.034.
- Han M, Bushong EA, Segawa M, Tiard A, Wong A, Brady MR, Momcilovic M, Wolf DM, Zhang R, Petcherski A. et al. Spatial mapping of mitochondrial networks and bioenergetics in lung cancer. Nature. 2023;615(7953):712–719. doi:10.1038/s41586-023-05793-3.
- Kaymak I, Williams KS, Cantor JR, Jones RG. Immunometabolic interplay in the tumor microenvironment. Cancer Cell. 2021;39(1):28–37. doi:10.1016/j.ccell.2020.09.004.
- Reinfeld BI, Madden MZ, Wolf MM, Chytil A, Bader JE, Patterson AR, Sugiura A, Cohen AS, Ali A, Do BT. et al. Cell-programmed nutrient partitioning in the tumour microenvironment. Nature. 2021;593(7858):282–288. doi:10.1038/s41586-021-03442-1.
- Lian G, Gnanaprakasam JR, Wang T, Wu R, Chen X, Liu L, Shen Y, Yang M, Yang J, Chen Y. et al. Glutathione de novo synthesis but not recycling process coordinates with glutamine catabolism to control redox homeostasis and directs murine T cell differentiation. Elife. 2018;7:e36158. doi:10.7554/eLife.36158.
- Cheng J, Yan J, Liu Y, Shi J, Wang H, Zhou H, Zhou Y, Zhang T, Zhao L, Meng X. et al. Cancer-cell-derived fumarate suppresses the anti-tumor capacity of CD8+ T cells in the tumor microenvironment. Cell Metab. 2023;35(6):961–978. doi:10.1016/j.cmet.2023.04.017.
- Quintana FJ, Basso AS, Iglesias AH, Korn T, Farez MF, Bettelli E, Caccamo M, Oukka M, Weiner HL. Control of T(reg) and T(H)17 cell differentiation by the aryl hydrocarbon receptor. Nature. 2008;453(7191):65–71. doi:10.1038/nature06880.
- Opitz CA, Litzenburger UM, Sahm F, Ott M, Tritschler I, Trump S, Schumacher T, Jestaedt L, Schrenk D, Weller M. et al. An endogenous tumour-promoting ligand of the human aryl hydrocarbon receptor. Nature. 2011;478(7368):197–203. doi:10.1038/nature10491.
- Joseph A, Juncheng P, Mondini M, Labaied N, Loi M, Adam J, Lafarge A, Astesana V, Obrist F, Klein C. et al. Metabolic features of cancer cells impact immunosurveillance. J Immunother Cancer. 2021;9(6):e002362. doi:10.1136/jitc-2021-002362.
- Okayama H, Kohno T, Ishii Y, Shimada Y, Shiraishi K, Iwakawa R, Furuta K, Tsuta K, Shibata T, Yamamoto S. et al. Identification of genes upregulated in ALK-positive and EGFR/KRAS/ALK-negative lung adenocarcinomas. Cancer Res. 2012;72(1):100–111. doi:10.1158/0008-5472.CAN-11-1403.
- Rittmeyer A, Barlesi F, Waterkamp D, Park K, Ciardiello F, von Pawel J, Gadgeel SM, Hida T, Kowalski DM, Dols MC. et al. Atezolizumab versus docetaxel in patients with previously treated non-small-cell lung cancer (OAK): a phase 3, open-label, multicentre randomised controlled trial. Lancet. 2017;389(10066):255–265. doi:10.1016/S0140-6736(16)32517-X.
- Ravi A, Hellmann MD, Arniella MB, Holton M, Freeman SS, Naranbhai V, Stewart C, Leshchiner I, Kim J, Akiyama Y. et al. Genomic and transcriptomic analysis of checkpoint blockade response in advanced non-small cell lung cancer. Nat Genet. 2023;55(5):807–819. doi:10.1038/s41588-023-01355-5.
- Hu J, Zhang L, Xia H, Yan Y, Zhu X, Sun F, Sun L, Li S, Li D, Wang J. et al. Tumor microenvironment remodeling after neoadjuvant immunotherapy in non-small cell lung cancer revealed by single-cell RNA sequencing. Genome Med. 2023;15(1):14. doi:10.1186/s13073-023-01164-9.
- Huang YF, Mohanty V, Dede M, Tsai K, Daher M, Li L, Rezvani K, Chen K. Characterizing cancer metabolism from bulk and single-cell RNA-seq data using METAFlux. Nat Commun. 2023;14(1):4883. doi:10.1038/s41467-023-40457-w.
- Luca BA, Steen CB, Matusiak M, Azizi A, Varma S, Zhu C, Przybyl J, Espín-Pérez A, Diehn M, Alizadeh AA. et al. Atlas of clinically distinct cell states and ecosystems across human solid tumors. Cell. 2021;184(21):5482–5496. doi:10.1016/j.cell.2021.09.014.
- Miao YR, Zhang Q, Lei Q, Luo M, Xie G-Y, Wang H, Guo A-Y. ImmuCellAI: a unique method for comprehensive t-cell subsets abundance prediction and its application in cancer immunotherapy. Adv Sci (Weinh). 2020;7(7):1902880. doi:10.1002/advs.201902880.
- Yang L, He YT, Dong S, Wei X-W, Chen Z-H, Zhang B, Chen W-D, Yang X-R, Wang F, Shang X-M. et al. Single-cell transcriptome analysis revealed a suppressive tumor immune microenvironment in EGFR mutant lung adenocarcinoma. J Immunother Cancer. 2022;10(2):e003534. doi:10.1136/jitc-2021-003534.
- Browaeys R, Saelens W, Saeys Y. NicheNet: modeling intercellular communication by linking ligands to target genes. Nat Methods. 2020;17(2):159–162. doi:10.1038/s41592-019-0667-5.
- Andreatta M, Corria-Osorio J, Muller S, Cubas R, Coukos G, Carmona SJ. Interpretation of T cell states from single-cell transcriptomics data using reference atlases. Nat Commun. 2021;12(1):2965. doi:10.1038/s41467-021-23324-4.
- Miao TW, Yang DQ, Gao LJ, Yin J, Zhu Q, Liu J, He YQ, Chen X. Construction of a redox-related gene signature for overall survival prediction and immune infiltration in non-small-cell lung cancer. Front Mol Biosci. 2022;9:942402. doi:10.3389/fmolb.2022.942402.
- Xiao L, Li Q, Huang Y, Fan Z, Ma L, Liu B, Yuan X. Construction of a redox-related prognostic model with predictive value in survival and therapeutic response for patients with lung adenocarcinoma. J Healthc Eng. 2022;2022:1–17. doi:10.1155/2022/7651758.
- Peng HJ, Li XQ, Luan YC, Wang CJ, Wang W. A novel prognostic model related to oxidative stress for treatment prediction in lung adenocarcinoma. Front Oncol. 2023;13:1078697. doi:10.3389/fonc.2023.1078697.
- Zhao C, Xiong KW, Bi D, Zhao FR, Lan YF, Jin XR, Li XP. Redox-associated messenger RNAs identify novel prognostic values and influence the tumor immune microenvironment of lung adenocarcinoma. Front Genet. 2023;14:1079035. doi:10.3389/fgene.2023.1079035.
- Zavitsanou AM, Pillai R, Hao Y, Wu WL, Bartnicki E, Karakousi T, Rajalingam S, Herrera A, Karatza A, Rashidfarrokhi A. et al. KEAP1 mutation in lung adenocarcinoma promotes immune evasion and immunotherapy resistance. Cell Rep. 2023;42(11):113295. doi:10.1016/j.celrep.2023.113295.
- Ricciuti B, Arbour KC, Lin JJ, Vajdi A, Vokes N, Hong L, Zhang J, Tolstorukov MY, Li YY, Spurr LF. et al. Diminished efficacy of programmed death-(Ligand)1 inhibition in STK11- and KEAP1-mutant lung adenocarcinoma is affected by KRAS mutation status. J Thorac Oncol. 2022;17(3):399–410. doi:10.1016/j.jtho.2021.10.013.
- Marinelli D, Mazzotta M, Scalera S, Terrenato I, Sperati F, D’Ambrosio L, Pallocca M, Corleone G, Krasniqi E, Pizzuti L. et al. KEAP1-driven co-mutations in lung adenocarcinoma unresponsive to immunotherapy despite high tumor mutational burden. Ann Oncol. 2020;31(12):1746–1754. doi:10.1016/j.annonc.2020.08.2105.
- Zou W, Green DR. Beggars banquet: metabolism in the tumor immune microenvironment and cancer therapy. Cell Metab. 2023;35(7):1101–1113. doi:10.1016/j.cmet.2023.06.003.
- Ge M, Papagiannakopoulos T, Bar-Peled L. Reductive stress in cancer: coming out of the shadows. Trends Cancer. 2023;10(2):103–112. doi:10.1016/j.trecan.2023.10.002.
- Kim R, Hashimoto A, Markosyan N, Tyurin VA, Tyurina YY, Kar G, Fu S, Sehgal M, Garcia-Gerique L, Kossenkov A. et al. Ferroptosis of tumour neutrophils causes immune suppression in cancer. Nature. 2022;612(7939):338–346. doi:10.1038/s41586-022-05443-0.
- Satpathy S, Krug K, Jean Beltran PM, Savage SR, Petralia F, Kumar-Sinha C, Dou Y, Reva B, Kane MH, Avanessian SC. et al. A proteogenomic portrait of lung squamous cell carcinoma. Cell. 2021;184(16):4348–4371. doi:10.1016/j.cell.2021.07.016.
- Li A, Wang Y, Yu Z, Tan Z, He L, Fu S, Shi M, Du W, Luo L, Li Z. et al. STK11/LKB1-deficient phenotype rather than mutation diminishes immunotherapy efficacy and represents STING/Type I interferon/CD8(+) T-Cell dysfunction in NSCLC. J Thorac Oncol. 2023;18(12):1714–1730. doi:10.1016/j.jtho.2023.07.020.
- Arolt C, Dugan M, Wild R, Richartz V, Holz B, Scheel AH, Brägelmann J, Wagener-Ryczek S, Merkelbach-Bruse S, Wolf J. et al. KEAP1/NFE2L2 pathway signature outperforms KEAP1/NFE2L2 mutation status and reveals alternative pathway-activating mutations in NSCLC. J Thorac Oncol. 2023;18(11):1550–1567. doi:10.1016/j.jtho.2023.07.016.
- Cai C, Cooper GF, Lu KN, Ma X, Xu S, Zhao Z, Chen X, Xue Y, Lee AV, Clark N. et al. Systematic discovery of the functional impact of somatic genome alterations in individual tumors through tumor-specific causal inference. PLOS Comput Biol. 2019;15(7):e1007088. doi:10.1371/journal.pcbi.1007088.
- Li F, Han X, Li F, Wang R, Wang H, Gao Y, Wang X, Fang Z, Zhang W, Yao S. et al. LKB1 inactivation elicits a redox imbalance to modulate non-small cell lung cancer plasticity and therapeutic response. Cancer Cell. 2015;27(5):698–711. doi:10.1016/j.ccell.2015.04.001.
- Scalera S, Mazzotta M, Cortile C, Krasniqi E, Maria RD, Cappuzzo F, Ciliberto G, Maugeri-Saccà M. KEAP1-mutant NSCLC: the catastrophic failure of a cell-protecting hub. J Thorac Oncol. 2022;17(6):751–757. doi:10.1016/j.jtho.2022.03.011.
- Roux C, Jafari SM, Shinde R, Duncan G, Cescon DW, Silvester J, Chu MF, Hodgson K, Berger T, Wakeham A. et al. Reactive oxygen species modulate macrophage immunosuppressive phenotype through the up-regulation of PD-L1. Proc Natl Acad Sci U S A. 2019;116(10):4326–4335. doi:10.1073/pnas.1819473116.
- Dan L, Liu L, Sun Y, Song J, Yin Q, Zhang G, Qi F, Hu Z, Yang Z, Zhou Z. et al. The phosphatase PAC1 acts as a T cell suppressor and attenuates host antitumor immunity. Nat Immunol. 2020;21(3):287–297. doi:10.1038/s41590-019-0577-9.
- Corgnac S, Malenica I, Mezquita L, Auclin E, Voilin E, Kacher J, Halse H, Grynszpan L, Signolle N, Dayris T. et al. CD103(+)CD8(+) T(RM) cells accumulate in tumors of anti-PD-1-responder lung cancer patients and are tumor-reactive lymphocytes enriched with Tc17. Cell Rep Med. 2020;1(7):100127. doi:10.1016/j.xcrm.2020.100127.
- He Z, Khatib AM, Creemers JWM. The proprotein convertase furin in cancer: more than an oncogene. Oncogene. 2022;41(9):1252–1262. doi:10.1038/s41388-021-02175-9.
- Pesu M, Watford WT, Wei L, Xu L, Fuss I, Strober W, Andersson J, Shevach EM, Quezado M, Bouladoux N. et al. T-cell-expressed proprotein convertase furin is essential for maintenance of peripheral immune tolerance. Nature. 2008;455(7210):246–250. doi:10.1038/nature07210.
- Ojanen MJT, Caro FM, Aittomaki S, Ploquin MJ, Ortutay Z, Pekkarinen M, Kesseli J, Vähätupa M, Määttä J, Nykter M. et al. FURIN regulates cytotoxic T-lymphocyte effector function and memory cell transition in mice. Eur J Immunol. 2023;53(6):e2250246. doi:10.1002/eji.202250246.
- Liu JY, Li F, Wang LP, Chen XF, Wang D, Cao L, Ping Y, Zhao S, Li B, Thorne SH. et al. CTL- vs Treg lymphocyte-attracting chemokines, CCL4 and CCL20, are strong reciprocal predictive markers for survival of patients with oesophageal squamous cell carcinoma. Br J Cancer. 2015;113(5):747–755. doi:10.1038/bjc.2015.290.