
ABSTRACT
T cell immunity is critical for human defensive immune response. Exploring the key molecules during the process provides new targets for T cell-based immunotherapies. CMC1 is a mitochondrial electron transport chain (ETC) complex IV chaperon protein. By establishing in-vitro cell culture system and Cmc1 gene knock out mice, we evaluated the role of CMC1 in T cell activation and differentiation. The B16-OVA tumor model was used to test the possibility of targeting CMC1 for improving T cell anti-tumor immunity. We identified CMC1 as a positive regulator in CD8+T cells activation and terminal differentiation. Meanwhile, we found that CMC1 increasingly expressed in exhausted T (Tex) cells. Genetic lost of Cmc1 inhibits the development of CD8+T cell exhaustion in mice. Instead, deletion of Cmc1 in T cells prompts cells to differentiate into metabolically and functionally quiescent cells with increased memory-like features and tolerance to cell death upon repetitive or prolonged T cell receptor (TCR) stimulation. Further, the in-vitro mechanistic study revealed that environmental lactate enhances CMC1 expression by inducing USP7, mediated stabilization and de-ubiquitination of CMC1 protein, in which a mechanism we propose here that the lactate-enriched tumor microenvironment (TME) drives CD8+TILs dysfunction through CMC1 regulatory effects on T cells. Taken together, our study unraveled the novel role of CMC1 as a T cell regulator and its possibility to be utilized for anti-tumor immunotherapy.
Introduction
T cell receptor (TCR) and costimulatory receptors synergistically initiate the naive T cell activation are necessary for the induction of T cell effector function, while prolonged stimulation signals cause T cell exhaustion that leads to the compromised adaptive immune response and contributes to the failure of anti-chronic infection or anti-cancer immunity.Citation1,Citation2 According to the recent research on T cell-based immunotherapies, restricting and fine-tuning the activation of therapeutic T cells is key to maintaining their stemness and self-renewal capacity for long-lasting efficacies.Citation3–5
Mitochondria plays crucial roles in orchestrating T cell function and cell fates decision,Citation6,Citation7 and has been proposed to be the target for better T cell fitness.Citation7–9 Mitochondrial biogenesis and reprogramming is a consequence of T cell activation, ensuring the functionality of effector T cell by its governance on anabolism of proteins, lipids, and nucleic acids.Citation6 Besides its regulation of macromolecule synthesis, the ETC Complex IV directly regulates the T cell activation through oxidative phosphorylation.Citation10 CMC1 is a mitochondrial protein that is previously reported to function as a stabilizer of the COX1-COA3-COX14 complex in the ETC complex IV assembly,Citation11 but its effects in the regulation of T cell activation are unknown. More intriguingly, instead of COX1 and other ETC complex subunits, CMC1 transcript was found upregulated in the CD8+Tex cells of our previous single-cell RNA-seq analysis of Hepatocellular carcinoma,Citation12 suggesting a role of CMC1 in the biology of T cell exhaustion beyond its role in the biogenesis of ETC complex IV.
To test the role of CMC1 in the regulation of T cell activation and exhaustion, in the study we utilized two in-vitro cell culture systems similar to previously reported ones.Citation13–15 In both short-term and long-term cell stimulation models, CMC1 acts as an accelerator that feedforwards the CD8+T cell activation and terminal differentiation including exhaustion. In addition, environmental lactate further enhances CMC1 expression through USP7 stabilization and de-ubiquitination of CMC1 protein, revealing a potential mechanism of how tumor cells shut down tumor-reactive CTLs.
Materials and methods
Mouse tumor model
C57BL/6 (WT) (SPF (Beijing) biotechnology Co., Ltd.) and Cmc1-/- (KO) (Cyagen) mice were subcutaneously injected with 5 × 10Citation5 B16-OVA melanoma cells. B16-OVA cells were cultured in DMEM containing 10% FBS for indicated duration and used for the following animal study. Mice and tumor growth were monitored daily. Tumor volume was determined as 0.5 × WidthCitation2 × Length. Mice were then sacrificed on Day 10 after tumor cells inoculation. All animal experiments were performed according to Shanghai Public Health Clinical Center Laboratory Animal Care and Use Committee guidelines. The animal study was reviewed and approved by Shanghai Public Health Clinical Center Laboratory Animal Welfare (2022-A049-01).
Mouse CD8+T cell isolation, activation, and in vitro exhaustion model
Mouse CD8+T cells were isolated from the spleen of C57BL/6 mice using the MojoSort™ Mouse CD8+T Cell Isolation Kit (BioLegend, Cat# 480008). CD8+T cells were activated with plate-bound anti-mouse CD3e (5 μg/ml, BioLegend, Cat# 100340) and anti-mouse CD28 (0.5 μg/ml, BioLegend, Cat# 102116) for 72 hours in RPMI-1640 medium (Sigma-Aldrich) containing 10% FBS (Gibco), 2 mM L-glutamine (Gibco), 50 μM β-ME (Sigma-Aldrich) and 100 U recombinant murine IL-2 (Peprotech, Cat# 212–12). For induction of Teff or Tmem cells, Cells were then washed and resuspended by the RPMI-1640 medium and seeded in the 24-well plate in the presence of 100 U recombinant murine IL-2 (Teff), 12.5 ng/ml recombinant human IL-7 (Tmem) or 10 ng/ml recombinant human IL-15 (Tmem) for 3 more days. For the CM culture experiment, Day 6 Teff cells were resuspended by 20% CM plus 80% RPMI-1640 medium (Sigma-Aldrich) containing 10% FBS (Gibco), 2 mM L-glutamine (Gibco), 50 μM β-ME (Sigma-Aldrich) and 100 U IL-2 (Peprotech) and seeded in the 24-well plate for 24 hours then harvested for experiments. CM was harvested from B16-OVA cells cultured for 48 hours (DMEM +10% FBS) and filtered by 0.2 mm filters.
Mouse CD8+T cells following 72 h of initial stimulation as described above, T cells were rested for 2 d by culturing at 2 × 10Citation6cells/ml in RPMI-1640 medium containing 10% FBS, 2 mM L-glutamine, 5 μM β-ME and 100 U recombinant mouse IL-2. Then cells were either stimulated with (chronic) or without (acute) plate-bound anti-mouse CD3e (2.5 μg ml−1, Biolegend) and anti-mouse CD28 (0.25 μg ml−1, Biolegend). T cells were passaged onto fresh plates every 2 d until Day 10 following initial stimulation, then cells were used for following analysis.
Human CD8+T cell isolation and stimulation
Human CD8+T cells were isolated from the PBMCs of healthy donors using MojoSort™ Human CD8 T Cell Isolation Kit (BioLegend, Cat# 480012). Cells were activated with plate-bound anti-human CD3e (5 μg/ml, BioLegend) and anti-human CD28 (0.5 μg/ml, Biolegend) for 72 hours in RPMI1640 containing 10% FBS, 200 U IL-2 (Peprotech, Cat# 200–02). Cells then washed and resuspended by RPMI1640 containing 10% FBS and 200 U IL-2 and seeded in the 24-well plate for 3 more d culture. For L-Lactate treatment, cells at day 7 were treated with 10 μm L-Lactate for 24 hours and harvested for anti-Pan Kla ChIP-seq. All donors were provided written informed consent before sampling and was approved by the Jinshan Hospital Ethics Committee, Fudan University (JIEC 2021-S19). No subjects were excluded from our study. Experimental subjects were not randomized into groups because this was deemed irrelevant to this study. Sex was not considered as a biological variable because this was deemed irrelevant to this study. Neither age nor weight was considered as a biological variable because both were deemed irrelevant to this study. No blinding was applied because this was deemed irrelevant to this study.
RNA isolation and quantitative real-time PCR (RT-qPCR)
The analyzed genes were: Cmc1, Cox14, Glut1, Hk2, Ldha, Pkm, Usp7. Total RNA was isolated using RNA-Quick Purification Kit (ES Science, RN001). RNA (500 ng) was reverse transcribed into cDNA using PrimeScript™ RT Master Mix (Perfect Real Time) (Takara, Cat# RR036A). The relative expression of gene transcripts compared to the control gene Gapdh were measured by quantitative real-time PCR using SYBR® Premix Ex Taq™ II (Takara, Cat# RR820). Amplification was performed at 95°C for 10 minutes, 40 cycles of 15 s at 95°C and 1 minute at 60°C. The fold change in gene expression was determined as: 2−DDCt. Each real-time PCR experiment included technical replicates, in a final volume of 10 µL.
Flow cytometry
In-vitro cultured CD8+T cells or CD8+TILs were prepared in a staining buffer (PBS containing 1% FBS) and stained with the indicated antibodies. Antibodies: Alexa 700 anti-mouse CD25 (BioLegend; Cat# 102024); FITC anti-mouse IL-2 (BioLegend; Cat# 503806); FITC anti-mouse TNFα (BioLegend; Cat# 506304); BV605 anti-mouse IFNγ (BioLegend; Cat# 505840); Percp-cy5.5 anti-mouse GZMB (Biolegend; Cat# 372212); APC anti-mouse Perforin (BioLegend; Cat# 154403); APC anti-mouse EOMES (Invitrogen; Cat# 2473687); APC anti-mouse KLRG1 (BioLegend; Cat# 138412); BV421 anti-mouse CD127 (BioLegend; Cat# 135024); APC-Cy7 anti-mouse CD44 (BD Pharmingen; Cat# 560568); BV605 anti-mouse CD62L (BioLegend; Cat# 104437); PE-Cy7 anti-mouse CCR7 (BioLegend; Cat# 120123), BV421 anti-mouse PD-1 (Biolegend, Cat# 135221); PE-Cy7 anti-mouse Tim-3 (Biolegend, Cat# 134010); PE anti-mouse TOX (Invitrogen, Cat# 2407523); Alexa flour 647 anti-mouse TCF1 (BD Pharmingen, Cat# 566693). Fixable Viability Stain (BD Horizon; Cat# 564406) was used to determine cell viability. FITC Annexin V Apoptosis Detection Kit I (BD Biosciences, Cat# 556547) was used to determine cellular apoptosis. For intracellular markers staining, Fixation and permeabilization solution (BD, Cat# 554722) was used by following the manufacturer’s instruction. For INFγ, TNFα, GZMB, IL-2, Perforin, before harvesting the cells, PMA, ionomycin and Brefeldin A (Cell Activation Cocktail, Biolegend, Cat#423303) were used to treat the cells for 4 hours at a 1:1000 dilution. Flow cytometry was performed on BD FACSLyricTM Flow Cytometer. Flow analysis was performed using FlowJo 10.6.1 software (TreeStar). All surface antibodies were used at a 1:200 dilution, and the intracellular staining antibodies were used at a 1:100 dilution.
Lactate detection assay
Lactate detection was performed using a Lactate detection kit (Abbkine, Cat# KTB1100) following the procedure of supplemental methods.
Western blotting and immunoprecipitation
For western blotting experiments, total cell lysates were obtained by lysing cells with NP40 lysis buffer, and centrifugated at 15,000 × g for 10 min at 4°C. The lysates were resolved by SDS-PAGE, transferred to nitrocellulose membrane and probed with indicated antibodies.
For immunoprecipitation experiments, equal amounts of cleared cell lysates were adjusted to the same volume, incubated with normal rabbit or mouse IgG control (Beyotime, Cat# P2179M) or USP7 or CMC1 primary antibody for 2 hours, and then incubated with Immunoprecipitation Kit with Protein A+G Magnetic Beads (Beyotime, Cat# P2179M) for 2 hours at 4°C. The Beads were then washed three times with lysis buffer, and bound proteins were eluted in SDS sample buffer for western blotting experiment. For HA immunoprecipitation, cell lysates were directly incubated with anti-HA tag antibody for 2 hours, and then incubated with Immunoprecipitation Kit with Protein A+G Magnetic Beads (Beyotime, Cat# P2179M) for 2 hours at 4°C. Then Beads were washed three times with lysis buffer, and bound proteins were eluted in SDS sample buffer for western blotting analysis. Other used antibodies (see Supplemental Table S1).
In vivo de-ubiquitination assay
Myc-tagged USP7 was purchased from Shanghai Yuanhe biotechnology company. Flag-tagged CMC1 was generated in the laboratory. 293T cells were co-transfected with plasmids encoding HA-tagged ubiquitin and Flag-tagged CMC1 with/without Myc-tagged USP7. Two days after transfection, cells were treated with 20 μM MG132 for 4 hours and lysed in 500 μl denature lysis buffer. Cell lysates were then immunoprecipitated by using an HA-tag antibody as described above.
Statistical analysis
Statistical analyzes were done by using GraphPad PRISM 9.0.0 software. Error bars, p values and statistical tests are all reported in figure legends.
Results
CMC1 associates with T cell activation events
To understand if Cmc1 is differentially expressed in Teff and Tmem, we purified CD8+Tnaive cells from the splenocytes of C57/BL6J mice and stimulated them with anti-CD3 and anti-CD28 monoclonal antibodies in the presence of Interleukin-2 (IL-2), IL-7 or IL-15 in vitroCitation13 (Figure S1(a)). We found that the CMC1 protein is significantly higher in Teff cells than in Tmem cells (). In the current study, we tested in two experiments (activation and reactivation) to find out whether CMC1 is important in the effector stage after effector T cell development. To mimic the early activation events of cytotoxic T cells killing their target cellsCitation16,Citation17 (Figures S1(b,c)), we restimulated CD8+Teff cells and found that CMC1 transiently upregulated at the 3-hour time point (). By treating the CD8+Teff cells with a previously reported mitochondrial proteins blocker – mitoblock6 (MB)Citation18 for 24 hours on Day 6, we found that the activation markers CD25, CD69, cytotoxic cytokines granzyme B (GZMB) and interferon gamma (IFNγ) were dose-dependently decreased (Figure S1(d,e)).
Figure 1. The expression of CMC1 associates with T cell activation and apoptosis.
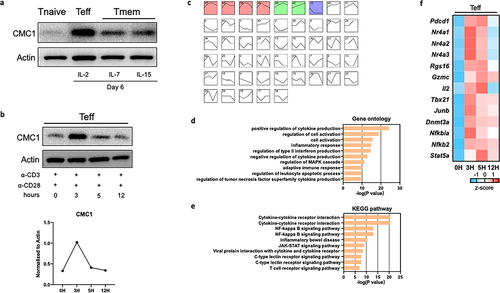
We performed mRNA-seq analysis on the restimulated CD8+Teff cells. By using the Short Time-series Expression Miner (STEM) analysis,Citation20 we identified four clusters of genes that had similar expression patterns as CMC1 ( and STab.2), which are enriched in the biological process of T cell activation, apoptosis (). Representative genes from the clusters () like Pdcd1, Nr4a1, Nr4a2, Nr4a3 and Rgs16 are marker genes of T cell exhaustionCitation21 (). The genes like Gzmc, and Il2 share a similar expression pattern to CMC1. In addition, genes involved in the T cell differentiation were transiently induced in the restimulated CD8+Teff cells (). Since the transcriptome of Tnaive cells is drastically reprogrammed at different time points after the ligation of TCR,Citation22 we then ask if Cmc1 is also involved in the naive T cell activation (Day 0 to Day 3) (Figure S1A). We tested the kinetic expression of CD69 and CD25 on Day 1 and Day 6 with or without anti-CD3/CD28 antibodies reactivation to confirm cell activation (Figures S1(b,c)). Besides, the cells were treated by mitoblock6 together with anti-CD3/CD28 antibodies reactivation for 24 hours (Figures S1(d,e)). And we measured the protein expression level of multiple effector molecules including CD25, CD69, GZMB, IFNγ and found mitoblock6 significantly inhibited cell effector function (Figures S1(d,e)). To our surprise, Cmc1 was transiently induced with the highest mRNA expression at the 24-hour, then decline to its initial level at Day 3 (Figure S2A). The Cox14 also showed a similar expression pattern (Figure S2A), suggesting that the short-term induction of Cmc1 is probably integrated into the mitochondrial biogenesis and assembly during naïve T cell activation.Citation10
Cmc1 KO inhibits CD8+T cell activation and apoptosis
Next, we generated genetic Cmc1 KO mice to further study the intrinsic causal-effective relationship between Cmc1 and CD8+Teff cells function in the same culture system (Figure S1A). The Cmc1−/− CD8+Teff cells showed reduced CD25 and cytotoxic cytokines including GZMB, perforin, tumor necrotic factor-α (TNFα) and IFNγ expressions (). Also, T-bet is decreased in the Cmc1−/− CD8+Teff cells, revealing a lower activation response (). In addition, similar effects were also observed at the 12-hour and 24-hour time-points in the initial phase of Tnaive cells activation (Figure S2(b-e)). It suggests that CMC1 is an accelerator in T cell activation that starts to orchestrate effector function as early as the mitochondrial biogenesis starts.Citation23
Figure 2. CMC1 accelerates CD8+Teff cells activation and apoptosis.
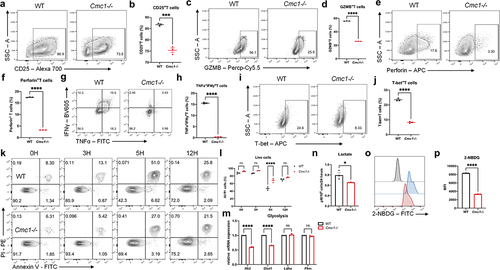
Activation-induced apoptosis is a T cell-intrinsic negative mechanism that is prone to restrict Teff hyperactivation,Citation24 and results in also suggest a correlation between CMC1 and apoptosis. We then examined the cellular apoptosis by AV/PI staining at different time points upon restimulation and found that CD8+Teff cells from the WT devoted a fewer proportion of live cells ().
Increased aerobic glycolysis in CD8+Teff cells is another hallmark of T cell activation,Citation6,Citation25 while CMC1 is a chaperon protein in the biogenesis of mitochondrial ETC complex IV.Citation11 We wonder if Cmc1 KO would lead to any transformations of the cellular metabolic processes. By testing glycolytic genes expression and measuring the cellular lactate production at Day 6, Cmc1-/- CD8+Teff cells showed lower expression of Glut1 and Hk2 with reduced lactate production and glucose uptake (), suggesting a relative state of glycolysis inhibition. Consistent with the results above, the mRNA-seq analysis (Figure S3A) showed downregulated Gzmk, Klrg1, GO and KEGG enrichment of the downregulated transcriptome (Figure S3(b.c)) suggested T cell activation and immune response are involved.
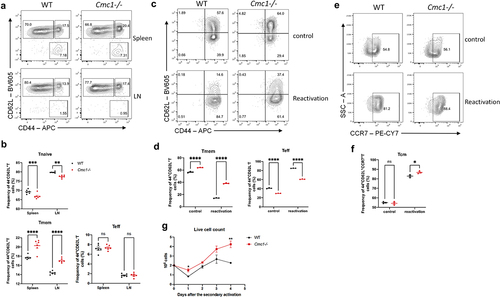
Cmc1 negatively regulates T cell stemness and memory plasticity
Activation leads to the terminal differentiation of CD8+Teff cells is attributed to the loss of cellular stemness.Citation26,Citation27 Given that Cmc1 is up-regulated in T cell activation and the Tmem cells express less CMC1 protein (), we wonder if Cmc1 also affects the cell fate decision after T cell activation. Therefore, we next sought to clarify whether Cmc1 KO would favor memory T cell formation in vitro. We first evaluated the Tmem and Teff subsets in the KO mouse spleen. The CD44 and CD62L FCM gating showed that Tmem population (CD44+CD62L+) in Cmc1-/-T cells is slightly higher than the WT control mice (). This trend is more obvious when we induced the splenic T cells in vitro under memory conditions (). To better characterize the memory plasticity, we restimulate the in vitro cultured memory cells with anti-CD3 and CD28 antibodies and the result showed there was a greater memory subset with increased CCR7 expression remained in the Cmc1-/- T cells (). Also, there was more live cells remained on Day 4 after restimulation (), consistent to more live cells when reactivated ().
Figure 3. Cmc1-/- CD8+T cells retain more CD44+CD62L+Tm cells and survive longer upon secondary activation in vitro.
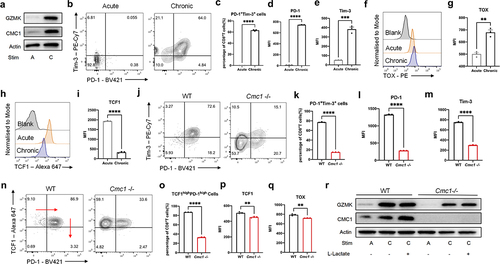
CMC1 accelerates T cell exhaustion in an in-vitro chronic stimulation model
Prolonged antigen stimulation or TCR activation signaling is the prerequisite for the T cell exhaustion development.Citation1,Citation2,Citation28 To further clarify the relationship between Cmc1 and T cell exhaustion, we first induced T cell exhaustion in vitro (Figure S4A). Consistent with our findings in the single cell RNA-seq of CD8+TILs in the HCC patients,Citation12 cells that experienced chronic stimulation had significantly higher CMC1 and GZMK expressions (). And the PD-1, Tim-3, and the consequent PD-1+Tim3+proportion were significantly increased in the chronic stimulation (). The terminal exhaustion transcription factor TOX was increased, while the progenitor exhaustion marker TCF1 was decreased (). Next, we found that Cmc1-/- cells possessed fewer PD-1+Tim-3+ populations and the corresponding lower PD-1 and Tim3 expression () in the same culture model. The population of TCF-1hiPD-1hi T cell was fewer in the Cmc1-/- cells with lower TCF-1 and TOX levels (), suggesting that the total Tex cells including progenitor Tex population were attenuated in the Cmc1-/- T cells. Given that GZMK and CMC1 were both increased in the chronically stimulated T cells (), and the effector memory GZMK+T cells are also defined as the progenitor Tex cells,Citation29 we next examine the GZMK protein levels in the Cmc1-/- cells. Consistent with the fewer TCF-1hiPD-1hi population (), GZMK was decreased in both acute and chronic stimulation (). And Cmc1 KO ameliorates the apoptosis of in-vitro-induced Tex cells with more live cell proportion (Figure S4B,C). Lactate accumulation is one of the hallmarks of TME metabolism.Citation30 By adding extracellular lactate into the cell culture for 24 hours, we found that the extracellular lactate increased CMC1 expression levels of the Tex cells ().
Figure 4. CMC1 deficiency attenuates CD8+T cells exhaustion-like development during chronic TCR stimulation.
CMC1 impairs T cell survival in a lactate-enrich environment
To further mimic the context of lactate-enrich TME on CD8+Teff cells, we here utilized a previously reported cell culture modelCitation31 to test if lactate affects CD8+Teff cells survival capability. Indeed, conditioned medium (CM) harbored higher lactate concentration (Figure S5A) and reinforces the CMC1 level in CD8+Teff cells with decreased live cells (Figure S5B – Figure S5D). Next, we repeated the test on Cmc1 KO cells. Though the Cmc1 KO cells did not directly show more live cells, they were rescued by cell death inhibitors including Necrostatin-1 and Ferropstatin-1 rather than Z-VAD-FMK (Figure S5(e,f))). Taken together, CMC1 also plays a role in regulating the survival capability in the lactate-enrich environment by necroptosis and ferroptosis.
Lactate reinforces CMC1 expression by USP7 in a post-translational manner
Histone lactylation is an epigenetic modification that senses the cellular lactate flux, resulting in selective gene upregulation.Citation32,Citation33 We found that the Pan-lysine lactylation (Pan Kla) modification continually accumulated following TCR stimulation in naive T cells (Figure S6A), which is corresponding to the upregulated aerobic glycolysis in T cell activation.Citation6 Consistently, inhibiting the intracellular lactate production via oxamate, CMC1 was reduced in CD8+Teff cells (Figure S6B). We then treated CD8+Teff cells with lactate for 24 hours in the absence of TCR restimulation and then performed an anti-Pan Kla ChIP-seq to profile the differentially modified gene promoters. We noticed that the Usp7 promoter had upregulated enrichment of Pan Kla modification ( and STab. S3). Given that USP7 is a specific deubiquitinase that stabilizes protein expression in a posttranslational manner,Citation34 we hypothesized that the histone lactylation (Pan-Kla) promotes CMC1 expression via USP7 in a post-translational manner rather than its direct modification on the Cmc1 promoter.
Figure 5. Lactate enhances CMC1 expression through USP7-mediated stabilization and de-ubiquitination of CMC1 protein.
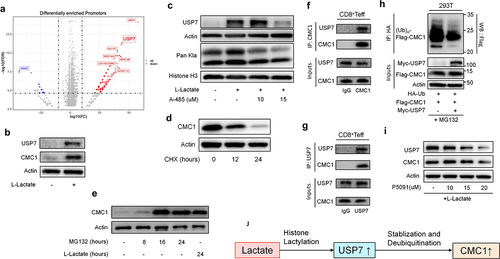
Consistently, mouse CD8+Teff cells treated with lactate showed increased CMC1 and USP7 levels (), while the mRNA of Cmc1 was not significantly altered (Figure S6C). MCT1 is responsible for the shuttling of environmental lactate in CD4+Treg cellsCitation30,Citation35 and the resulting upregulated PD-1,Citation30 we here noticed that the MCT1 in CD8+Teff cells was only upregulated when the extracellular pH is near 5.8, similar to that of lactic acidosis in TMECitation36,Citation37(Figure S6(d,e)). Moreover, inhibition of MCT1 by phloretinCitation38 abolished the CMC1 expression induced by lactate (Figure S6f). Histone lactylation is thought to be carried out by p300 protein,Citation32 we utilized a p300 inhibitor, A485,Citation39 to test if USP7 is indeed modulated by Pan Kla modification. As expected, both USP7 and Pan Kla declined in the presence of lactate and A485 (). Since USP7 acts as a deubiquitinase, we next sought to confirm if the CMC1 protein is degraded in the protease. Indeed, the CMC1 protein declines in the presence of CHX (), while accumulating in the presence of MG132 which is equivalent to the effect of lactate treatment (). The immunoprecipitation experiment showed that USP7 interacts with CMC1 (). To further confirm that USP7 deubiquitinates CMC1, we performed the in-vivo de-ubiquitination assay in 293T cell line as previously described.Citation34 In the condition of USP7 overexpression, the poly-ubiquitination of exogenous CMC1 significantly decreased (). Finally, we utilized a specific USP7 inhibitor, P5091,Citation40 to test the efficacy of targeting CMC1 by inhibiting USP7 activity in the presence of lactate addition. Both USP7 and CMC1 declined in a dose-dependent manner (). These results together suggested that lactate promotes CMC1 expression via USP7 in a post-translational manner ().
ScRNA-seq analysis revealed CMC1 is a potential marker of immunotherapy
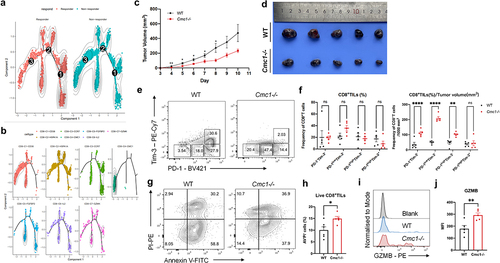
Terminal Tex cells are thought to be the mechanism of failure to immune checkpoint blockade therapy (ICB).Citation41 Here we reanalyze published data including responsive and non-responsive melanoma patients,Citation42 focusing on exploring the role of CMC1 in T cell exhaustion. The CD8+T cell cluster that expresses the highest CMC1 (C4) also had the most abundant co-inhibitory receptors and apoptosis pathway with lower TCF7 and CCR7, suggesting CMC1 is positively associated with terminal Tex cells (Figure S7A and Figure S7B). Consistent with our results, the C4 cluster also expresses the highest USP7 level (Figure S7B). Moreover, the pseudo-time analysis further revealed that the non-responders harbor higher amounts of CMC1hiCD8+T cells (), suggesting CMC1 correlates with ICB non-responsiveness.
Figure 6. Tumor-bearing Cmc1-/- mice have more non-exhausted and progenitor exhausted CD8+TILs.
Cmc1 deletion relieves intra-tumoral CD8+T cells exhaustion and apoptosis in mouse
To better understand the in-vivo effect of Cmc1 in anti-tumor T cell subsets, we subcutaneously inoculated the B16-OVA melanoma cells in the Cmc1 KO mice to observe the overall in-vivo anti-tumor immune response. Tumors that developed in the Cmc1 KO mice exhibited a considerably slower growth rate compared with WT mice (). We next obtained the single-cell suspensions to perform FCM to evaluate the intra-tumoral T cell functional states. The CD8+TILs of Cmc1 KO mice projected more PD-1−Tim-3−, PD-1lowTim-3−, PD-1highTim-3− cells () along with a tendency of increased corresponding CD44+CD62L− effector population (Figure S8A and S8B). We also observed the CD8+TILs of Cmc1 KO mice had fewer Tox+cells (Figure S8C and S8D) but more TCF1+cells (Figure S8E and S8F) although the statistical results have not yet reached significant significance due to the great individual differences. Accordingly, Cmc1 KO mice had more live CD8+TILs () with higher GZMB expression level () remaining in the TME and, suggesting a long-lasting effective anti-tumor efficacy.
Discussion
The coinhibitory molecules, including PD1, are induced to regulate T cells upon activation. They play a diverse role in balancing protective immunity and immunopathology, homeostasis and tolerance.Citation43 Our study for the first time identified that upon CD8+T cell activation, CMC1 serves as an accelerator to promote T cell terminal differentiation that impaired memory plasticity and drives T cell exhaustion leading to impaired anti-tumor immunity. Further, in the context of highly glycolytic TME, lactate accumulation might poison the newly infiltrated CD8+Teff cells and exacerbate Tex cell development by promoting CMC1 expression.
ICB therapy has shed new light on cancer immunotherapy, but the efficacy and durability are still limited due to the terminal differentiation of Tex cells. Previous studies identified that the progenitor Tex cells are the main source that gives rise to effector T cell expansion responding to ICB therapy.Citation26,Citation44 However, a recent study has shown that T cell expansion also causes T cell terminal exhaustion development triggered by IL-2 signaling.Citation45 This research revealed that sustained elevation of IL-2 triggers prolonged STAT5 activation in CD8+ T cells. This activation, in turn, prompts significant upregulation of tryptophan hydroxylase 1 expression, facilitating the conversion of tryptophan into 5-hydroxytryptophan (5-HTP). Subsequent activation of AhR nuclear translocation by 5-HTP orchestrates the upregulation of inhibitory receptors while simultaneously downregulating cytokine and effector-molecule production. Consequently, T cells become dysfunctional within the tumor microenvironment. This suggests that T cell exhaustion is an irreversible process and cell fate commitment that cannot simply be reversed by combating the co-inhibitory immune checkpoints. Our study here identified that CMC1 serves as an accelerator that starts to direct T cell terminal differentiation as early as the T cell is activated especially when it’s cultured in an IL-2 expansion medium. More interestingly, another study showed that targeting T cell expansion by an engineered IL-2 agonist – H9T significantly ameliorates T cell terminal exhaustion development after activation.Citation46 Mechanistically, the H9T treated CD8+Teff cells exert a stem-cell memory phenotype and reduced glycolysis metabolism which is consistent with what we found in the Cmc1 KO (Cmc1-/-) CD8+Teff cells ( and ). Therefore, CMC1 might serve as a metabolic checkpoint that can be utilized to fine-tune the T cell expansion in vitro, especially for CAR-T cells since T cell exhaustion is still a barrier that hinders the CAR-T cells application in solid tumors.
Lactate was widely considered a cellular metabolic waste of glycolysis when the Warburg effect first described a mechanism by which the malignant tumors thrive through metabolic reprogramming.Citation47 Targeting lactate shuttling of malignant cells has been proposed to be a promising cancer treatment strategy.Citation38 Of note, lactate’s effects on T cells are still controversial. Physiological lactate boosts the T cell fitness by supporting the TCA cycle efficiency,Citation48 while a much higher level of lactate boosts CD8+TILs’ anti-tumor immunity via replenishing their TCF1 expression and stemness.Citation49 The main reason causing the discrepancies is that the concentrations of lactate used in these studies are different. The physical mouse serum level of 1 to 3 mM lactate is beneficial for T cell metabolic fitness, whereas in the latter study, a higher lactate concentration (40 mM) was used to generate beneficial effect on promoting CD8+TILs TCF1 expression and the resulting better stemness. In our study, we found that 10 mM lactate promoted CMC1 expression and contributed to cell death of CD8+T cells in vitro. Notably, lactate in the TME is usually above 5 mM. Thus, the relationship between lactate and TILs effector function cannot be simply defined as linear correlation. In addition, these in-vitro findings come from different T cell activation and cultural conditions, which means these T cells are thought to be transcriptionally and metabolically heterogeneous. Therefore, more in vivo evidence is needed in the future to delineate the lactate effects on T cell biology in certain physical and pathological conditions. Together with our results, it’s worthwhile to test if MCT1 can be utilized to target the CD8+T cells for preventing CMC1 accumulation and thus synergize the cancer treatment. Other than MCT1, USP7 has been reported effective in mouse tumor models to compact malignant cells and immunosuppressive cells.Citation50,Citation51 It’s also worthwhile to test if targeting USP7 can generate a synergistic effect by eliminating CMC1 accumulation in the Tex cells to treat cancer since CMC1 positively correlates with poor responsiveness of ICB treatment in melanoma patients ( and Supplemental Figure S7).
Though healthy mitochondria are essential for T cell persistence in anti-tumor immunity,Citation14,Citation15,Citation52 we here found that the ETC complex IV enzymatic activity was still intact in the Cmc1 KO CD8+Teff cells (data not shown), suggesting that there might be compensation exists for the maintenance of ETC complex IV biogenesis without CMC1.Citation53 Of course, experiments like seahorse assay can be done to further delineate the relationship between CMC1 and mitochondrial oxidative phosphorylation and the resultant T cell functionality. The limitation of the in vivo study in is that we perform the experiment in constitutive KO mice, which means the slowed tumor growth cannot be fully attributed to the effect of T cells.
Conclusion
T cell exhaustion is a hypofunctional T cell state that is associated with decreased efficacy of immune-checkpoint inhibitors and adoptive T cell therapies.Citation2 Our study for the first time identified that CMC1 serves as an immunometabolic checkpoint to promote T cell terminal differentiation that impaired memory plasticity and drives cell exhaustion. Further, in the context of highly glycolytic TME, lactate accumulation might exacerbate Tex cell development by promoting CMC1 expression. Of note, lactate’s effects on T cells are still controversial. It’s worthwhile to test if MCT1 can be utilized to target the CD8+T cells for preventing CMC1 accumulation and thus synergize the cancer treatment.
Availability of data and material
Data transparency. The datasets used or analyzed during the current study are available from the corresponding author on reasonable request.
S Table 2.xlsx
Download MS Excel (45 KB)sfigure 6.tif
Download TIFF Image (31.6 MB)sfigure 4.tif
Download TIFF Image (31.6 MB)sfigure 3.tif
Download TIFF Image (31.6 MB)sfigure 1.tif
Download TIFF Image (31.6 MB)supplementale Table 1.doc
Download MS Word (65.5 KB)sfigure 7.tif
Download TIFF Image (31.6 MB)sfigure 5.tif
Download TIFF Image (31.6 MB)Supplemental methods.docx
Download MS Word (15.9 KB)sfigure 2.tif
Download TIFF Image (31.6 MB)Supplemental_Figure_Legends_revised_0412.docx
Download MS Word (25.2 KB)sfigure 8.tif
Download TIFF Image (31.6 MB)Disclosure statement
No potential conflict of interest was reported by the author(s).
Supplementary material
Supplemental data for this article can be accessed online at https://doi.org/10.1080/2162402X.2024.2344905.
Additional information
Funding
References
- Wherry EJ, Kurachi M. Molecular and cellular insights into T cell exhaustion. Nat Rev Immunol. 2015;15(8):486–11. doi:10.1038/nri3862.
- Philip M, Schietinger A. CD8(+) T cell differentiation and dysfunction in cancer. Nat Rev Immunol. 2022;22(4):209–223. doi:10.1038/s41577-021-00574-3.
- Feucht J, Sun J, Eyquem J, Ho Y-J, Zhao Z, Leibold J, Dobrin A, Cabriolu A, Hamieh M, Sadelain M. et al. Calibration of CAR activation potential directs alternative T cell fates and therapeutic potency. Nat Med. 2019;25(1):82–88. doi:10.1038/s41591-018-0290-5.
- Gumber D, Wang LD. Improving CAR-T immunotherapy: overcoming the challenges of T cell exhaustion. EBioMedicine. 2022;77:103941. doi:10.1016/j.ebiom.2022.103941.
- Delgoffe GM, Xu C, Mackall CL, Green MR, Gottschalk S, Speiser DE, Zehn D, Beavis PA. The role of exhaustion in CAR T cell therapy. Cancer Cell. 2021;39(7):885–888. doi:10.1016/j.ccell.2021.06.012.
- Chapman NM, Boothby MR, Chi H. Metabolic coordination of T cell quiescence and activation. Nat Rev Immunol. 2020;20(1):55–70. doi:10.1038/s41577-019-0203-y.
- Franco F, Jaccard A, Romero P, Yu YR, Ho PC. Metabolic and epigenetic regulation of T-cell exhaustion. Nat Metab. 2020;2(10):1001–1012. doi:10.1038/s42255-020-00280-9.
- Li X, Wenes M, Romero P, Huang SCC, Fendt S-M, Ho P-C. Navigating metabolic pathways to enhance antitumour immunity and immunotherapy. Nat Rev Clin Oncol. 2019;16(7):425–441. doi:10.1038/s41571-019-0203-7.
- DePeaux K, Delgoffe GM. Metabolic barriers to cancer immunotherapy. Nat Rev Immunol. 2021;21(12):785–797. doi:10.1038/s41577-021-00541-y.
- Tan H, Yang K, Li Y, Shaw TI, Wang Y, Blanco DB, Wang X, Cho J-H, Wang H, Rankin S. et al. Integrative proteomics and phosphoproteomics profiling reveals dynamic signaling networks and bioenergetics pathways underlying T cell activation. Immunity. 2017;46(3):488–503. doi:10.1016/j.immuni.2017.02.010.
- Bourens M, Barrientos A. A CMC1-knockout reveals translation-independent control of human mitochondrial complex IV biogenesis. EMBO Rep. 2017;18(3):477–494. doi:10.15252/embr.201643103.
- Yang Y, Sun L, Chen Z, Liu W, Xu Q, Liu F, Ma M, Chen Y, Lu Y, Fang H. et al. The immune-metabolic crosstalk between CD3(+)C1q(+)TAM and CD8(+)T cells associated with relapse-free survival in HCC. Front Immunol. 2023;14:1033497. doi:10.3389/fimmu.2023.1033497.
- Buck MD, O’Sullivan D, Klein Geltink R, Curtis J, Chang C-H, Sanin D, Qiu J, Kretz O, Braas D, van der Windt GW. et al. Mitochondrial dynamics controls T cell fate through metabolic programming. Cell. 2016;166(1):63–76. doi:10.1016/j.cell.2016.05.035.
- Vardhana SA, Hwee MA, Berisa M, Wells DK, Yost KE, King B, Smith M, Herrera PS, Chang HY, Satpathy AT. et al. Impaired mitochondrial oxidative phosphorylation limits the self-renewal of T cells exposed to persistent antigen. Nat Immunol. 2020;21(9):1022–1033. doi:10.1038/s41590-020-0725-2.
- Scharping NE, Rivadeneira DB, Menk AV, Vignali PDA, Ford BR, Rittenhouse NL, Peralta R, Wang Y, Wang Y, DePeaux K. et al. Mitochondrial stress induced by continuous stimulation under hypoxia rapidly drives T cell exhaustion. Nat Immunol. 2021;22(2):205–215. doi:10.1038/s41590-020-00834-9.
- Lisci M, Barton PR, Randzavola LO, Ma CY, Marchingo JM, Cantrell DA, Paupe V, Prudent J, Stinchcombe JC, Griffiths GM. et al. Mitochondrial translation is required for sustained killing by cytotoxic T cells. Science. 2021;374(6565):eabe9977. doi:10.1126/science.abe9977.
- Xu K, Yin N, Peng M, Stamatiades EG, Shyu A, Li P, Zhang X, Do MH, Wang Z, Capistrano KJ. et al. Glycolysis fuels phosphoinositide 3-kinase signaling to bolster T cell immunity. Science. 2021;371(6527):405–410. doi:10.1126/science.abb2683.
- Dabir DV, Hasson S, Setoguchi K, Johnson M, Wongkongkathep P, Douglas C, Zimmerman J, Damoiseaux R, Teitell M, Koehler C. et al. A small molecule inhibitor of redox-regulated protein translocation into mitochondria. Dev Cell. 2013;25(1):81–92. doi:10.1016/j.devcel.2013.03.006.
- Zhou Y, Zhou B, Pache L, Chang M, Khodabakhshi A H, Tanaseichuk O, Benner C, Chanda S K. Metascape provides a biologist-oriented resource for the analysis of systems-level datasets. Nat Commun. 2019;10(1). doi:10.1038/s41467-019-09234-6.
- Ernst J, Bar-Joseph Z. STEM: a tool for the analysis of short time series gene expression data. BMC Bioinformatics. 2006;7(1). doi:10.1186/1471-2105-7-191.
- Seo H, Chen J, González-Avalos E, Samaniego-Castruita D, Das A, Wang YH, López-Moyado IF, Georges RO, Zhang W, Onodera A. et al. TOX and TOX2 transcription factors cooperate with NR4A transcription factors to impose CD8 + T cell exhaustion. Proc Natl Acad Sci USA. 2019;116(25):12410–12415. doi:10.1073/pnas.1905675116.
- Liu Y, Zhou J, Li X, Zhang X, Shi J, Wang X, Li H, Miao S, Chen H, He X. et al. tRNA-m(1)A modification promotes T cell expansion via efficient MYC protein synthesis. Nat Immunol. 2022;23(10):1433–1444. doi:10.1038/s41590-022-01301-3.
- Ron-Harel N, Santos D, Ghergurovich J, Sage P, Reddy A, Lovitch S, Dephoure N, Satterstrom F, Sheffer M, Spinelli J. et al. Mitochondrial biogenesis and proteome remodeling promote one-carbon metabolism for T cell activation. Cell Metab. 2016;24(1):104–117. doi:10.1016/j.cmet.2016.06.007.
- Green DR, Droin N, Pinkoski M. Activation-induced cell death in T cells. Immunol Rev. 2003;193(1):70–81. doi:10.1034/j.1600-065X.2003.00051.x.
- Reina-Campos M, Scharping NE, Goldrath AW. CD8(+) T cell metabolism in infection and cancer. Nat Rev Immunol. 2021;21(11):718–738. doi:10.1038/s41577-021-00537-8.
- Zehn D, Thimme R, Lugli E, de Almeida GP, Oxenius A. ‘Stem-like’ precursors are the fount to sustain persistent CD8+ T cell responses. Nat Immunol. 2022;23(6):836–847. doi:10.1038/s41590-022-01219-w.
- Joshi NS, Cui W, Chandele A, Lee HK, Urso DR, Hagman J, Gapin L, Kaech SM. Inflammation directs memory precursor and short-lived effector CD8(+) T cell fates via the graded expression of T-bet transcription factor. Immunity. 2007;27(2):281–295. doi:10.1016/j.immuni.2007.07.010.
- Yao C, Sun H-W, Lacey NE, Ji Y, Moseman EA, Shih H-Y, Heuston EF, Kirby M, Anderson S, Cheng J. et al. Single-cell RNA-seq reveals TOX as a key regulator of CD8+ T cell persistence in chronic infection. Nat Immunol. 2019;20(7):890–901. doi:10.1038/s41590-019-0403-4.
- Zheng L, Qin S, Si W, Wang A, Xing B, Gao R, Ren X, Wang L, Wu X, Zhang J. et al. Pan-cancer single-cell landscape of tumor-infiltrating T cells. Science. 2021;374(6574):abe6474. doi:10.1126/science.abe6474.
- Kumagai S, Koyama S, Itahashi K, Tanegashima T, Lin Y-T, Togashi Y, Kamada T, Irie T, Okumura G, Kono H. et al. Lactic acid promotes PD-1 expression in regulatory T cells in highly glycolytic tumor microenvironments. Cancer Cell. 2022;40(2):201–218.e9. doi:10.1016/j.ccell.2022.01.001.
- Elia I, Rowe JH, Johnson S, Joshi S, Notarangelo G, Kurmi K, Weiss S, Freeman GJ, Sharpe AH, Haigis MC. Tumor cells dictate anti-tumor immune responses by altering pyruvate utilization and succinate signaling in CD8+ T cells. Cell Metab. 2022;34(8):1137–1150.e1136. doi:10.1016/j.cmet.2022.06.008.
- Zhang D, Tang Z, Huang H, Zhou G, Cui C, Weng Y, Liu W, Kim S, Lee S, Perez-Neut M. et al. Metabolic regulation of gene expression by histone lactylation. Nature. 2019;574(7779):575–580. doi:10.1038/s41586-019-1678-1.
- Pan RY, He L, Zhang J, Liu X, Liao Y, Gao J, Liao Y, Yan Y, Li Q, Zhou X. et al. Positive feedback regulation of microglial glucose metabolism by histone H4 lysine 12 lactylation in Alzheimer’s disease. Cell Metab. 2022;34(4):634–648.e636. doi:10.1016/j.cmet.2022.02.013.
- Ji L, Lu B, Zamponi R, Charlat O, Aversa R, Yang Z, Sigoillot F, Zhu X, Hu T, Reece-Hoyes JS. et al. USP7 inhibits Wnt/β-catenin signaling through promoting stabilization of Axin. Nat Commun. 2019;10(1):4184. doi:10.1038/s41467-019-12143-3.
- Watson MJ, Vignali PDA, Mullett SJ, Overacre-Delgoffe AE, Peralta RM, Grebinoski S, Menk AV, Rittenhouse NL, DePeaux K, Whetstone RD. et al. Metabolic support of tumour-infiltrating regulatory T cells by lactic acid. Nature. 2021;591(7851):645–651. doi:10.1038/s41586-020-03045-2.
- Mendler AN, Hu B, Prinz PU, Kreutz M, Gottfried E, Noessner E. Tumor lactic acidosis suppresses CTL function by inhibition of p38 and JNK/c-Jun activation. Intl J Cancer. 2012;131(3):633–640. doi:10.1002/ijc.26410.
- Ippolito L, Morandi A, Giannoni E, Chiarugi P. Lactate: a metabolic driver in the tumour landscape. Trends Biochem Sci. 2019;44(2):153–166. doi:10.1016/j.tibs.2018.10.011.
- Felmlee MA, Jones RS, Rodriguez-Cruz V, Follman KE, Morris ME, Daws LC. Monocarboxylate transporters (SLC16): function, regulation, and role in health and disease. Pharmacol Rev. 2020;72(2):466–485. doi:10.1124/pr.119.018762.
- Lasko LM, Jakob CG, Edalji RP, Qiu W, Montgomery D, Digiammarino EL, Hansen TM, Risi RM, Frey R, Manaves V. et al. Discovery of a selective catalytic p300/CBP inhibitor that targets lineage-specific tumours. Nature. 2017;550(7674):128–132. doi:10.1038/nature24028.
- Chauhan D, Tian Z, Nicholson B, Kumar K, Zhou B, Carrasco R, McDermott J, Leach C, Fulcinniti M, Kodrasov M. et al. A small molecule inhibitor of ubiquitin-specific protease-7 induces apoptosis in multiple myeloma cells and overcomes bortezomib resistance. Cancer Cell. 2012;22(3):345–358. doi:10.1016/j.ccr.2012.08.007.
- Chow A, Perica K, Klebanoff CA, Wolchok JD. Clinical implications of T cell exhaustion for cancer immunotherapy. Nat Rev Clin Oncol. 2022;19(12):775–790. doi:10.1038/s41571-022-00689-z.
- Sade-Feldman M, Yizhak K, Bjorgaard SL, Ray JP, de Boer CG, Jenkins RW, Lieb DJ, Chen JH, Frederick DT, Barzily-Rokni M. et al. Defining T cell states associated with response to checkpoint immunotherapy in melanoma. Cell. 2018;175(4):998–1013.e1020. doi:10.1016/j.cell.2018.10.038.
- Frebel H, Nindl V, Schuepbach RA, Braunschweiler T, Richter K, Vogel J, Wagner CA, Loffing-Cueni D, Kurrer M, Ludewig B. et al. Programmed death 1 protects from fatal circulatory failure during systemic virus infection of mice. J Exp Med. 2012;209(13):2485–2499. doi:10.1084/jem.20121015.
- Miller BC, Sen DR, Al Abosy R, Bi K, Virkud YV, LaFleur MW, Yates KB, Lako A, Felt K, Naik GS. et al. Subsets of exhausted CD8+ T cells differentially mediate tumor control and respond to checkpoint blockade. Nat Immunol. 2019;20(3):326–336. doi:10.1038/s41590-019-0312-6.
- Liu Y, Zhou N, Zhou L, Wang J, Zhou Y, Zhang T, Fang Y, Deng J, Gao Y, Liang X. et al. IL-2 regulates tumor-reactive CD8+ T cell exhaustion by activating the aryl hydrocarbon receptor. Nat Immunol. 2021;22(3):358–369. doi:10.1038/s41590-020-00850-9.
- Mo F, Yu Z, Li P, Oh J, Spolski R, Zhao L, Glassman CR, Yamamoto TN, Chen Y, Golebiowski FM. et al. An engineered IL-2 partial agonist promotes CD8(+) T cell stemness. Nature. 2021;597(7877):544–548. doi:10.1038/s41586-021-03861-0.
- Koppenol WH, Bounds PL, Dang CV. Otto Warburg’s contributions to current concepts of cancer metabolism. Nat Rev Cancer. 2011;11(5):325–337. doi:10.1038/nrc3038.
- Kaymak I, Luda KM, Duimstra LR, Ma EH, Longo J, Dahabieh MS, Faubert B, Oswald BM, Watson MJ, Kitchen-Goosen SM. et al. Carbon source availability drives nutrient utilization in CD8+ T cells. Cell Metab. 2022;34(9):1298–1311.e6. doi:10.1016/j.cmet.2022.07.012.
- Feng Q, Liu Z, Yu X, Huang T, Chen J, Wang J, Wilhelm J, Li S, Song J, Li W. et al. Lactate increases stemness of CD8 + T cells to augment anti-tumor immunity. Nat Commun. 2022;13(1):4981. doi:10.1038/s41467-022-32521-8.
- Granieri L, Marocchi F, Melixetian M, Mohammadi N, Nicoli P, Cuomo A, Bonaldi T, Confalonieri S, Pisati F, Giardina G. et al. Targeting the USP7/RRM2 axis drives senescence and sensitizes melanoma cells to HDAC/LSD1 inhibitors. Cell Rep. 2022;40(12):111396. doi:10.1016/j.celrep.2022.111396.
- Dai X, Lu L, Deng S, Meng J, Wan C, Huang J, Sun Y, Hu Y, Wu B, Wu G. et al. USP7 targeting modulates anti-tumor immune response by reprogramming tumor-associated macrophages in lung cancer. Theranostics. 2020;10(20):9332–9347. doi:10.7150/thno.47137.
- Yu YR, Imrichova H, Wang H, Chao T, Xiao Z, Gao M, Rincon-Restrepo M, Franco F, Genolet R, Cheng W-C. et al. Disturbed mitochondrial dynamics in CD8+ TILs reinforce T cell exhaustion. Nat Immunol. 2020;21(12):1540–1551. doi:10.1038/s41590-020-0793-3.
- Horn D, Zhou W, Trevisson E, Al-Ali H, Harris TK, Salviati L, Barrientos A. The conserved mitochondrial twin Cx9C protein Cmc2 Is a Cmc1 homologue essential for cytochrome c oxidase biogenesis. J Bio Chem. 2010;285(20):15088–15099. doi:10.1074/jbc.M110.104786.